Welcome to TrendInvestorPro Premium Services
Contents of this Page
- Subscriber Bonuses
- TrendInvestorPro Premium Services
- Site Navigation Menu
- Publishing Schedule, Vacation & Email Alerts
- Objective and Systematic Chart Analysis
- Tools of the Trade
TrendInvestorPro Premium Services
Improve your edge with trading setups designed to catch the next move and momentum strategies designed to trade the leaders.
Here are the Premium Services:
Current Analysis & Videos – Publishing on Tuesdays, Wednesdays and Thursdays, this page contains the most recent chart analysis and videos. New posts are at the top for easy access. The goal is to define the long-term trend and identify short to medium term trading setups in stocks and ETFs.
Market Regime Charts – Updated every Wednesday, this page defines the broad market environment: bull or bear market. There are charts covering the breadth models, yield spreads and US Treasury yields.
Research & Education – Updated periodically, this page contains research and education reports for further understanding.
Systematic Strategies – There are two reports for each strategy. First, the reports on Strategy Details cover the rationale, indicators, signals and rank tables. Second, the reports on Performance Metrics cover the equity curve, returns, drawdowns, profit factor, win rate and more.
Signals & Ranking Tables – Updated every Saturday, this page features the signal/portfolio pages and ranking tables for each strategy. The signal/portfolio pages show the current positions, new entries/exits, recently closed positions and the top ranked names. The ranking table pages show all Nasdaq 100 and S&P 500 stocks, and the complete ETF universe.
Stock Market Model (SMM) – This page is updated every Saturday with a chart showing prior signals and the current signal. A special report and email alert will be issued if conditions change between updates.
Site Navigation
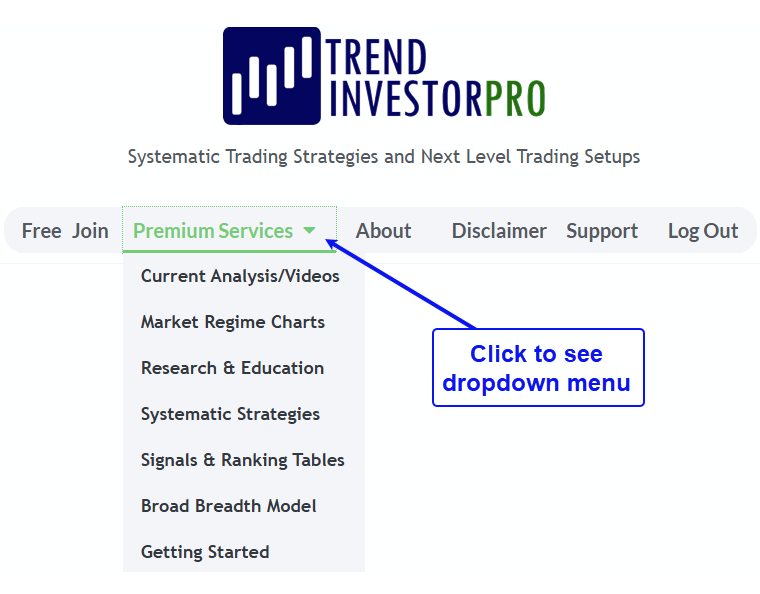
Navigation links are at the top of every webpage. Use the “Premium Services” dropdown menu to access member content.
Publishing Schedule, Vacation & Email Alerts
-
Current Analysis & Videos are posted Tues, Wed and Thurs by 9AM ET.
The Market Regime Charts are updated on Wednesdays.
The Signal/Ranking Tables and Broad Breadth Model are updated on Saturdays. -
We do not publish Thanksgiving week or between Christmas and New Year.
We take two weeks off in the summer for family vacation. -
Email alerts are sent when new reports are published.
See link below to join the list.
Objective and Systematic Chart Analysis
While working in London, I had the pleasure of meeting the late David Fuller and learning from his presentations. David noted that there are three possibilities when we analyze a chart.
- First, we see what we WANT to see. This usually means our biases are interfering with our analysis and distorting our vision.
- Second, we see what we THINK we see. This usually means we do not have a robust analytical process to objectively work through a chart.
- Third, we see what is REALLY there. A systematic and objective approach to chart analysis will help us see what is really on the chart.
TrendInvestorPro is all about seeing what is really there. We cannot expect to get it right all of the time, but a systematic and objective approach will greatly improve our odds. After all, trading and investing are all about odds so we should do everything we can to improve these odds.
Tools of the Trade
First and foremost, I use Amibroker and Norgate data for system development, backtesting and explorations. It is one of the fastest, cleanest and most versatile platforms out there. There is quite a learning curve because it requires detailed coding.
Second, I use SharpCharts from StockCharts.com for layouts, annotation and chart analysis. I especially like their CandeGlance format for a quick overview.
I also created the TIP Indicator Edge Plug-In for StockCharts ACP. This plugin includes 11 unique indicators for trend following, mean-reversion setups, trailing stops and volatility. See this article for complete explanations and chart examples.
Third, I use TradingView (affiliate link here) when following the markets during trading hours. They offer a wide array of indicators and data sources.