")
This content is for subscribers. (Login or Subscribe)

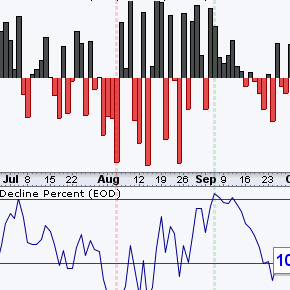
ChartTrader – An Indicator to Identify the Pop after Apple Hits Support-Reversal Zone (Premium)
Tech stocks were hit with selling pressure to start the year, but many are still in long-term trends and some are nearing support-reversal zones. In particular, Apple (AAPL) fell to a support-reversal zone and I am on alert for a bounce. Let’s investigate.