")
Bottoming Process – Capitulation, Short and Medium Term Thrusts, Regime Change
- Arthur Hill, CMT

The market does not always follow the same script or sequence, but bear markets end with a bottoming process marked by stages. These stages include capitulation, short-term thrust, medium-term thrust and long-term regime change. The first two stages mark downside excess and the initial turn around, while the last two signal strong follow through. Today’s report will look at the four different phases and assess current conditions.
- Phase 1: Capitulation
- Phase 2: Short-term Thrust Signals (ZBT and %Above 20-day SMA)
- Phase 3: Medium-term Thrust Signals
- Capitulation and Thrust Indexes
- Phase 4: Long-term Breadth Indicators turn Bullish
- Short-term Improvements, but Longer Term Bearish
- Using Phases to Scale Into the Market
Phase 1: Capitulation
The capitulation phase of a bear market occurs when traders throw in the towel. Downside momentum and selling pressure accelerate. Usually, the capitulation phase occurs after an extended decline, and this phase is the first step to a bottom. Here are some hallmarks of the capitulation phase:
- SPY is well below its 200-day SMA and in a long-term downtrend
- Sentiment indicators show excessive bearishness (AAII, Investors Intelligence)
- The percentage of stocks above the 200-day SMA is below 20%
- SPY is more than 3 standard deviations below its 200-day SMA
- SPY falls sharply in a short period of time (10-day ROC < -10%).
The chart below shows SPY with Bollinger Bands (200,3), %B (200,3), S&P 500 Percent Above 200-day SMA ($SPXA200R) and ROC(10). I am not showing a sentiment indicator because I have not had much success using sentiment extremes for timing. Signs of capitulation emerge when %B is below 0, fewer than 20% of S&P 500 stocks are above their 200-day SMAs and 10-period ROC is below -10%. The blue dashed lines show capitulation in June 2022, September 2022 and early April 2025.
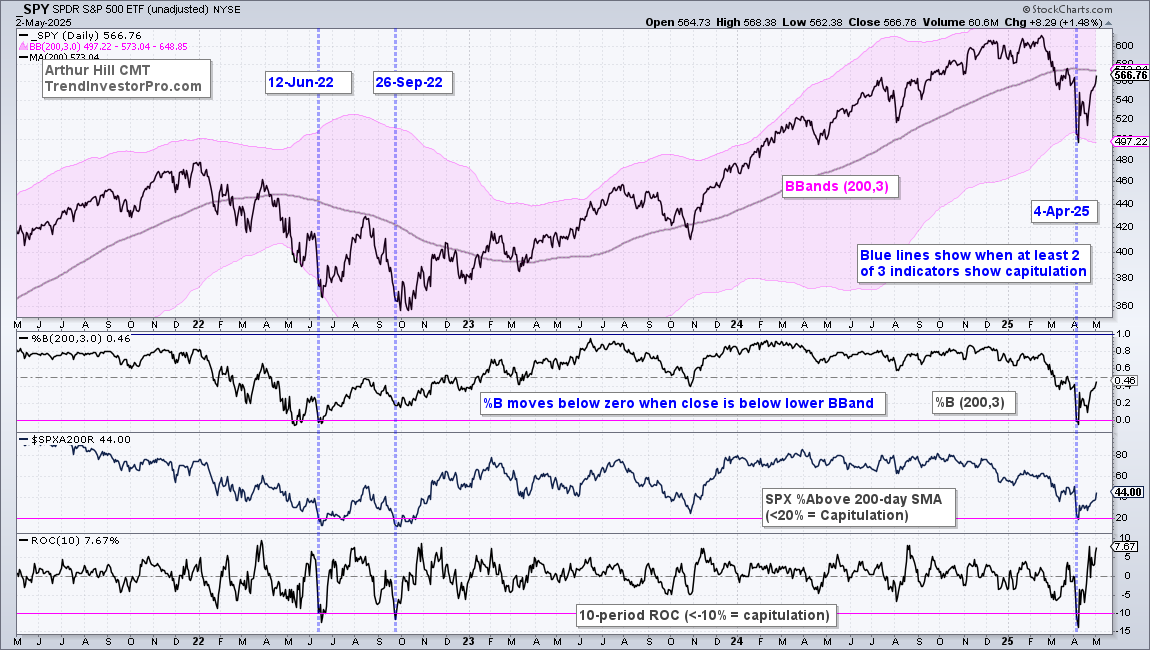
The three capitulation setups look pretty good on this chart. However, keep in mind that the knife is still falling when capitulation setups occur. Two of the three indicators signaled on 12-Jun-22 and the bottom was the following week (17-Jun-22). Similarly, there was a capitulation setup on 26-Sep-22 and a bottom on 12-Oct-22. Most recently, there was a capitulation setup on 4-Apr-25 and a bottom on 8-Apr-25.
Phase 2: Short-term Thrust Signals (ZBT and %Above 20-day SMA)
Thrust signals trigger when there is an upside “thrust” from an oversold extreme. The Zweig Breadth Thrust is perhaps the most famous thrust indicator these days. We covered the ZBT extensively the last few weeks and introduced a strategy in this research report. The chart below shows the S&P 1500 ZBT indicator in the lower window (10-day EMA of S&P 1500 AD%). A thrust signal triggered on April 24th and remains in play. Five consecutive closes below the lower Keltner line would negate this thrust signals.
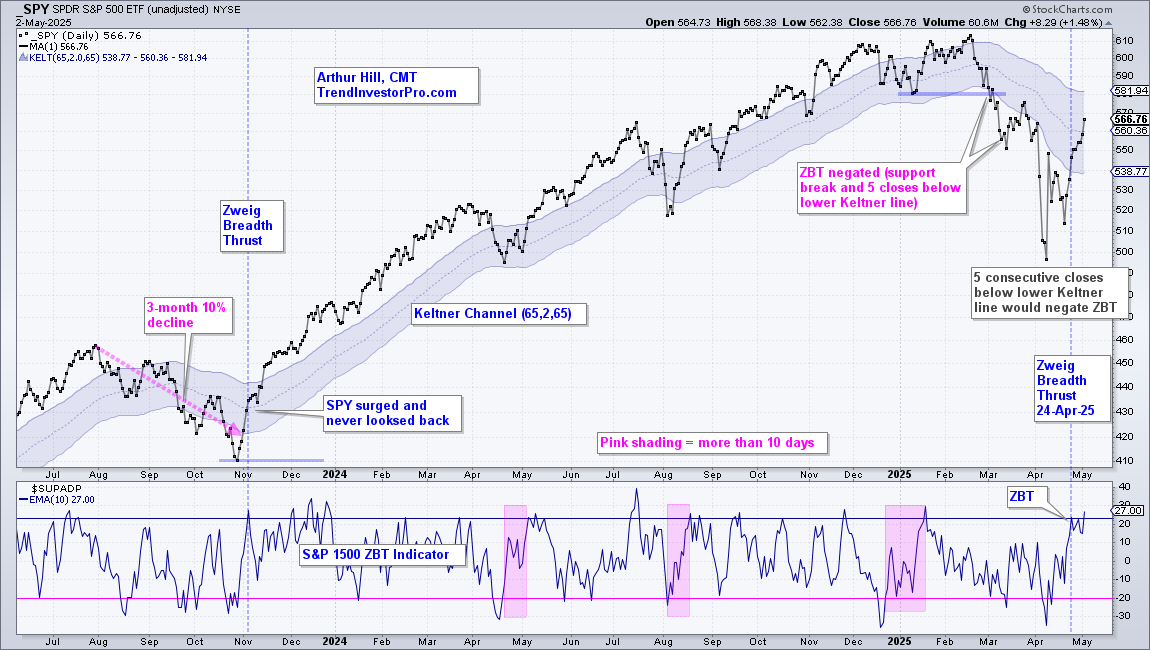
A thrust signal after a capitulation setup is very powerful, but not all thrust signals are preceded by a capitulation setup. For example, we did not get a capitulation setup before the ZBT in early November 2023, and this signal was a dandy. At the time, SPY was in the midst of three month decline and down around 10% from its late July high. The late October plunge created the oversold extreme and the early November thrust marked the reversal.
The rest of this report is reserved for subscribers. We will cover a second short-term thrust indicator, a medium term Thrust Index and the long-term market indicators.
This week at TrendInvestorPro we updated the Zweig Breadth Thrust strategy, featured the ETF leaders and expanded on our broad market stance. Stocks moved from capitulation in early April to short-term thrust signals a few weeks a later. The cup, however, remains half empty. We are watching to see if our medium and long term models join the bullish parade.
Click here to subscribe and get immediate access to these reports and videos.
This content is for subscribers. (Login or Subscribe)
As with most thrust signals, they are only good for bullish signals. We need to use another indicator or the price chart for sell signals. A support break for the S&P 500 EW ETF (RSP) could be used as an exit. Alternative, five consecutive closes below the lower Keltner Line (65,2,65) could also be used for an exit signal.
Phase 3: Medium-term Thrust Signals (%Above 50-day SMA)
I classify the Zweig Breadth Thrust and S&P 1500 %Above 20-day SMA thrust signals as short-term signals. ZBT signals must signal within a 10 day window. %Above 20-day SMA signals are based on a short-term moving average. Thus, this indicator has the most frequent signals.
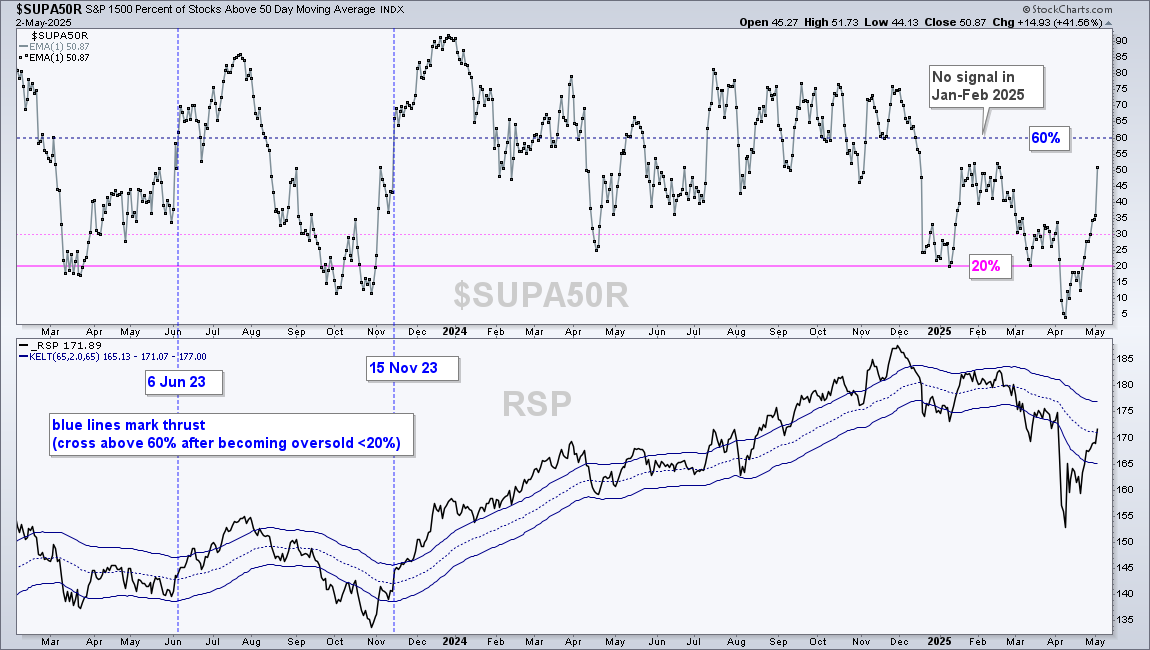
There is also a medium-term thrust indicator lurking in the shadows. S&P 1500 Percent Above 50-day SMA ($SUPA50R) sets up with a move below 20% and triggers with a subsequent surge above 60%. The 50-day SMA is more than twice as long as the 20-day SMA, which means more lag. This is why I use a different setup (20%) and signal thresholds (60%). The chart below shows two signals since April 2023. This indicator set up with the dip below 20% in early April and surged over the last few weeks. A close above 60% would trigger a thrust signal.
Capitulation and Thrust Indexes
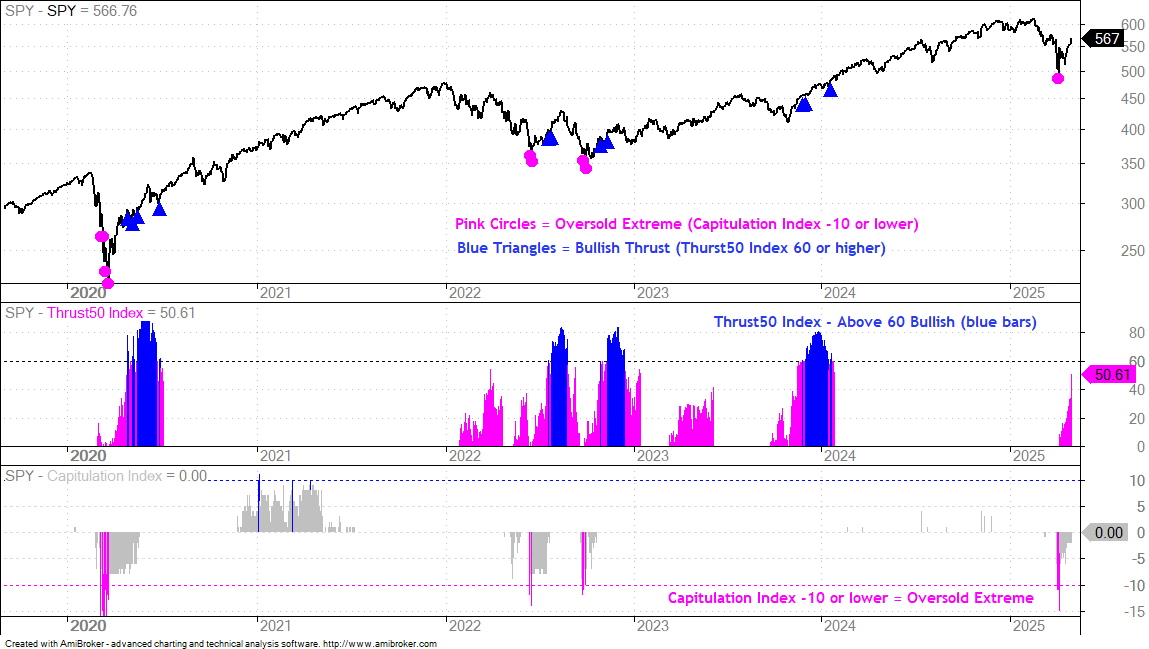
I created a Capitulation Index based on %Above 200-day SMA, 52-week High-Low Percent and some other long-term indicators (16 in total). A capitulation setup occurs when 10 or more are at oversold extremes. The pink circles show these extremes in March 2020, June 2022, September 2022 and April 2025.
I also created a medium-term thrust indicator using the percentage of stocks above the 50-day SMA for the Nasdaq 100, S&P 500, S&P MidCap 400 and S&P SmallCap 600. This Thrust50 Index sets up with a move below 20% and triggers with a subsequent move above 60%. The blue triangles show these thrust signals.
There was a capitulation setup in early April (pink circle), but we have yet to see a thrust signal, which requires the Thrust50 Index to exceed 60%. Such a move would show broadening strength within the stock market.
Phase 4: Long-term Breadth Indicators turn Bullish
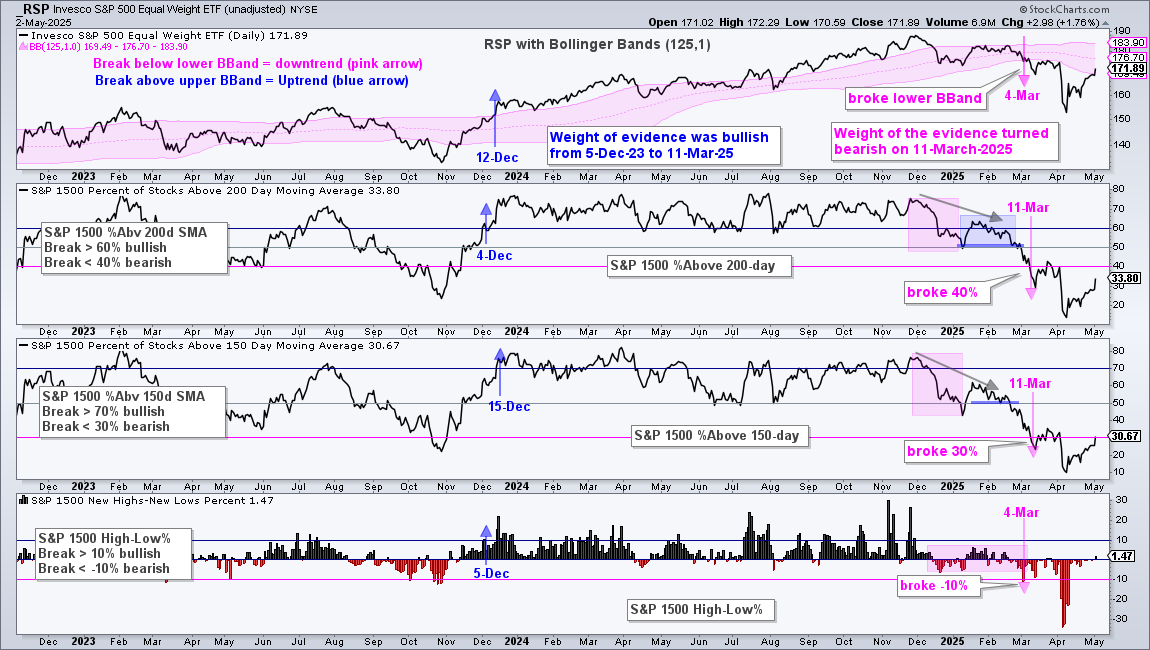
And finally, we have the long-term trend and breadth indicators, which make up the Market Regime. I am not going to show all of the charts, but will note that the long-term trend evidence remains bearish. Trend indicators are often the last to change because trend-following indicators lag. These indicators include the percentage of stocks above their 200 and 150 day SMAs, as well as 52-wk High-Low Percent. As the chart below shows, only 34% of S&P 1500 stocks are above their 200-day SMAs, 31% are above their 150-day SMAs and we have yet to see new highs expand. The vast majority of stocks are in long-term downtrends and this means the market regime is bearish.
Short-term Improvements, but Longer Term is Still Bearish
Current Setups and Signals
- Capitulation – 4 April 2025
- Zweig Breadth Thrust – 24 April 2025
- %Above 20-day SMA Thrust – 28 April 2025
- Thrust50 Index – No Signal
- Market Regime – Bear Market since 13 March 2025
The long-term trend and breadth indicators turned bearish in mid March – and remain bearish. This means the current bounce, while strong, could still be a bear market bounce. Note that SPY surged 10% and QQQ surged 17% in eleven days in March 2022, which turned out to be a bear market bounce.
Market conditions improved since the early April capitulation, as did volatility. This phase gave way to an oversold bounce that triggered bullish signals from the short-term thrust indicators. There are still two more steps needed: one medium-term oriented and one long-term oriented. A thrust signal from the Thrust50 Index would show medium-term improvement, but the Market Regime change is needed to move from bear market to bull market.
Using these Phases to Scale Into the Market
Traders looking to accumulate and build positions can consider scaling-in based on capitulation, thrust signals and regime change. Personally, I place most emphasis on the Market Regime so it gets the biggest weighting (40%). A capitulation setup could warrant 20% exposure for bottom pickers. Zweig Breadth Thrusts or %Above 20-day SMA thrusts would warrant another 20% exposure. A medium-term thrust signal from %Above 50-day SMA would argue for another 20%. And finally, a bullish Market Regime would bring the total to 100% (fully invested). A bullish Market Regime means a bullish market and this is the signal to be fully invested.