")

Utes, Infrastructure and Telecom Lead – Gold is Stuck – Bitcoin Returns to Breakout
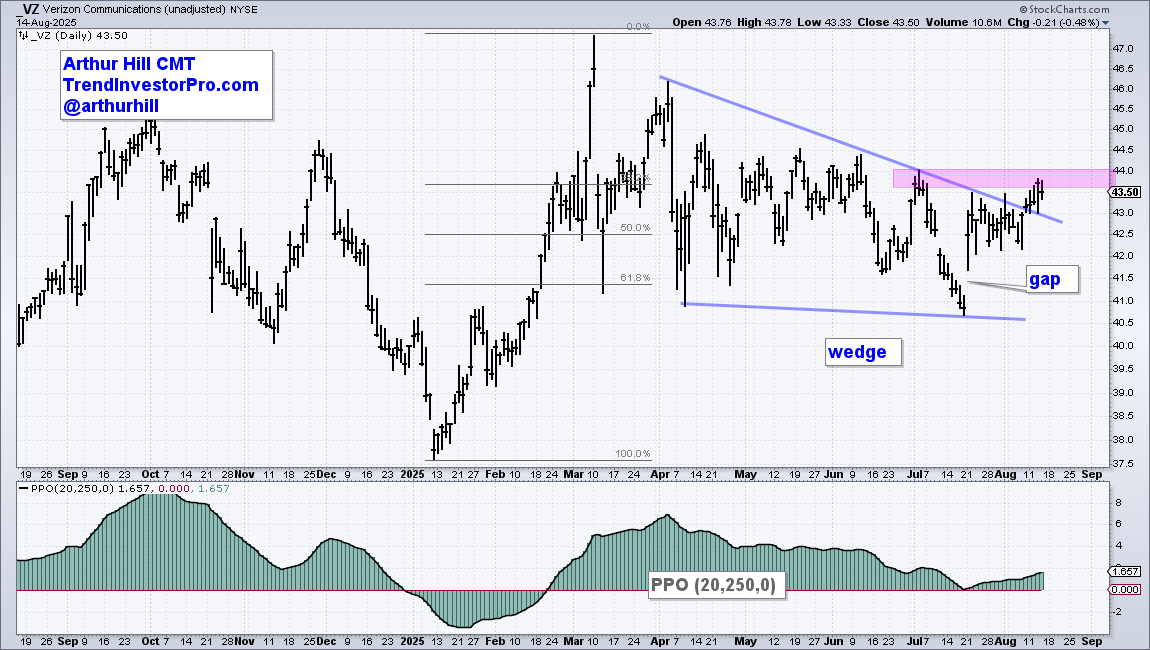
We are seeing leading uptrends in ETFs related to defensive groups: Utilities, Infrastructure and Telecom. All three hit new highs in August and have strong uptrends working. Elsewhere gold is stuck in a trading range with a classic pattern taking shape and Bitcoin returned to the scene of its prior breakout.
Utes, Infrastructure and Telecom Lead – Gold is Stuck – Bitcoin Returns to Breakout Read More »