

Video and Report Headlines
- Nikkei Breakdown Started in July
- Long-term Breadth Remains Bullish
- SPY Corrects within Bigger Uptrend
- QQQ Bounces off Rising 200-day SMA
- MAGS Corrects Along with QQQ
- VIX Falls Towards 20
- NDVA Bounces off Support-Retracement Zone
- AVGO Corrects after New High
- GE Healthcare Holds Breakout
- Abbott Labs Surges off Key Retracement
The next Chart Trader will be posted on Thursday morning, August 15th.
Nikkei Breakdown Started in July
Stocks were broad-sided on Monday, August 5th, as the Japanese central bank announced a rate hike and the Nikkei plunged. Note that this plunge started the prior Thursday/Friday as the Nikkei fell 10% in just two days. It continued lower on August 5th and the contagion spread to other markets. Selling pressure in the US also began on Thursday and Friday, August 1st and 2nd. Stocks opened weak on Monday, August 5th, but moved higher after the open and closed well off the lows.
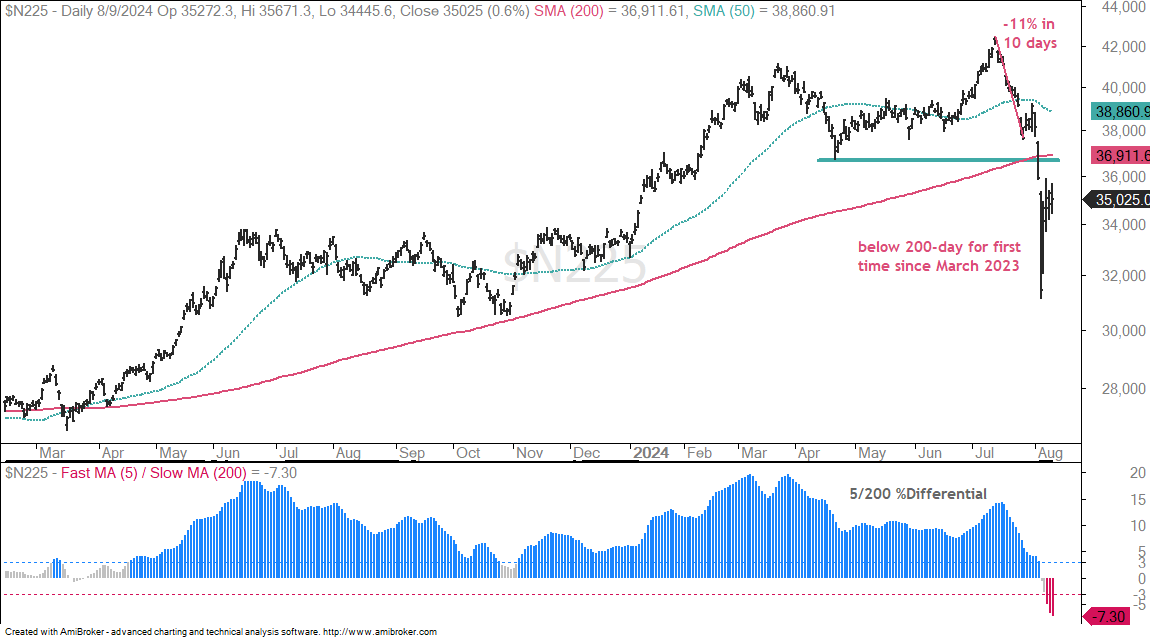
I do not know enough about the Yen carry trade to comment on its future ramifications for US stocks. I will, however, point out that the Nikkei fell 11% from its July high (July 11th to 26th) and broke its 200-day SMA on Friday, August 2nd. There is a clear trend change on this chart. Also notice that the 5/200 %Differential moved below -3% three days ago. The long-term trend is now down for the Nikkei.
Long-term Breadth Remains Bullish
The %Above 200-day SMA and 26-week High-Low Percent indicators remain net bullish. Some 64% of S&P 500 stocks are above their 200-day SMAs and around 50% of Nasdaq 100 stocks are above their 200-day SMAs. S&P 500 stocks are stronger than Nasdaq 100 stocks, which has been the case since March. As noted with the dark arrows on the chart, this is when SPX %Above 200-day moved higher and NDX %Above 200-day SMA moved lower.
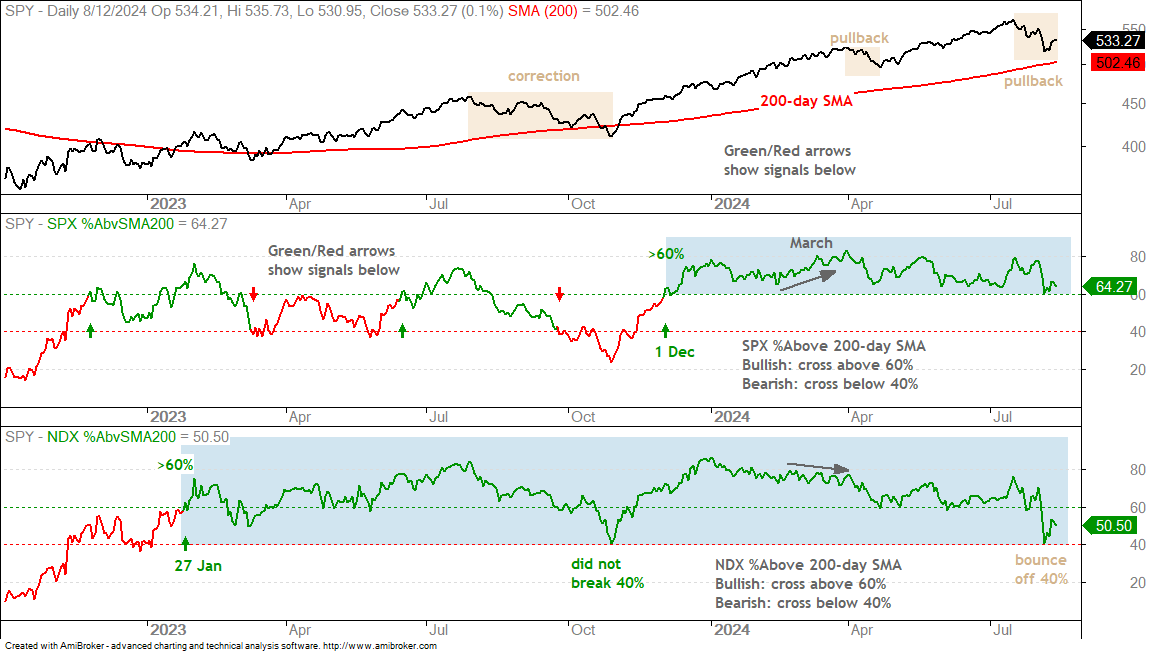
Overall, SPX %Above 200-day SMA has held at 60% or higher since December 2023 (middle window on chart above). The cup is clearly half full when more than 60% of the S&P 500 components are above their 200-day SMAs. A break below 60% would not be long-term bearish, but it would show an increase in downside participation and argue for a SPY test of the 200-day SMA around 502. NDX %Above 200-day shows that half of Nasdaq 100 stocks are below their 200-day SMAs. NDX is still the laggard here and this shows some risk aversion for large-cap tech.
SPX 26wk HiLo% (middle window on chart below) remains in bull mode. A move above 20% is bullish and this bull signal remains until a move below -20%. The indicator surged above +20% in early July with broad strength. It turned negative with broad selling pressure on August 5th, but did not come close to triggering bearish.
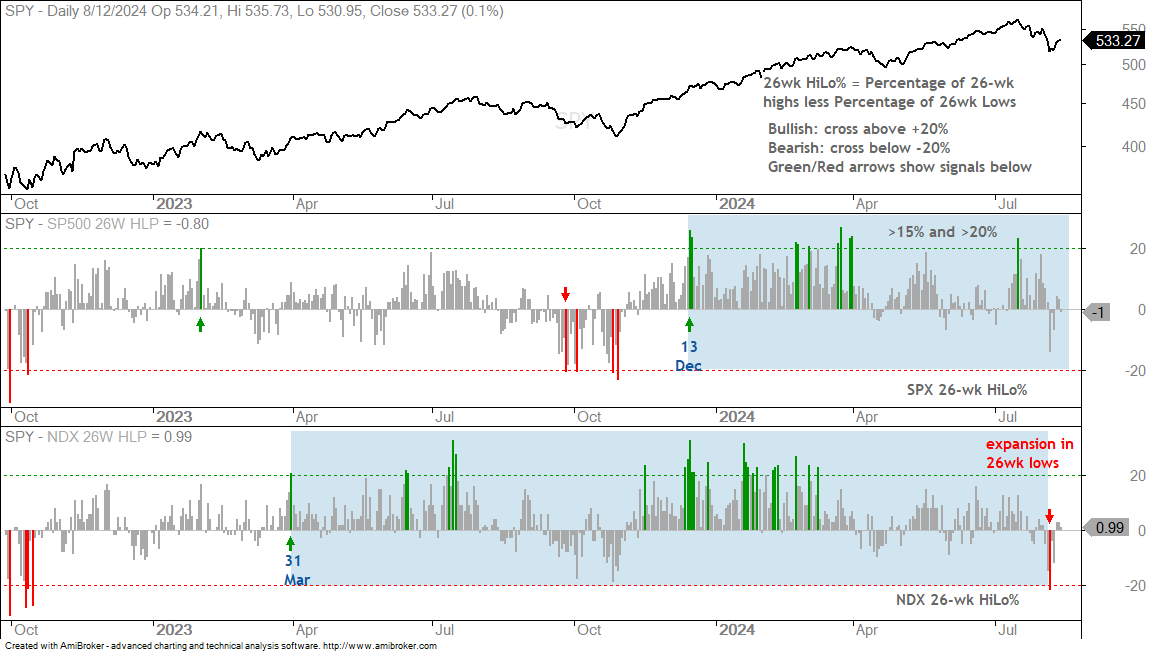
NDX 26wk HiLo%(bottom window on chart above) plunged below 20% on August 5th and this shows a sharp increase in 26 week lows (six month lows). The reaction to the Nikkei triggered the move below -20%, but this indicator fell to -15% the Friday before, which was its lowest level since October. Thus, the selling pressure increased before the Yen carry-trade fiasco.
SPY Corrects within Bigger Uptrend
SPY is currently correcting within a bigger uptrend. Long-term, the ETF hit a new high in mid July and remains above the rising 200-day SMA. In the bottom window, the 5/200 %Differential is bullish, even though it fell to 5%. This means the 5-day SMA is 5% above the 200-day SMA.
Short-term, SPY peaked in mid July and fell below 520 last week Monday (August 5th). Most of the blame goes to the Yen carry trade unwind, but note that this decline started with sharp moves lower on Thursday 1-Aug (-1.4%) and Friday 2-Aug (-1.9%). The 5-Aug decline was an over-reaction, but it was part of the pullback that began in mid July. SPY recovered the losses from August 5th, but has yet to recover the losses from the 1st and the 2nd.
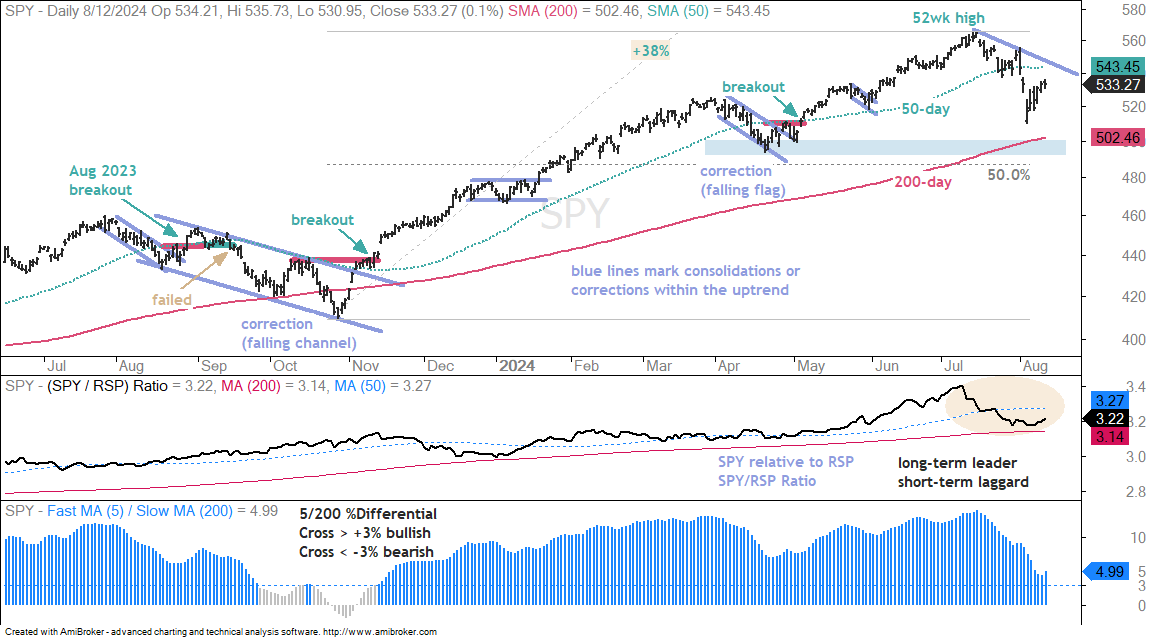
Right now, the bounce over the last five days is just an oversold bounce within the current pullback. I am marking short-term resistance at the 50-day SMA (544). A breakout here is needed to reverse the short-term downswing. As long as SPY remains in pullback mode, my downside target is in the Support-Retracement Zone in the 485-500 area. First, there is support from the April low around 496. Second, there is support from the rising 200-day SMA around 500. Third, a 50% retracement of the October-July advance extends to the 487 area.
QQQ Bounces off Rising 200-day SMA
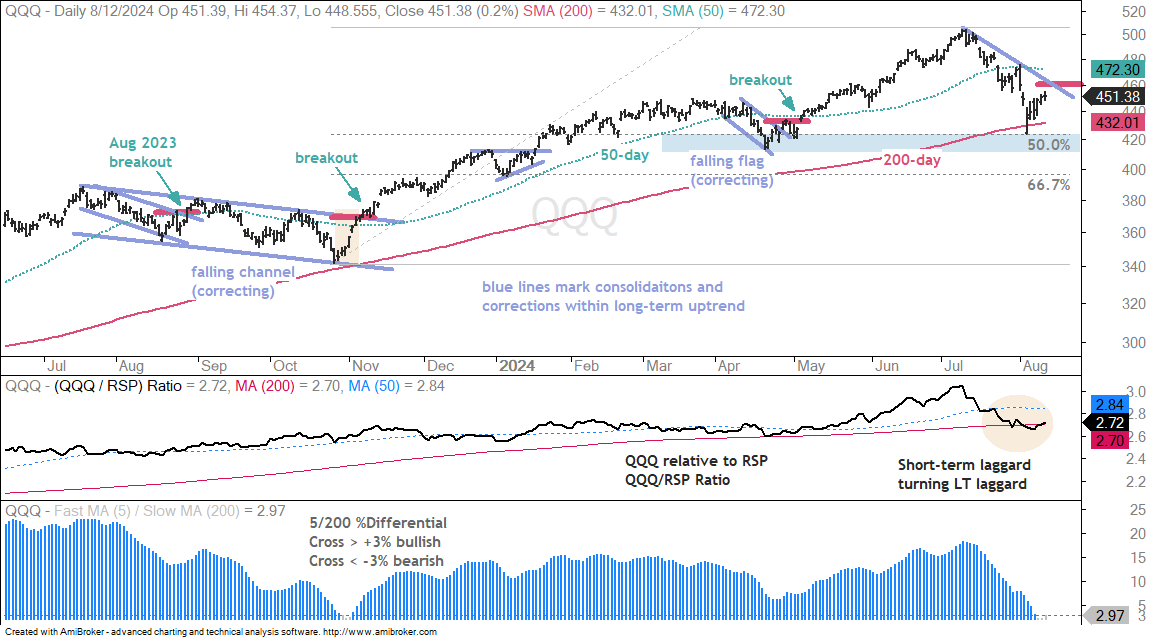
QQQ fell further than SPY as large-cap techs bore the brunt of selling pressure. QQQ tagged its rising 200-day SMA last week Monday (August 5th) and then bounced the last five days. As with SPY, the long-term trend is still up and QQQ is correcting within this uptrend. I am marking short-term resistance at 460. A breakout here would be bullish and reverse the short-term downswing. QQQ closed at 451.38 so this means a +2% gain is needed for a breakout.
MAGS Corrects Along with QQQ
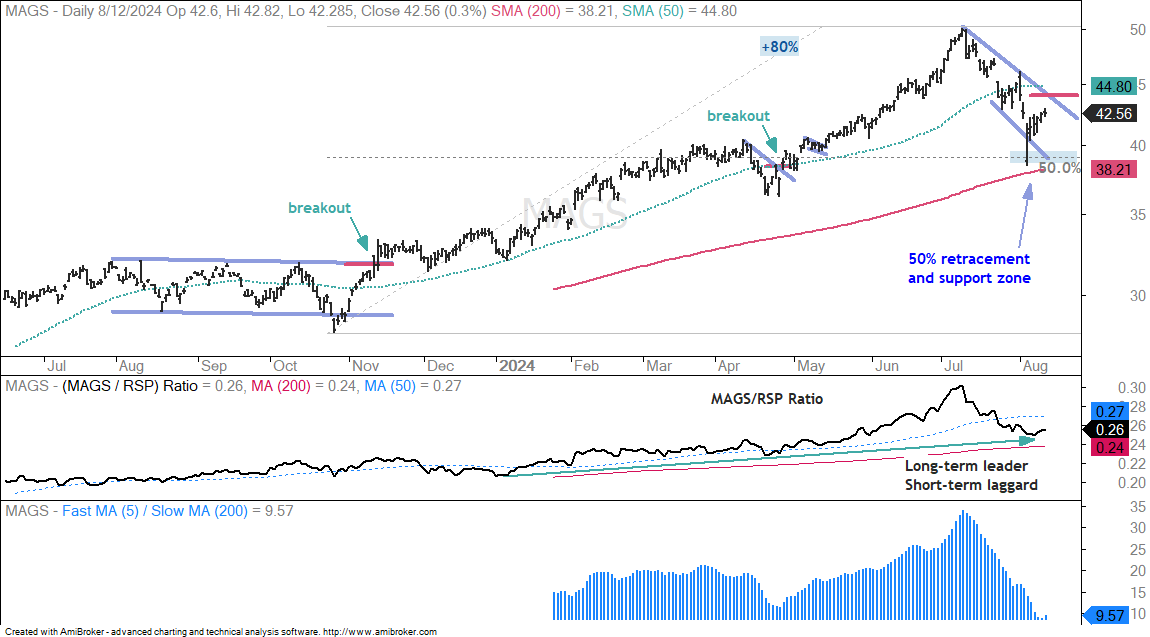
Stocks in the Mag7 ETF (MAGS) are a big part of QQQ and stocks in the Nasdaq 100 are a big part of the S&P 500 SPDR (SPY). MAGS drives QQQ and QQQ drives SPY. MAGS advanced 80% from October to July and then fell over 20% from July to August (high to low). At the August 5th nadir, this decline retraced 50% of the entire advance and almost hit the rising 200-day SMA. Big advances often lead to big pullbacks, but we can see that this pullback still fits the criteria for a correction within a bigger uptrend. I am marking short-term resistance at 44. A breakout here would reverse the short-term slide and be bullish.
VIX Falls Towards 20
Before looking at the VIX, keep in mind that it is largely a coincident indicator. SPY plunges and VIX surges. SPY settles down and VIX settles down. In my opinion, VIX is not the driver. It is just an indicator that reacts to stock market moves and measures fear. As such, spikes in the VIX show excessive fear that can lead to a bounce. However, we can also see regime changes when VIX works its way higher (yellow shading) and SPY moves lower, such as in 2022. Most recently, VIX surged to 39 on August 5th and fell back to 20.71 on August 12th, a week later. This is because SPY stabilized and bounced. Short-term breakouts in SPY and QQQ would likely push VIX below its mid April high (19). This would put the VIX back into its low fear environment, which would be positive for stocks.
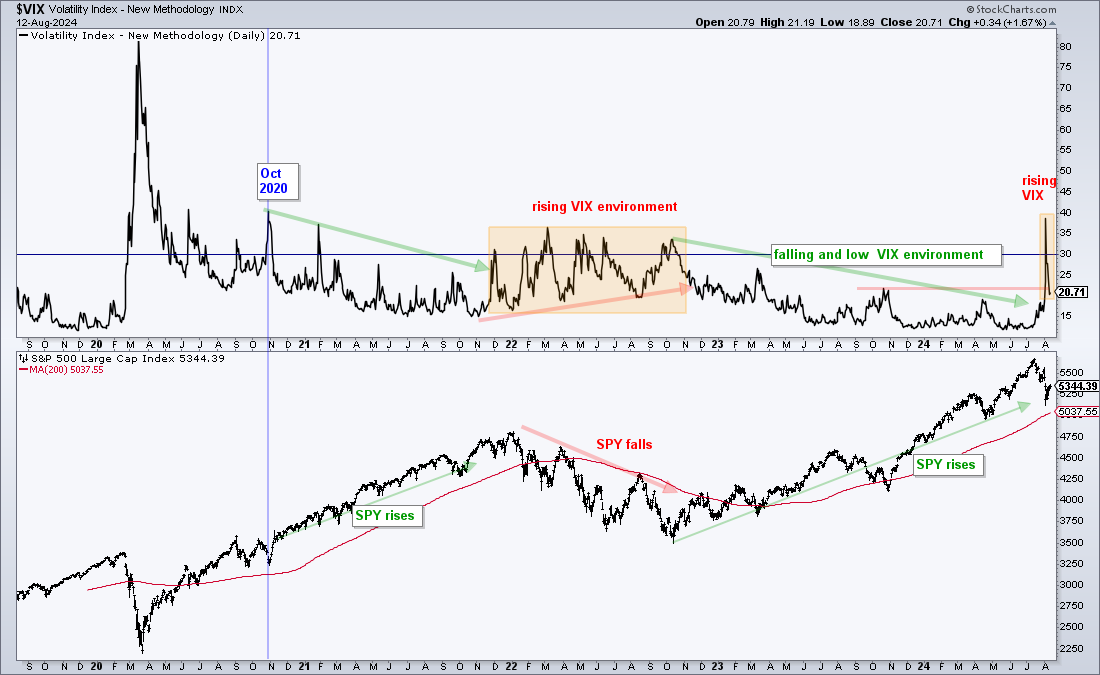
Chart Analysis, Setups and Trading Ideas
The next four charts show two AI stocks and two healthcare stocks. NVDA and AVGO are currently correcting after hitting 52-week highs. They are above their rising 200-day SMAs, but still in short-term downtrends since July. The risk here is that these corrections extend and we see a battle near the 200-day SMAs. This could happen should broad market conditions remain mixed or choppy. For an idea of what the battle at the 200-day SMA can look like, we then turn to GEHC and ABT. Both hit their 200-day SMAs in April and are still close to their 200-day SMAs. In other words, the 200-day SMA was a multi-month battle zone.
NDVA Bounces off Support-Retracement Zone
Nvidia (NVDA) is the king of the Mag7 and AI trade, and the stock reports on August 28th. The stock surged 260% from October to June and 85% from April to June. These are massive moves. NVDA led the market pullback with a decline back to the low 90s and was down around 35% from peak to trough. This is indeed a big decline, but it comes after massive advances and the stock remains well above the rising 200-day SMA. This decline fits the criteria for a correction within a bigger uptrend. The decline retraced 67% of the October-June advance and 50% of the April-June advance. It also returned to the breakout zone (blue shading). This amounts to a Support-Retracement Zone, which is an area to watch for a reversal.
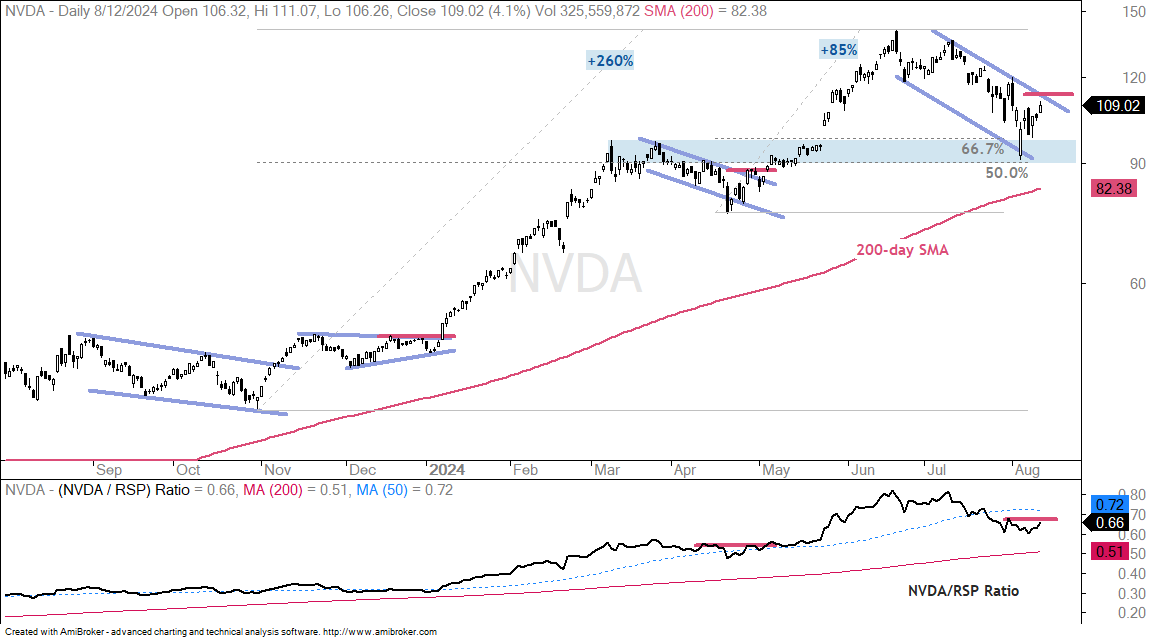
The blue trendlines define the short-term downtrend with resistance marked at 113, which is around 4% higher than the last close (109.02). A breakout here would signal an end to the correction and a resumption of the bigger uptrend. The indicator window shows the NVDA/RSP ratio falling from June to August as the stock underperforms recently. It is still a long-term outperformer because the price-relative remains well above its 200-day SMA. The red line marks relative resistance and a breakout here would be bullish.
AVGO Corrects after New High
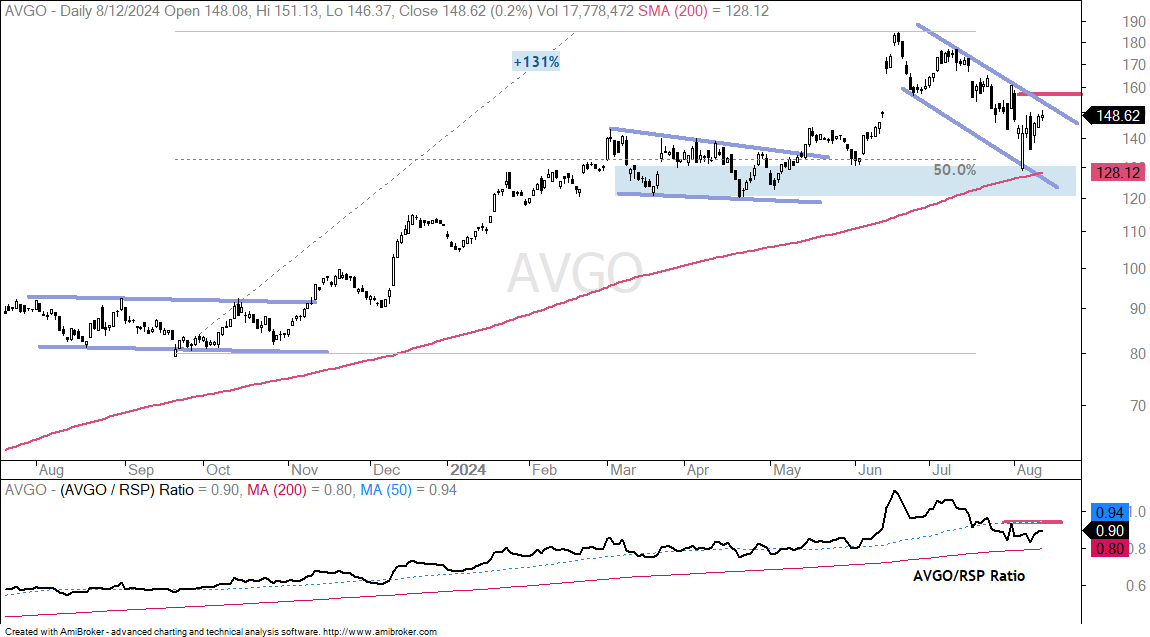
The next chart shows Broadcom (AVGO) with a chart similar to Nvidia. This is no surprise because Broadcom is usually mentioned right after Nvidia when it comes to the AI trade. AVGO advanced 131% from September to June and then fell 28% from the June high to the early August low. As with NVDA, this decline is viewed as a correction within a bigger uptrend because AVGO is above the rising 200-day SMA. The blue shading marks a Support-Retracement Zone based on the 50% retracement, the 200-day SMA and the lows from March to May. AVGO remains in a short-term downtrend with resistance marked at 157. A breakout here would reverse the slide and signal a continuation higher. Also watch the AVGO/RSP ratio for a breakout to show a return to relative strength.
GE Healthcare Holds Breakout
GE Healthcare (GEHC) is showing strength since mid June as it advances in the face of a market pullback. The long-term trend is also up with a nice wedge breakout in play. GEHC surged 50% into March and then corrected with a return to the 200-day SMA in May. A large falling wedge formed as the stock retraced 50-67 percent of the prior advance. Notice that there was a battle around the 200-day as the stock first touched this moving average on April 30th and last touched on August 7th.
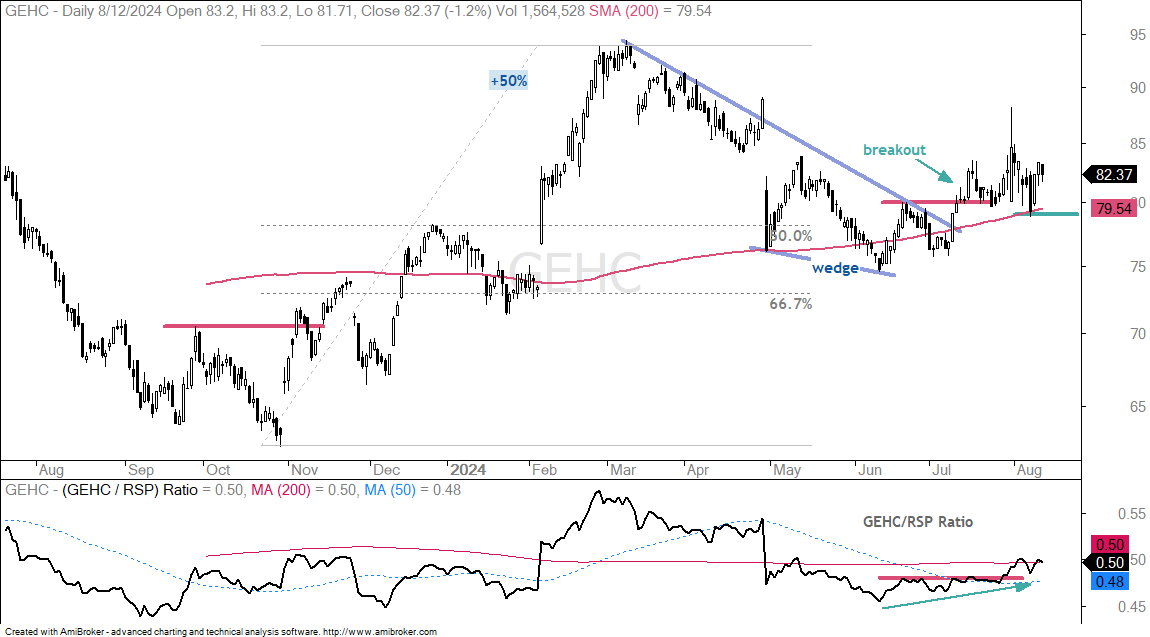
I am impressed with GEHC because it broke out in mid July, fell back to this breakout zone in early August and bounced the last three days. Overall, I think the mid July breakout is holding and long-term bullish. With the bounce over the last three days, the stock established short-term support at 79, which can be used as the re-evaluation level.
Abbott Labs Surges off Key Retracement
The next chart shows Abbott Labs (ABT) with a similar setup as GE Healthcare. ABT advanced 35% and then corrected with a falling wedge that retraced 67%. This amounts to three steps forward and two steps ) backward (2/3 or 67). It was a deep and extended correction as price dipped well below the 200-day SMA.
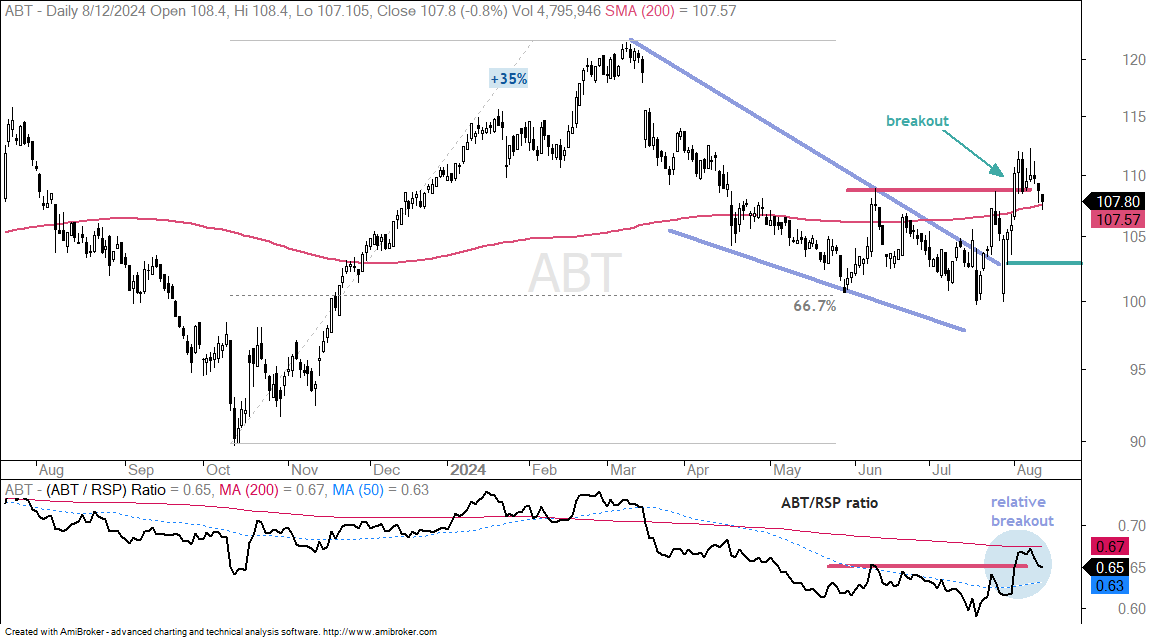
ABT broke free with a surge in early August as it exceeded the early June high (red resistance line). This breakout reverses the downtrend from the falling wedge. Just as important, it signals a continuation of the prior advance and targets a move to new highs. It is important that the breakout surge holds. Therefore, I am marking re-evaluation support at 103. A close below this level would erase the gains that led to the breakout.