Video and Report Headlines
- VIX Moves out of Comfort Zone
- Correlations Rise During Steep Declines
- SPY and the 5% Canary
- Yield Spreads Significantly Widen
- TLT Surges as Fed Changes Course
The next Chart Trader will be posted on Tuesday morning, August 13th.
VIX Moves out of Comfort Zone
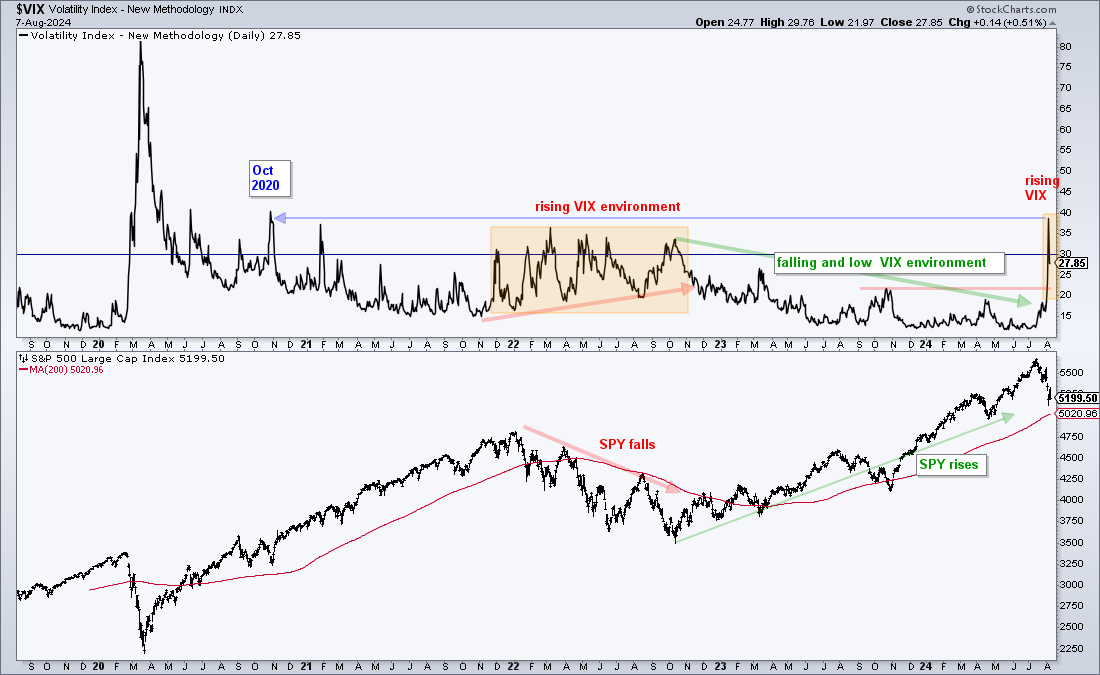
Increasing uncertainty is causing the markets to reprice. SPY, QQQ and IWM hit new highs in July and were priced for the best of all worlds. We then got a shakeup in the presidential race, a weak jobs report and a route in the Nikkei. Markets do not like uncertainty and stocks shutter at the thought of economic slowing. It is still early to call for a bear market, but we could be in for some rough trading the next one to two months. As noted yesterday, the VIX moved out of its comfort zone. We are also seeing yields spreads surge, which signals stress in both the stock and bond markets. TLT is starting to outperform RSP and the S&P 500 fell more than 5% in 14 days. The stock market environment is deteriorating and we could be close to a signal similar to January 2022. Details below…
Correlations Rise During Steep Declines
Stocks fell sharply in August with the Russell 2000 ETF (IWM) and Nasdaq 100 ETF (QQQ) leading the way lower. SPY is down 5.84% this month, IWM fell 9.83% and QQQ declined 7.71%. QQQ and IWM represent the high-beta end of the market and typically move more than SPY. Eight of the eleven sectors were lower, even the Healthcare SPDR (XLV) fell 2.39%. The Consumer Staples SPDR (XLP), Utilities SPDR (XLU) and Real Estate SPDR (XLRE) are up less than 1% this month. Even though these three are up, they are not up much and feeling the pressure. Correlations typically rise during sharp declines and bear market. This makes it hard to find hiding places within the stock market.
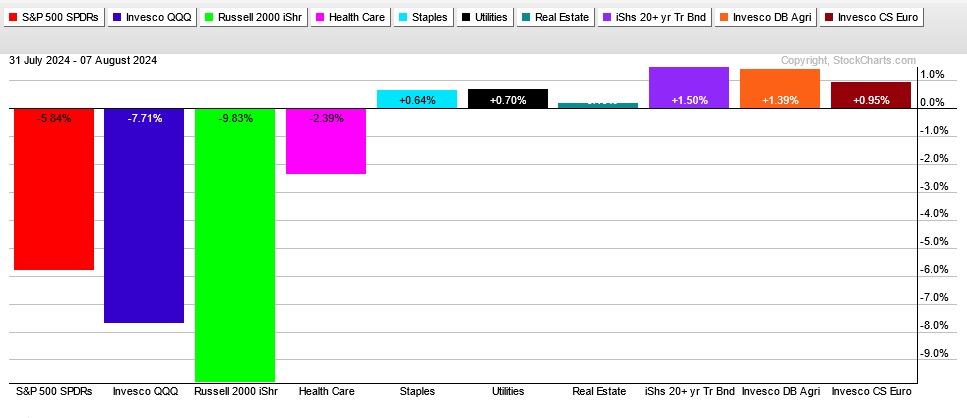
On the right side of PerfChart above, we see the 20+ Yr Treasury Bond ETF (TLT) with a 1.5% gain, the DB Agriculture ETF (DBA) with a 1.4% advance and the Euro ETF (FXE) with a 1% rise. I like TLT right now, but do not have a view on DBA, FXE, the Dollar or gold. Industrial metals are out of favor as long as stocks remain weak and economic slowing remains on the table. The chart below shows the Gold SPDR (GLD) with a sharp move higher from February to April, a pennant consolidation into June and a breakout attempt in July. Key support is set at 210.
SPY and the 5% Canary
SPY hit a new high on July 16th and then fell 8.41% in 14 trading days. This is the sharpest three week decline since September 2022. Before looking at this decline, note that the bounce over the last two days was quite weak. Thus, SPY fell and it cannot get back up. This suggests that we may see further weakness. As noted on Tuesday, the first target zone is the 485-500 area. The April low, rising 200-day SMA and 50% retracement mark this zone (see Tuesday’s report). My biggest concern is that further weakness to the 500 area could turn the breadth models bearish. We will cross that bridge when and if it gets here.
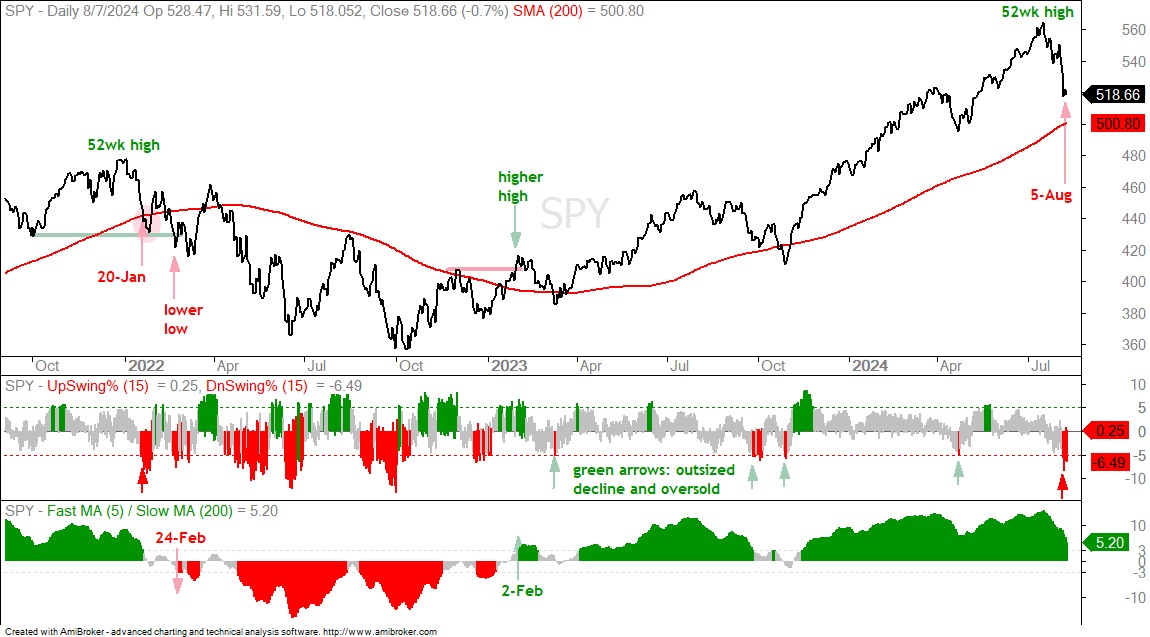
The bottom window shows the 15 day swing indicator, which measures the maximum up/down price swings within 15 days (closing prices). SPY fell 8.41% within 15 days (red bars) and this represents an outsized decline. The green arrows show prior outsized declines that marked oversold conditions and tradable lows in mid March 2023, late October 2023 and mid April 2024 (three of the four). The red arrows in January 2022 and August 2024 marked outsized declines that started from a 52-week high.
This 5% decline from a 52-week high concept comes from Andrew Thrasher and his paper, The 5% Canary. The 5% decline is the shot across the bow. He then looks for confirmation. As Thrasher puts it: “when the underlying index declines by 5% within 15 days from a 52-week high, (producing the 5% Canary signal), and closes under the 200-day SMA for two consecutive days.”. Thus, a bearish signal would trigger should the S&P 500 close below its 200-day SMA for two days in a row within the next two months.
Turning back to the chart, we can see a 5% canary decline on January 20th, 2022. SPY then closed below its 200-day the next six days in a row for a bearish signal. SPY then formed a lower low and the 5/200 %Differential exceeded -3% on February 24th for further confirmation. Most recenty, SPY fell over 5% within a 15 days period on August 5. The 200-day SMA is at 500.80 and two closes below this moving average would confirm the 5% canary.
Yield Spreads Significantly Widen
The yield spread is the difference between the corporate bond yield and the comparable US Treasury bond yield. Corporate bonds carry more risk, while US Treasuries are much safer bets. Spreads between these two widen when risk aversion grows in the credit markets. A widening means traders are demanding more premium to hold the riskier assets, corporate bonds.
Calculations at the Fed are more complex, but here is a basic example to show how the spread works. The 10-yr Treasury currently yields 4% and CCC bonds yield 14.25%. The difference, 10.25%, is the premium for holding the riskier asset. AAA bonds are the highest rated investment grade bonds, BBB bonds are the lowest rated investment grade bonds (lower quality). CCC bonds are the lowest rated junk bonds (most risk of default).
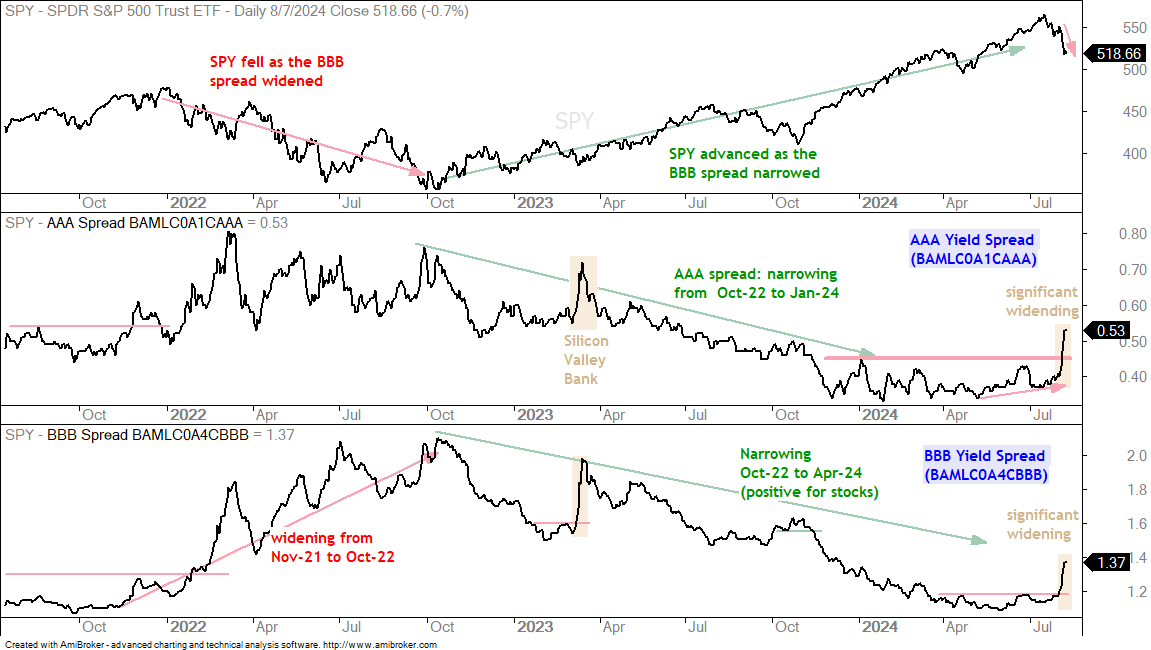
Fear arrived in the credit markets as the yield spreads widened (surged) over the past week. This is the sharpest widening since the Silicon Valley Bank scare in March 2023. Yields spreads peaked soon after this scare and resumed their downward trajectory in April 2023. For now, the chart below shows the AAA spread widening above .50 and hitting its highest level since June 2023. The bottom window shows the BBB spread widening to 1.37 and hitting its highest level since 2023. Both spreads are at their highs for the year (2024) and showing a serious increase in risk aversion, which is negative for stocks.
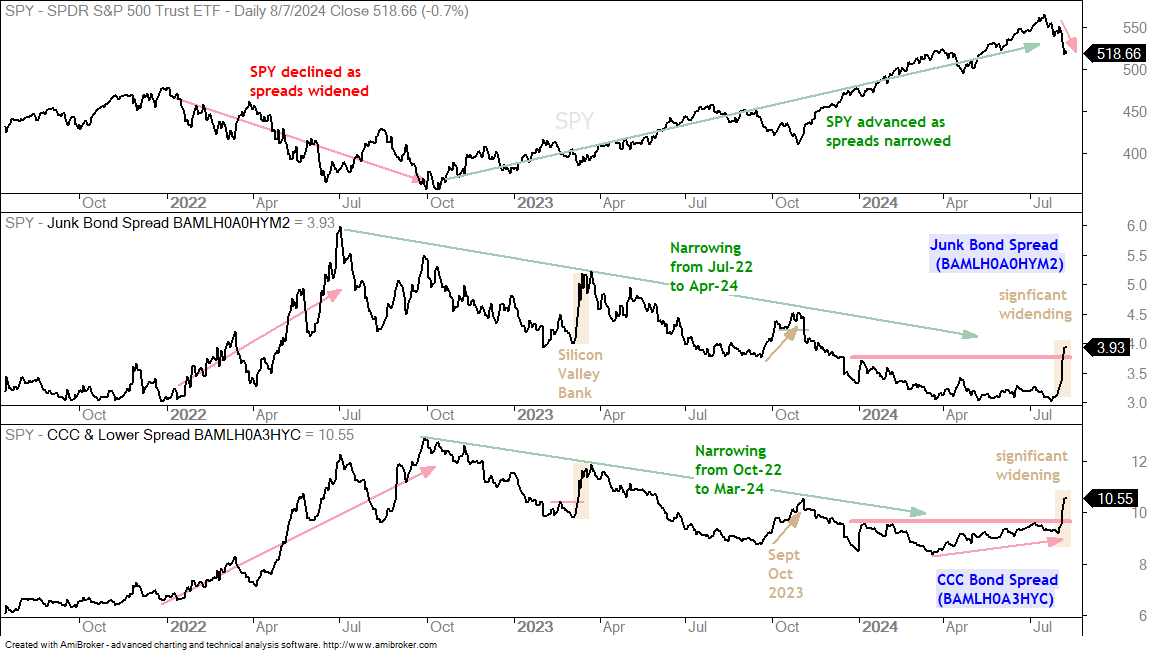
The next chart shows the Junk bond spread and the CCC bond spread widening to their highest levels of the year. Again, this shows stress and risk aversion in the credit markets, and this is negative for stocks.
TLT Surges as Fed Changes Course
In its policy statement on July 31st, the Fed set the stage for rate cuts. This means the Fed is shifting from a tightening cycle to an easing cycle. We can debate the timing all we want, but this marks a shift in Fed policy. Yes, I am aware of the old adage: don’t fight the Fed. This is true, but there is sometimes a disconnect (lag) before stocks and the Fed get on the same page. The next Fed meeting is September 17-18.
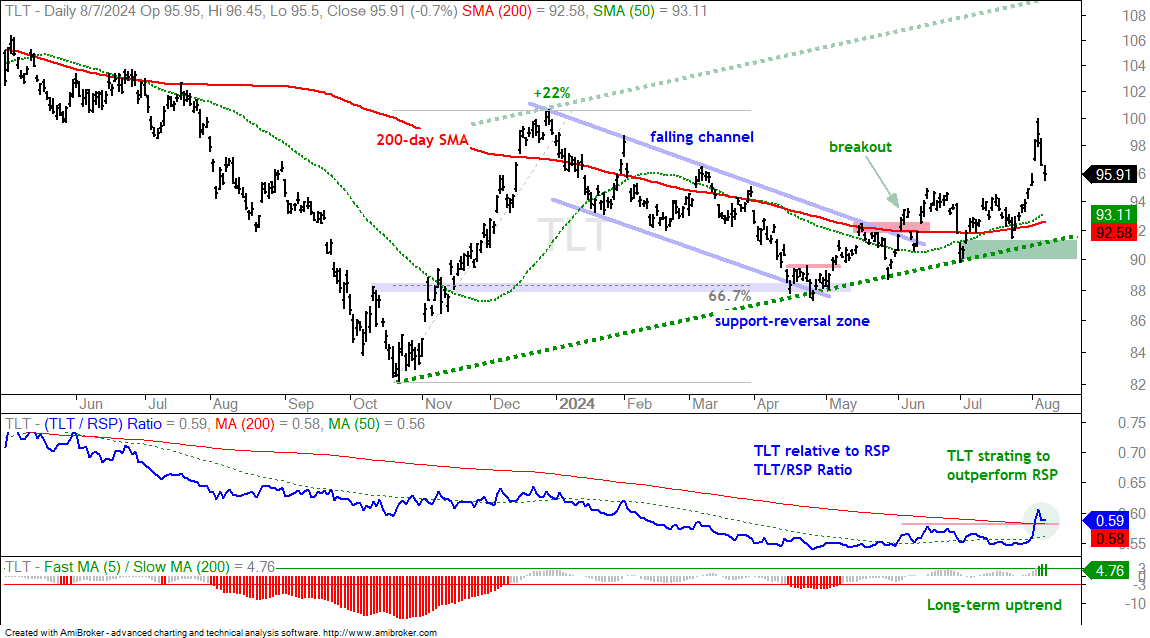
The next chart shows the 20+ Yr Treasury Bond ETF (TLT) breaking out in early June, working its way higher into mid July and then surging the last two weeks. As noted last Thursday, the falling channel from January to May was a correction after the 22% advance. The channel breakout reversed the decline and signaled a continuation of this advance. I am targeting a move to the 107-108 area. The July lows mark the first support zone in the 90-92 area. TLT is starting to outperform the S&P 500 EW ETF (RSP) as the TLT/RSP ratio broke its 200-day SMA for the first time in over a year. The bottom window shows the 5/200 %Differential exceeding 3% to signal a long-term uptrend.