The next Chart Trader will be posted on Thursday morning, June 27th.
Monday was a rather interesting day in the stock market. QQQ fell 1.30% and weighed on SPY, which fell .33%. Small-caps and mid-caps picked up the slack as the S&P SmallCap 600 SPDR and S&P MidCap 400 SPDR gained a little over half a percent. Eight of the eleven sector SPRDs finished higher. The three losers were Technology, Consumer Discretionary and REITs. Most tech-related ETFs were down with semis falling the most (SOXX -2.85%). This makes sense because the Semiconductor ETF is the leading gainer year-to-date and the most extended. Recent weakness over the last three days could signal the start of a corrective period for the overcrowded AI trade. Today’s commentary will analyze four key AI players. Overall, the bull market remains in place with plenty of stocks above their 200-day SMAs and 26-wk High-Low Percent remaining strong. The short-term uptrend is also intact because the 4wk HiLo% combo has yet to trigger bearish.
Vacation and Educational Reports/Videos
Note that I will be on a family vacation the first two weeks of July. I will not publish the ChartTrader reports from July 1st to July 14th. Instead, I will publish two educational reports and videos. Two more reports will be published in July-August.
2-July: Quantifying Market Conditions with NDX/SPX Breadth
9-July: Absolute Trends, Relative Trends and Trend Consistence
For SystemTrader, I will update the weekend signals for the Nasdaq 100 and S&P 500 Dual Momentum Rotation Strategies during the vacation (Saturdays). I will also update the signals for the ETF Trend-Momentum Profit Target Strategy.
SPX Stocks Stronger than NDX Stocks
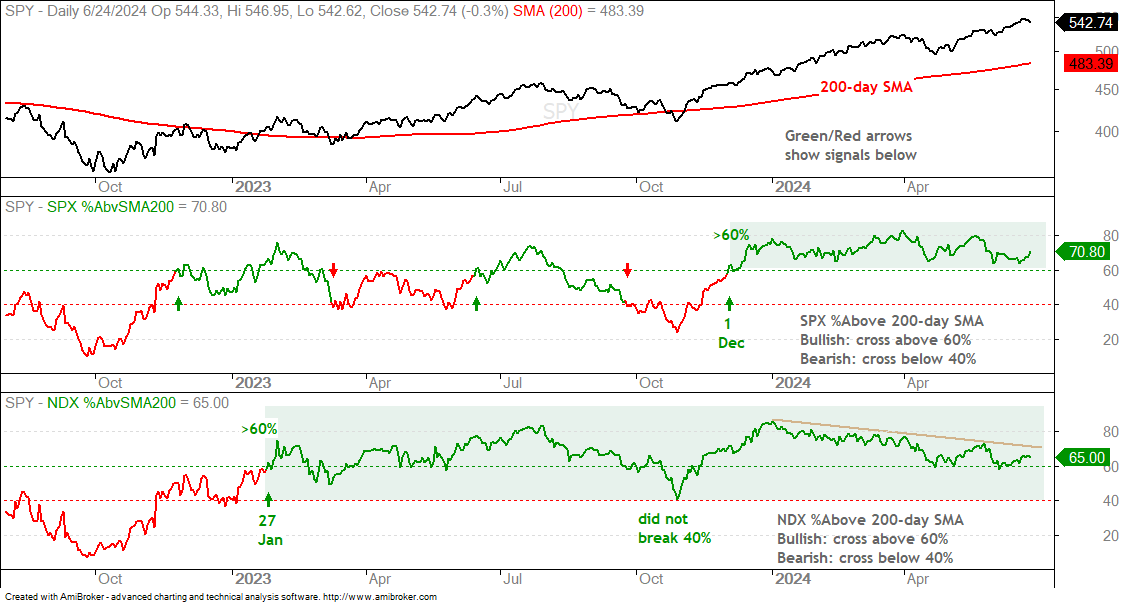
The %Above 200-day SMA indicators remain bullish. These trigger bullish with a move above 60% and remain bullish until a move below 40%. The green shading shows the current bullish signals for both SPX and NDX. Currently, some 70% of S&P 500 stocks are above their 200-day SMAs. This is more than enough to support a bull market. 65% of Nasdaq 100 stocks are above their 200-day SMAs, which is also strong. Upside participation is contracting within the Nasdaq 100 because more stocks were above their 200-day SMAs in January (>80%), March (>75%) and May (>70%). I would not read too much into this divergence because divergences can last a long time and the absolute levels remain strong.
26wk HiLo% Contracts
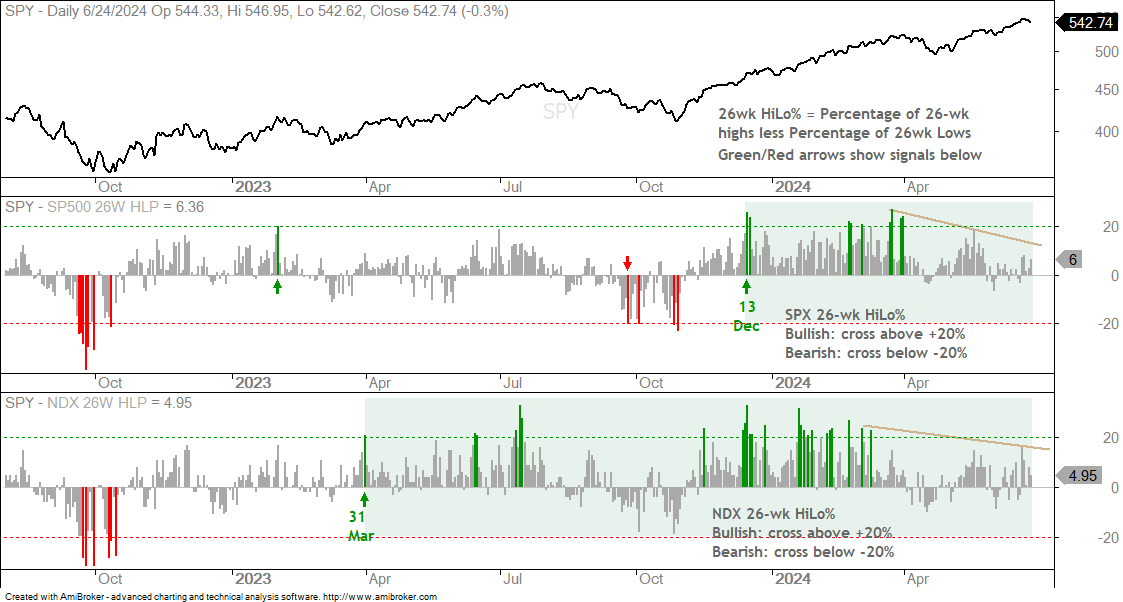
The next chart shows 26wk HiLo% for the S&P 500 and Nasdaq 100. This is the percentage of 26-week highs less the percentage of 26-week lows. This indicator turns bullish with a move above 20% and bearish with a move below -20%. The green shading marks the current bullish signals. This indicator was regularly above 20% from mid December to late March. Since May, the indicator has not been above 20% for either index. Meanwhile, both the S&P 500 and Nasdaq 100 moved to new highs. Thus, upside participation is contracting as the rally narrows. Again, I would not read too much into this divergence because we have yet to see double digit negative numbers. The trouble starts when 26wk HiLo% starts dipping below -10% and we see a serious expansion of 26-wk lows.
4wk High-Low Percent Combo Remains Bullish
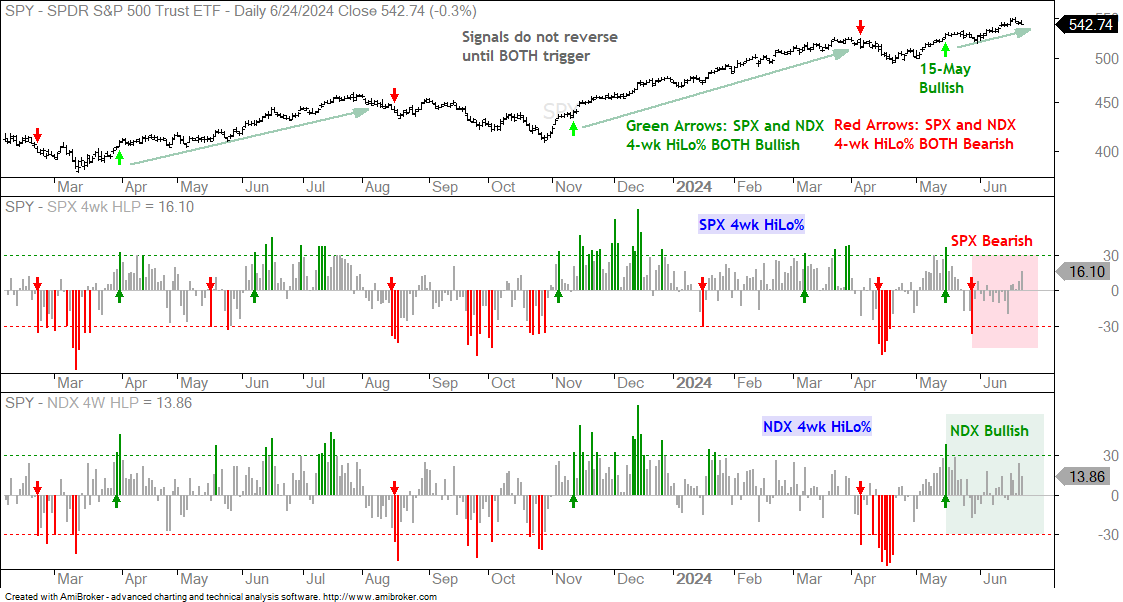
The next chart shows 4wk HiLo% for the S&P 500 and Nasdaq 100. This indicator turns bullish with a move above 30% and bearish with a move below -30%. Note that both must be bullish for a bullish combo signal and both must be bearish for a bearish combo signal. Currently, the S&P 500 is bearish and the Nasdaq 100 is bullish. Technically, the bullish combo signal from May 15th has yet to be reversed. Even though the AI trade took a big hit on Monday, the 4wk HiLo% indicators finished above +13% as there were more 4wk Highs than 4wk Lows.
SPY, QQQ and MAGS Back off of New Highs
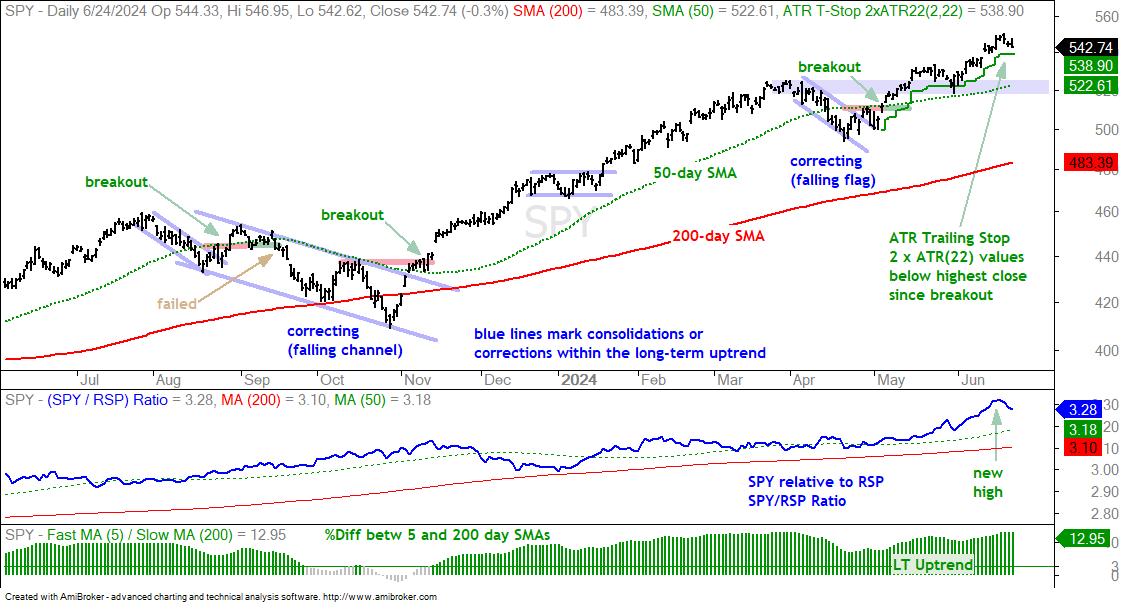
SPY remains in a long-term uptrend. The ETF is above its rising 200-day SMA and the 5/200 %Differential is near 13%. SPY is perhaps extended and ripe for a rest, but a trading range or pullback would be considered a correction within the bigger uptrend. Short-term, SPY corrected into April, broke out on May 3rd and extended on this breakout. SPY hit another new high last week and then fell around 1% over the last three days. This 1% decline is not enough to derail the short-term uptrend or even trigger the ATR Trailing Stop. For reference, the ATR Trailing Stop is at 538.90. It is difficult to predict or time a pullback within a bigger uptrend and a bull market. Should we get a pullback, I would mark first support near the rising 50-day SMA and broken resistance (blue shading).
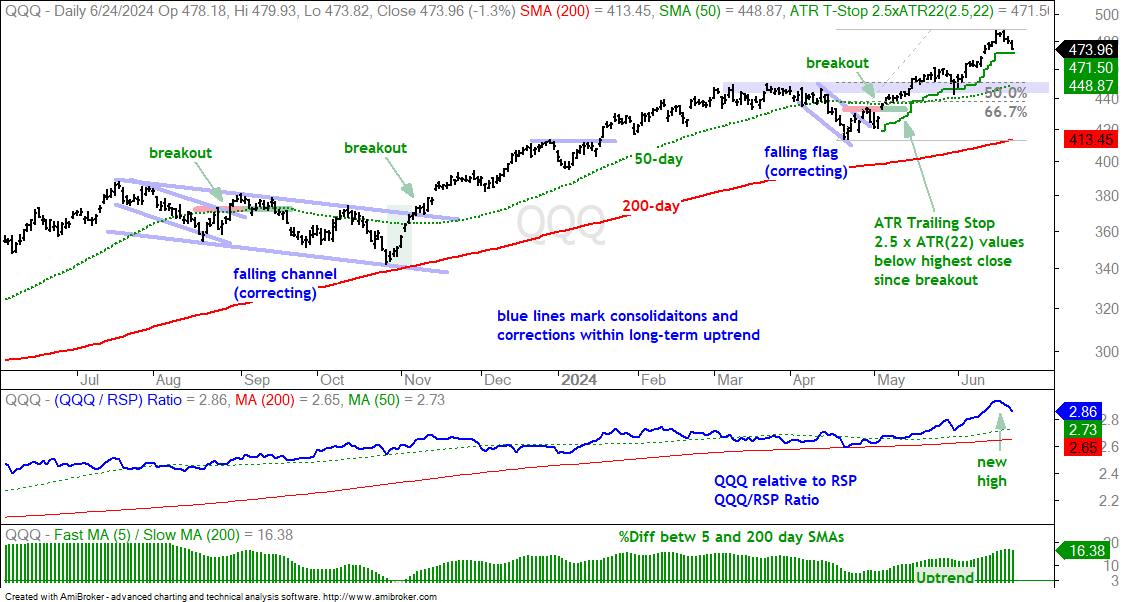
QQQ fell 2.3% over the last three days and remains just above the ATR Trailing Stop, which is at 473.96 (solid green line). This trailing stop started with the early May breakout and trailed higher as QQQ extended on its breakout. This is the job of the trailing stop. As with SPY, there is no trading setup on this chart. Price is in the middle of a post-breakout extension. It is time to wait for the next tradable setup to materialize. The blue shading marks first support in the 440-450 area. This support zone stems from broken resistance, the late May low and 50-67% retracement zone.
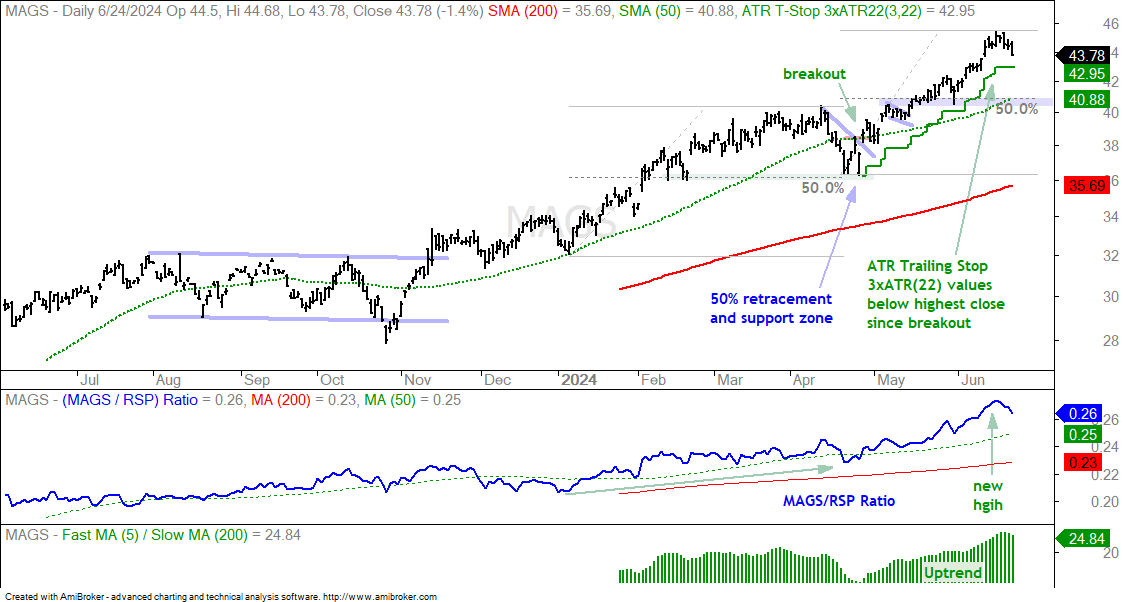
The Mag7 ETF (MAGS) fell 2.6% over the last three days and led the market lower. Prior to this, the ETF led the market higher from late April until mid June. MAGS was up some 24% from mid April to mid June and the ETF is entitled to a rest or corrective period. Corrections can be time based with sideways price action or price based with a decline that retraces a portion of the 24% advance. As far as next support, broken resistance and the late May low mark support in the 40-41 area (blue shading). This area also marks a 50% retracement of the prior advance.
The following charts show price bars with the 200-day SMA (red line), the 50-day SMA (green line), the price-relative (ITB/RSP ratio) with the 200-day SMA and the percentage difference between the 5 and 200 day SMAs. On the price chart, I am looking for tradable pullbacks within a bigger uptrend or bullish consolidation patterns. With the price-relative, I am looking for relative strength. The price-relative (ITB/RSP ratio) rises when the ETF or stock outperforms. And finally, the percentage difference between the 5 and 200 day SMA is bullish (long-term uptrend) with a move above 3% and stays bullish until a move below -3%. This basically measures the tide or long-term bias.
Recent Reports Worth Revisiting
20+ Yr Treasury Bond ETF (TLT) holds breakout (June 18th).
Home Construction ETF (ITB) and housting stocks setting up (June 18th).
S&P SmallCap 600 SPDR forms cup-with-handle (June 4th)
What Goes Up, Must Come…
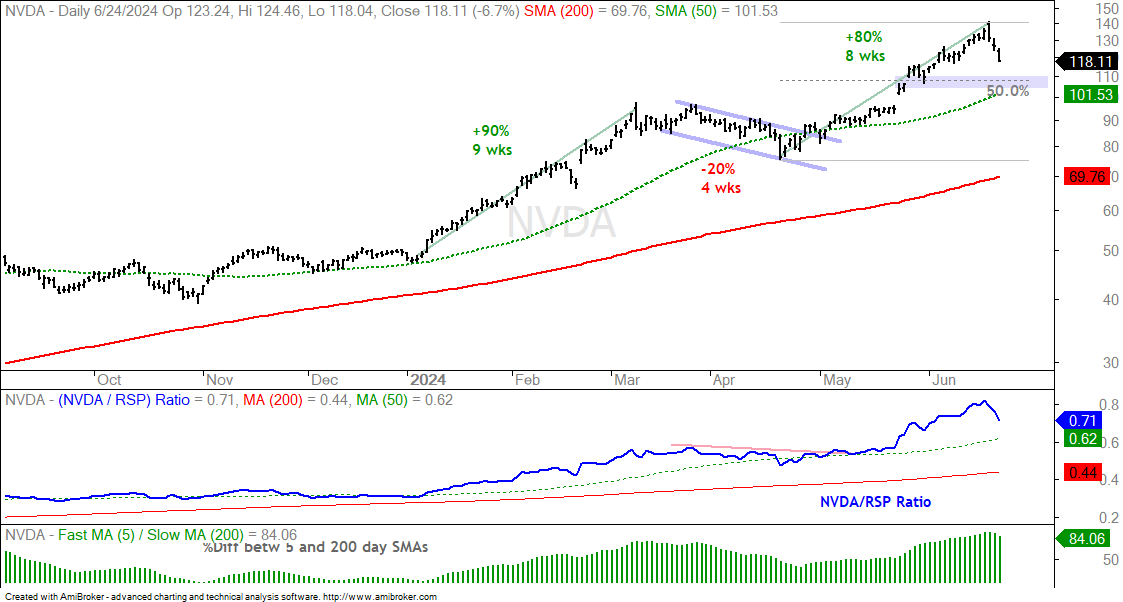
Led by Nvidia, the AI trade went nuts in the first half of 2024 with several names gaining big. These include NVDA (+138%), DELL (+80%), AVGO (+42%) and SMCI (+190%). These steep advances reflect an increase in volatility and volatility is a two way street. The bigger and sharper the rise is, usually, the steeper and more dramatic the correction. The chart below shows Nvidia with a 90% advance in nine weeks and then a 20% decline in four weeks into April. This correction broke the 50-day SMA, but this break was the alert for a bullish setup. NVDA broke out in late April and advanced 80% from mid April to mid June (eight weeks). The stock then fell 13% the last three days and this outsized decline could signal the start of a corrective period. I am marking my first support zone in the 105-110 area (blue shading). This zone stems from broken resistance, the late May low, the 50% retracement and the 50-day SMA. A break below the 50-day would not be long-term bearish. Instead, it would again serve as an alert for a tradable pullback.
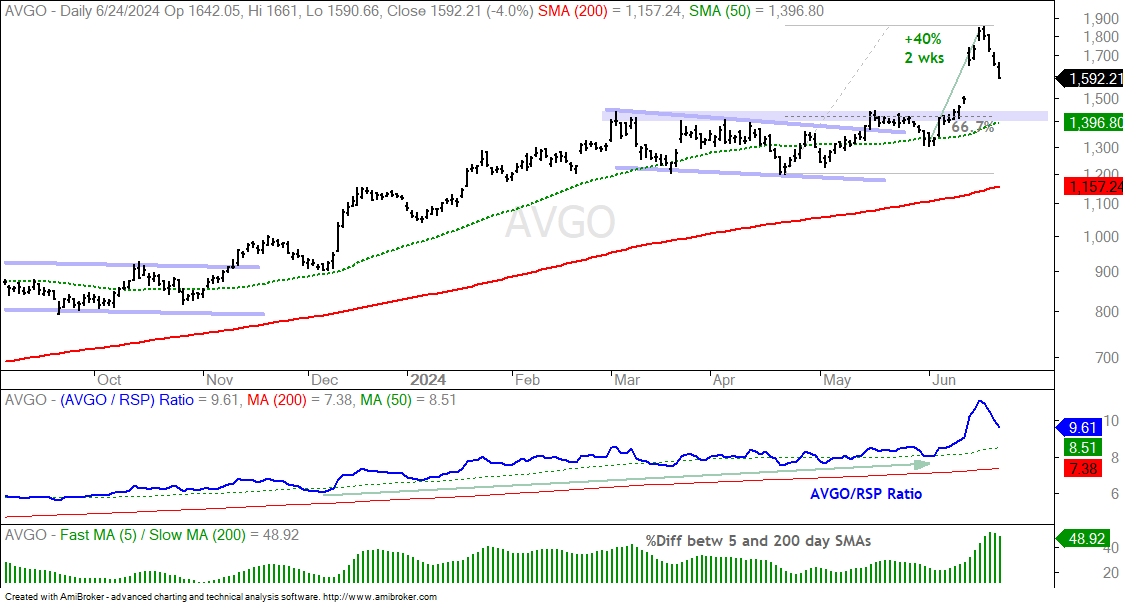
The next chart shows Broadcom (AVGO) with a falling channel correction into May, a breakout in mid May and a 40% surge in two weeks. A double digit gap up punctuates this surge. The long-term trend is clearly up, but things got a bit frothy after this 40% advance. AVGO answered with a 13% decline the last four days. Again, the long-term trend is up and volatility is high. I am marking first support in the 1400 area. This stems from broken resistance, the 50-day SMA and the 67% retracement line.
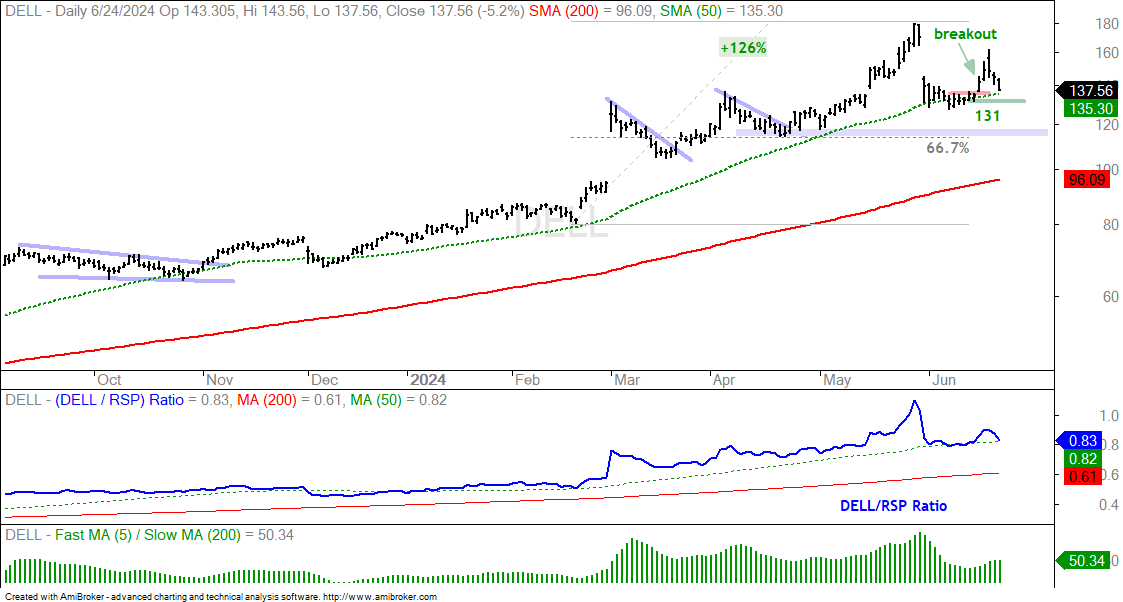
I featured DELL and SMCI last week as they broke short-term resistance. Both fell along with NVDA over the last three days and could further correct if the AI trade unwinds. Again, the long-term trends are up and weakness is viewed as a correction within these long-term uptrends. The first chart shows DELL with a breakout last week, a surge to 160 and a sharp pullback to 138. The breakout is still holding and the breakout zone turns first support. A close below 131 would negate this breakout and call for a deeper correction. The next target is in the 115 area. This zone stems from the April support level and the 67% retracement line.
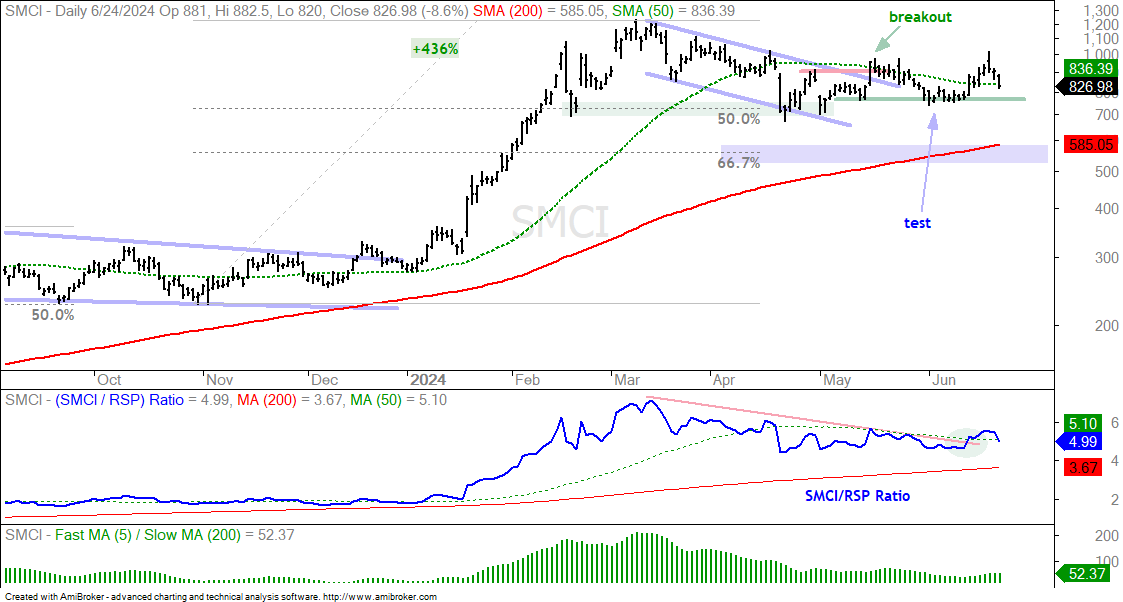
The next chart shows Super Micro Computer (SMCI) with a breakout in mid May, a throwback into early June and a bounce last week. This bounce did not last long as the stock fell 10% the last three days. Volatility is the name of the game here. SMCI is already below its 50-day SMA and showing some relative weakness. It looks like this breakout is failing with 762 marking the last support line. A break here would argue for a deeper correction towards the rising 200-day and 67% retracement line.
Bitcoin and Coinbase Fail to Hold Breakouts
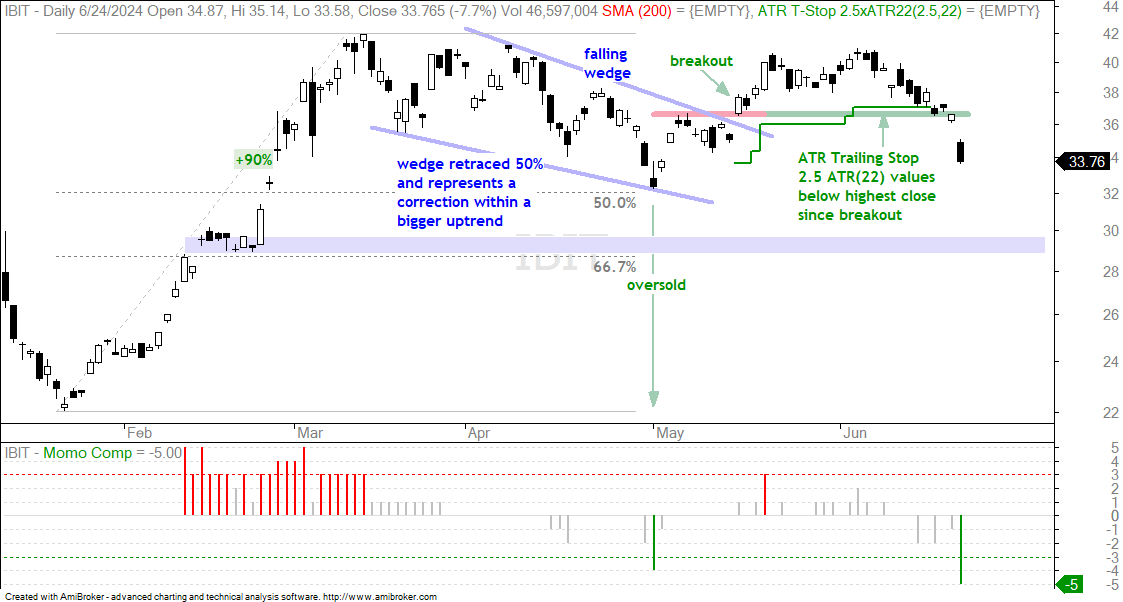
The Bitcoin ETF (IBIT) and Coinbase (COIN) broke out in mid May, but failed to hold these breakouts. They have now formed lower highs from March to June and it looks like the corrections will extend further. The first chart shows IBIT triggering the ATR Trailing Stop last week and then closing below 36.5 this week (green line). The falling wedge breakout failed to hold and the next downside target is in the 29-30 area. This zone stems from the mid February support level and the 67% retracement. IBIT is short-term oversold after a 16% decline since early June and could get an oversold bounce. Even so, I think the failed breakout looms large and argues for a deeper correction.
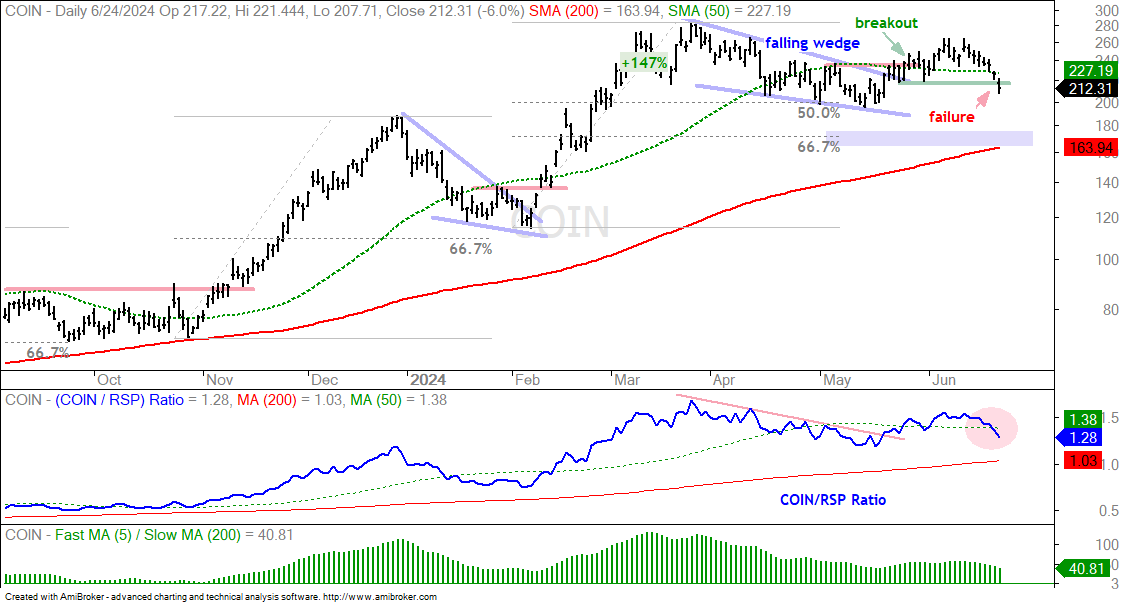
The next chart shows COIN failing to hold its wedge breakout with a close below the support line (green). COIN now has a lower high from March to June and the failed breakout argues for a deeper correction. The 67% retracement and 200-day SMA mark the next support zone around 170.
Biotechs Lead Healthcare Higher
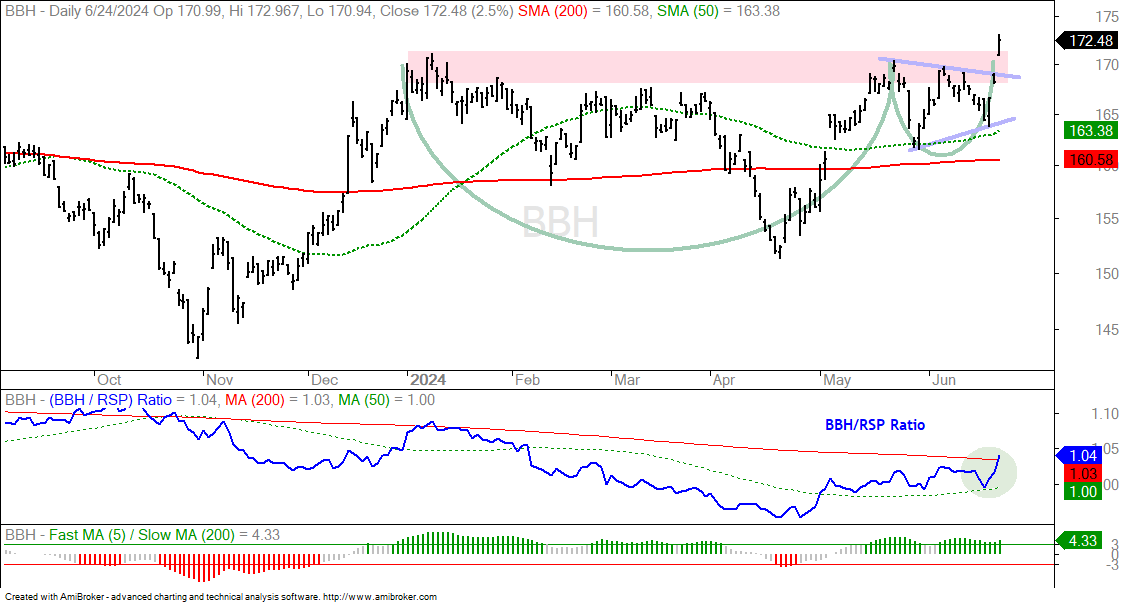
Biotechs got a boost from two stocks over the last few days. Alnylam (ALNY) surged 34.5% after better than expected research results from its new heart disease treatment, which is still in clinical trials. Gilead (GILD) surged 12% after an experimental HIV drug proved 100% effective in trials. The Biotech ETF (BBH) broke rim resistance of a cup-with-handle pattern.
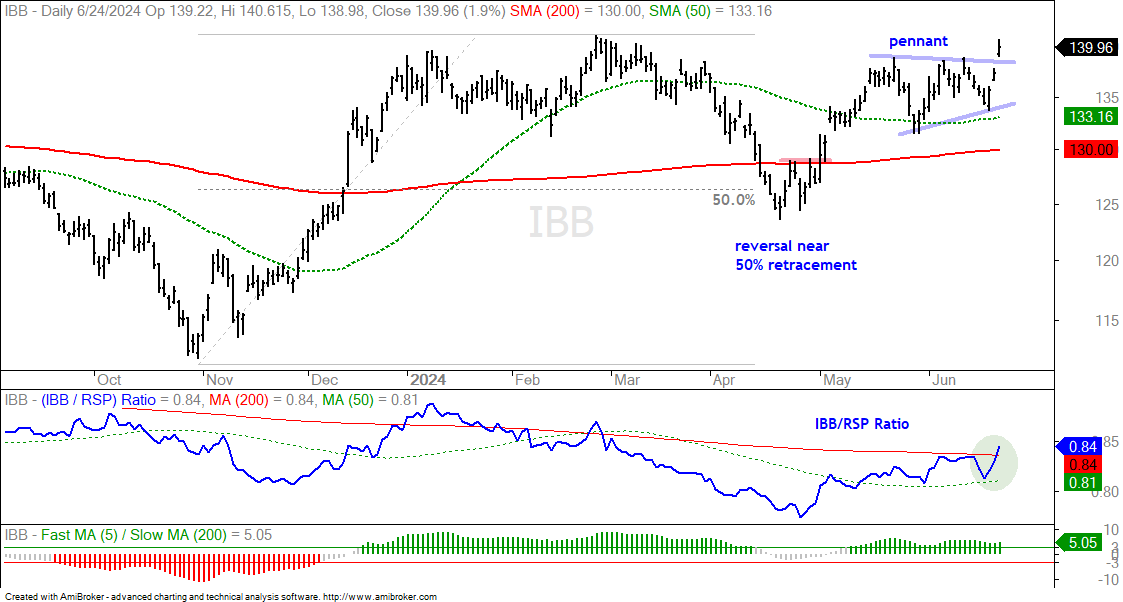
The next chart shows the Biotech ETF (IBB) breaking out of a pennant and the RSP/IBB ratio breaking above its 200-day SMA.
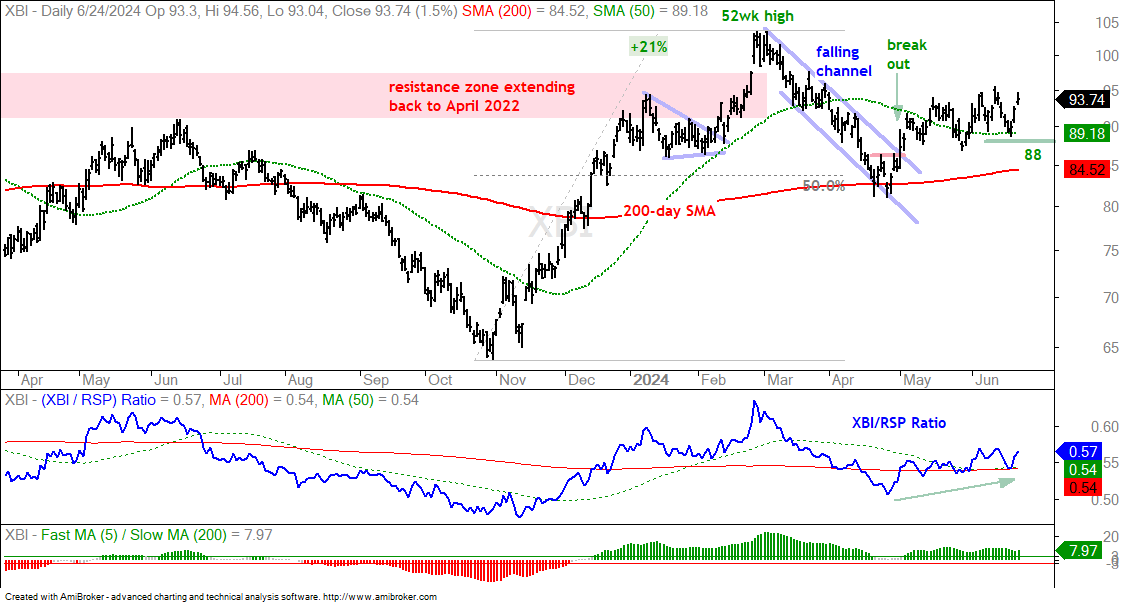
The next chart shows the Biotech SPDR (XBI) bouncing off the 50-day SMA the last three days. The equal-weight XBI is lagging the other two, which are weighted by market cap. Even so, XBI is largely holding its early May breakout and working its way higher. I am raising my re-evaluation support level to 88.
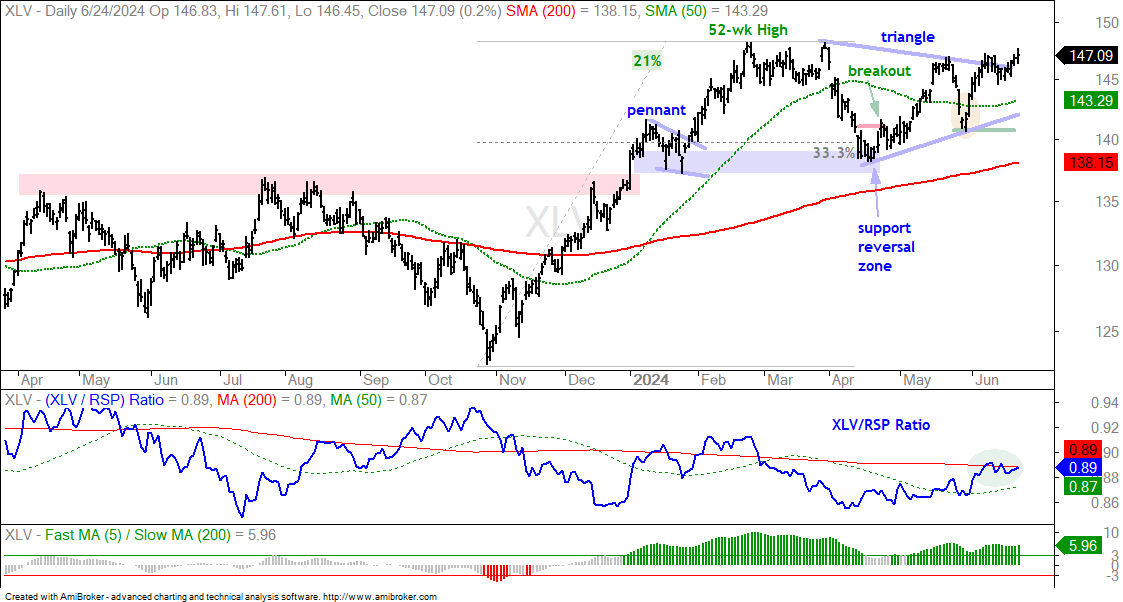
The next chart shows the Healthcare SPDR (XLV) breaking the upper line of a triangle on June 10th, stalling and attempting to extend on this breakout with an advance the last five days. This triangle is viewed as a consolidation within an uptrend and the breakout targets a move to new highs.
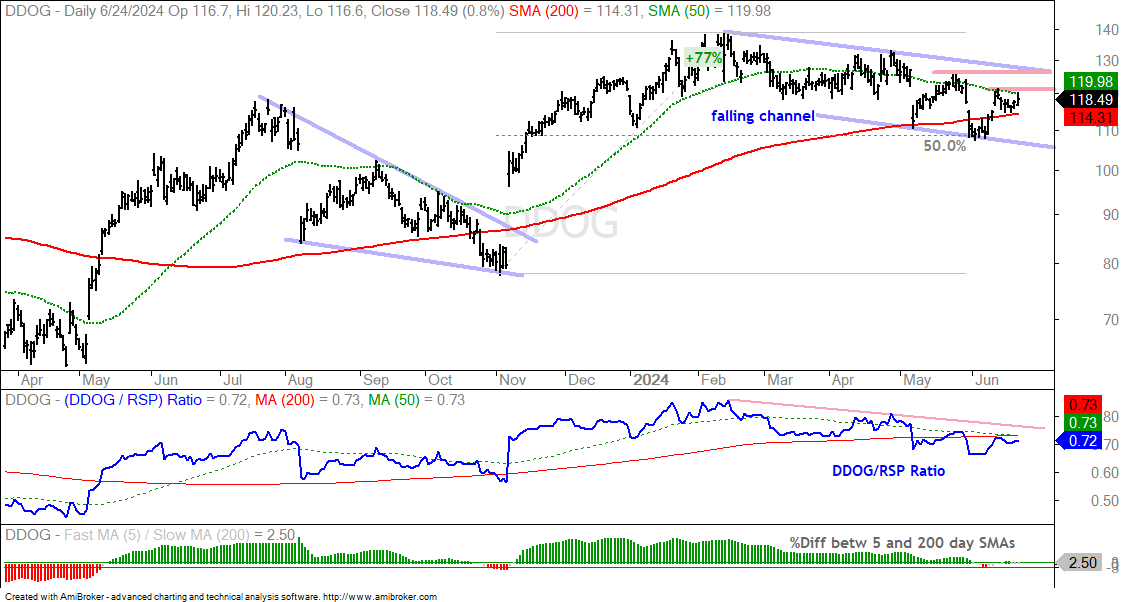
As its name suggests, DataDog (DDOG) is in the data monitoring business for cloud computing and data centers. The stock surged with the market from early November to mid February and then corrected over the last four months. This correction formed a falling channel and retraced around 50% of the prior advance. The decline also returned to the rising 200-day SMA. Overall, I view this as a correction within a bigger uptrend. Both the pattern and the retracement amount are normal for such corrections. DDOG bounced in mid June with a move back above the 200-day SMA. It stalled the last six days and established short-term resistance at 121. A breakout here would be the first sign of strength. I am marking channel resistance at 126 and a breakout here would signal a continuation of the bigger uptrend.
Lockheed Martin Challenges Resistance
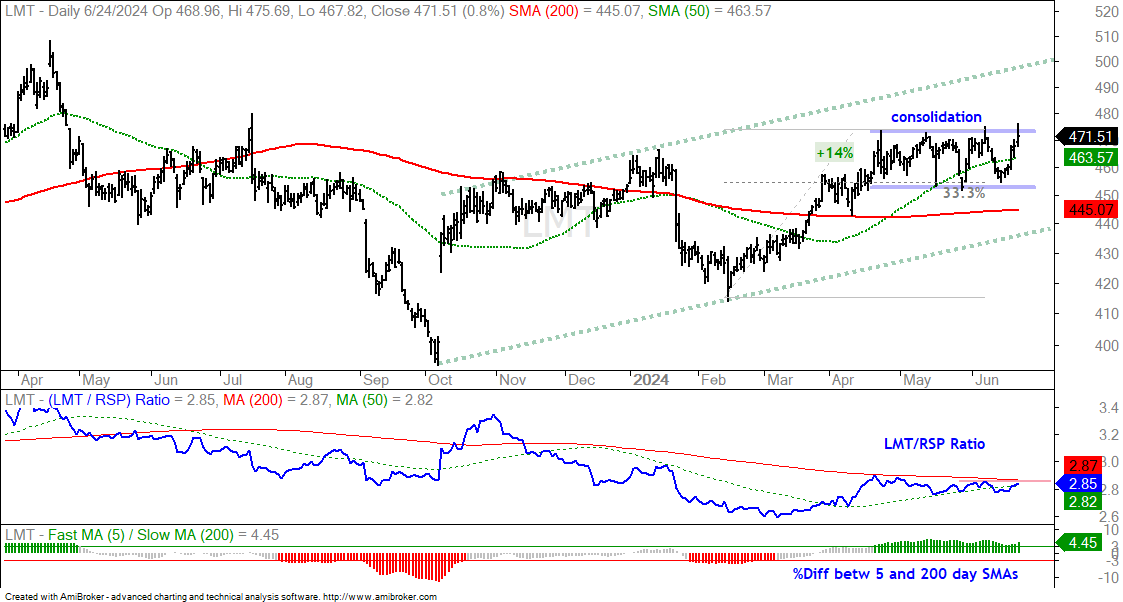
Lockheed Martin (LMT) has been a laggard within the leading Aerospace & Defense ETF (PPA). That may be about to change as the stock challenges consolidation resistance. The long-term trend is up with price above the rising 200-day SMA and the 5/200 %Differential bullish. LMT advanced 14% from mid February to mid April and then consolidated with a trading range. This looks like a rest within the uptrend and a breakout would signal a continuation higher.
Cigna Bids to End Correction
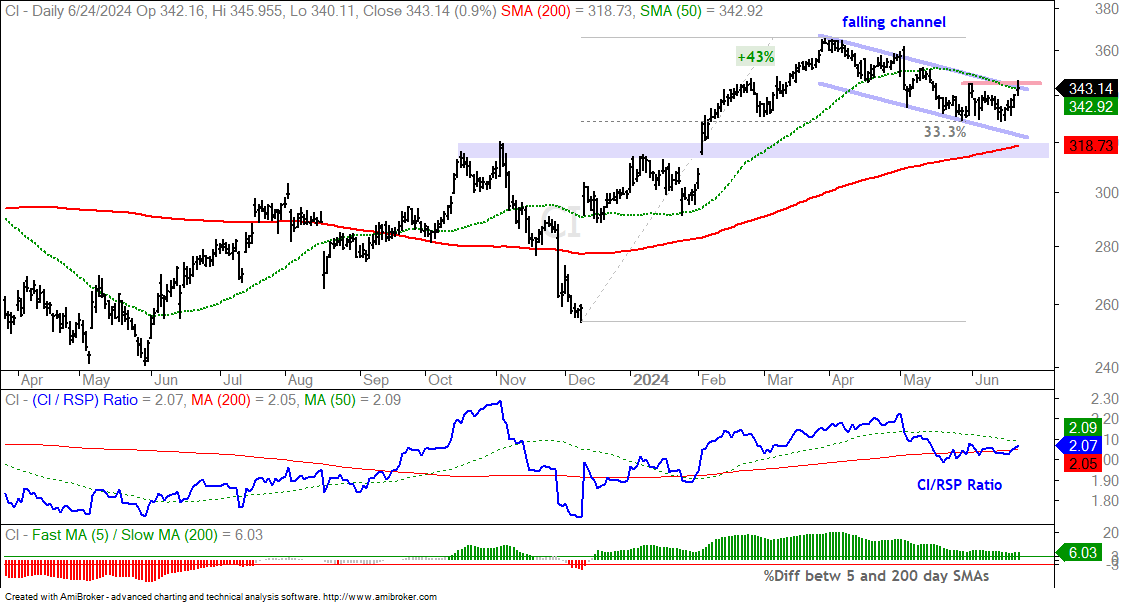
The next chart shows Cigna (CI) advancing some 43% from early December to late March and hitting new highs along the way. The stock fall over the last few months with a falling channel taking shape. This decline retraced around a third of the prior advance and looks like a correction within a bigger uptrend. CI firmed the last few weeks and turned up the last five days. The stock is challenging channel resistance and a close above 345 would trigger a breakout.
DiamondBack Energy Breaks Out of Channel
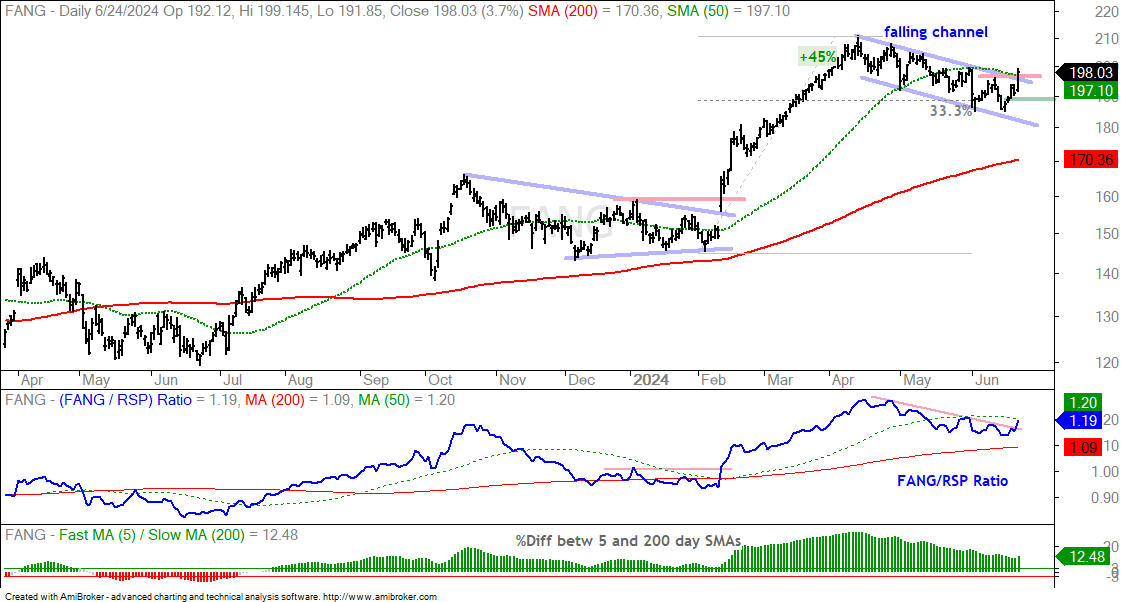
The next chart shows Diamondback Energy (FANG) with a setup similar to the chart above (CI). FANG surged 45%, hit a new high in April and then corrected into June. A falling channel retraced 33% of the prior advance and the stock firmed in the 185 area the last few weeks. FANG popped on Monday and broke channel resistance. I view this breakout as bullish because it signals an end to the correction and a resumption of the prior uptrend. A close below 189 would call for a re-evaluation (green line).