Lilly and Merck Consolidate within Uptrends (plus TMO)
The next Chart Trader will be posted on Thursday morning, May 16th.
SPY and QQQ remain at make or break levels and this week is key. Another push higher would likely show a short-term expansion in upside participation and add some legs to the current bounce. Failure to push higher at this stage could mark a short or intermediate top. There are two inflation-related reports to could tip the balance: PPI on Tuesday and CPI on Wednesday. Some of the key tech groups remain in corrective mode and are lagging during this oversold bounce. In particular, I am watching the Cybersecurity ETF (CIBR), Software ETF (IGV) and Cloud Computing ETF (SKYY). Breakouts in these three would be positive for the Technology sector and the market.
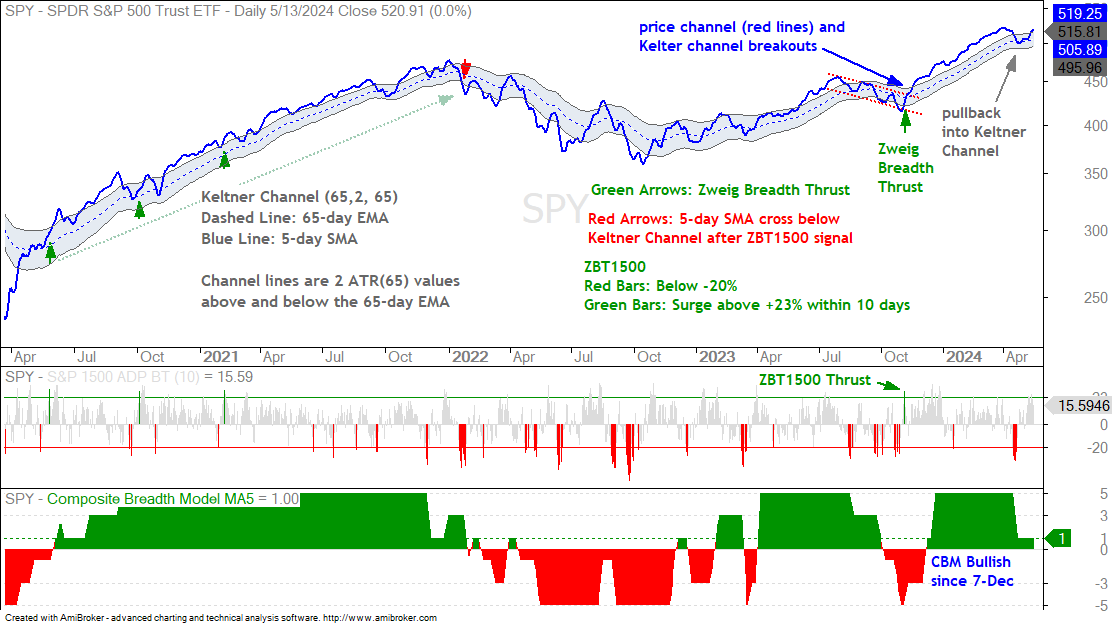
SPY Moves out of Keltner Channel
The chart below shows SPY as a 5-day SMA (blue line) and the Keltner Channel (65,2,65). I chose these settings because it ensures that SPY is trading in the channel after a Zweig Breadth Thrust (ZBT1500), which triggered in early November (green arrow). This ZBT1500 signal remains bullish until the 5-day SMA crosses the lower line of the Keltner Channel. Most recently, the 5-day SMA turned up over the last few weeks and moved above the upper line of the Keltner Channel.
The bottom window shows the 5-day SMA of the Composite Breadth Model at +1. It fell from +5 to +1 because the S&P 500 and S&P 1500 Thrust Models triggered bearish in mid April. This is testament to the strong selling pressure seen in a short time period. The S&P 500 and S&P 1500 Trend Models remain bullish and the SPX 5-day SMA is above the 200-day SMA. Thus, three of the five inputs are bullish and we remain in a bull market.
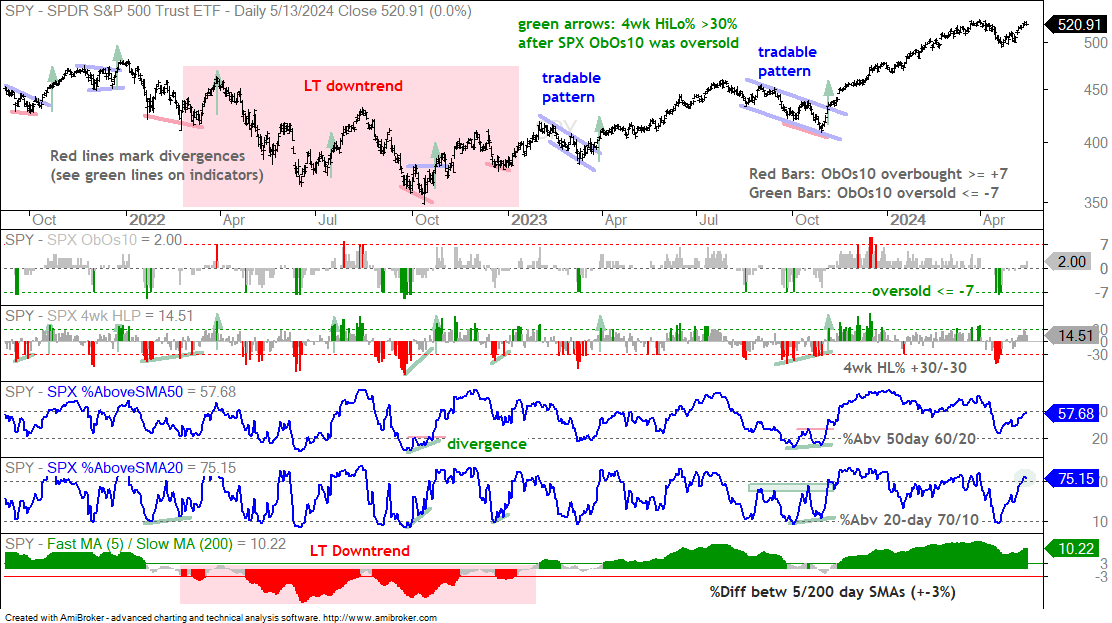
The next chart shows SPY with four short-term oscillators and a long-term trend indicator (see explanation below). SPX ObOs10 became oversold in mid April (green bars) and this oversold condition foreshadowed the current bounce. What turns an oversold bounce into a new leg higher? Expanding breadth. I am now looking for two of the three short-term breadth indicators to turn bullish. SPX %Above 20-day SMA turned bullish with a move above 70% (green circle). SPX %Above 50-day SMA has yet to clear 60% and SPX 4-wk High-Low Percent has yet to clear +30%. Thus, I am still waiting for one more indicator to confirm.
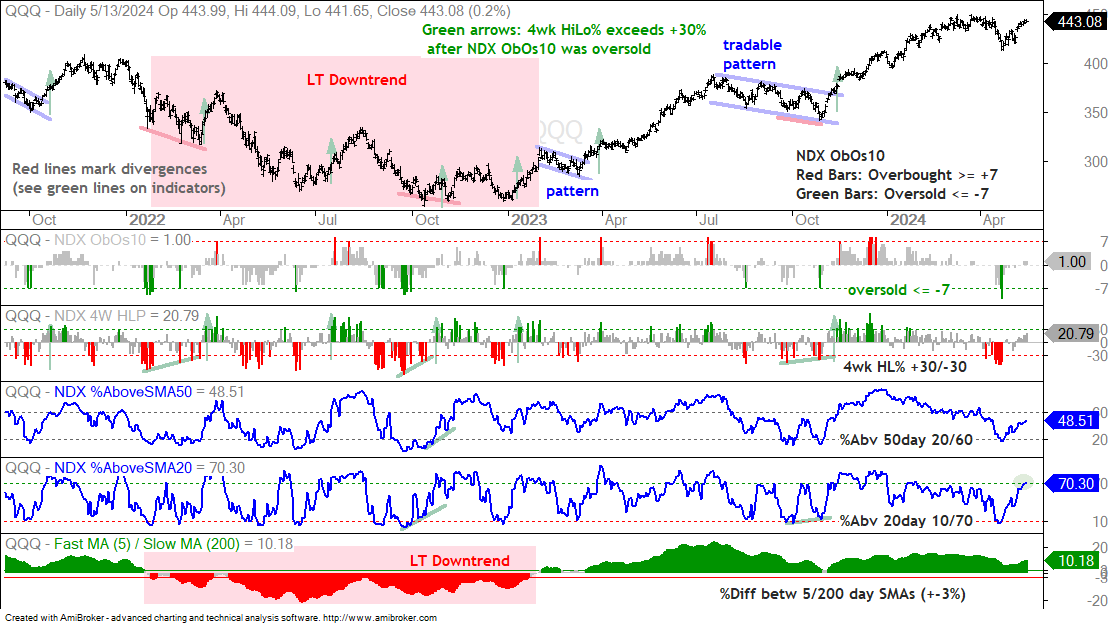
The next chart shows QQQ with the same indicators. NDX ObOs10 (first indicator) became oversold on April 18-19, and these oversold conditions foreshadowed the current bounce. As with SPX above, I am now looking for two of the three short-term breadth indicators to turn bullish. NDX %Above 20-day SMA turned bullish with a move above 70% (green circle). NDX %Above 50-day SMA has yet to clear 60% and NDX 4-wk High-Low Percent has yet to clear +30%. Thus, I am still waiting for one more indicator to confirm.
The charts above feature a long-term trend indicator in the bottom window and four short-term indicators to identify short-term bullish setups and signals. I am using the percentage difference between the 5 and 200 day SMAs for the long-term trend. A break above +3% is bullish and stays bullish until a break below -3%. The red shading marks the long-term downtrend in 2022. The first indicator window shows SPX/NDX ObOs10, which aggregates overbought and oversold signals in 10 indicators. It is oversold at -7 or lower and overbought when at +7 or higher. I am mostly interested in oversold readings when the long-term trend is up. Once ObOs10 becomes oversold, I then look for short-term signals to suggest an end to the correction. These include 4wk High-Low Percent exceeding +30%, %Above 50-day SMA exceeding 60%, %Above 20-day SMA exceeding 70% and a pattern breakout on the price chart.
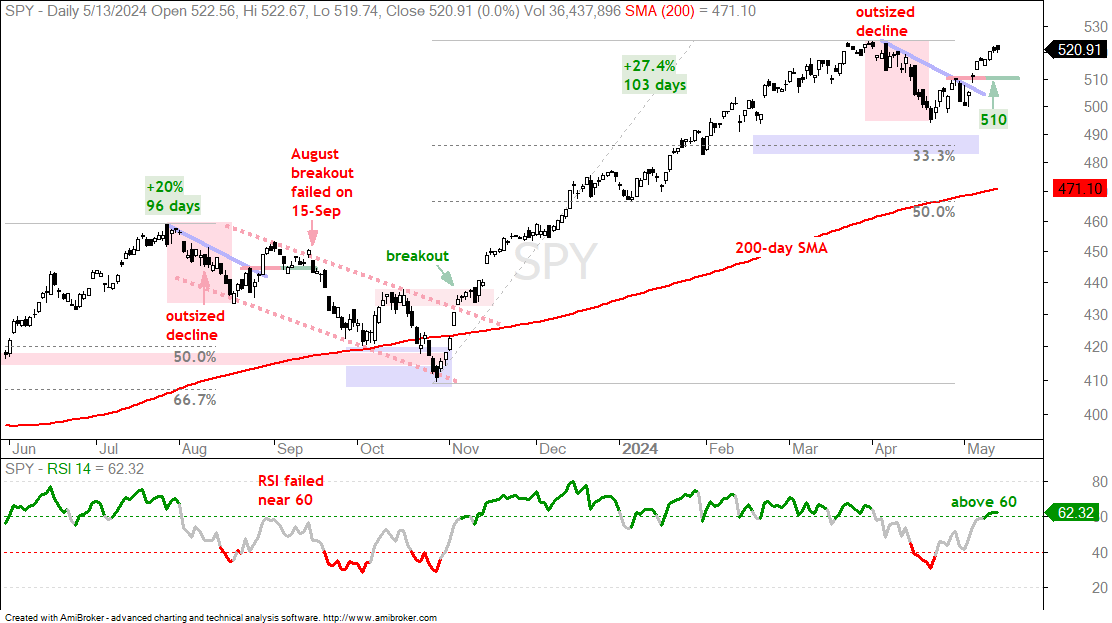
SPY and QQQ Hold Short-term Breakouts
We have three trends at work in the market now. First, the long-term trend is up (bull market). Second, the medium-term trend is down after the outsized declines in April (red shading). Third, the short-term trend is up with the breakout at 510.
SPY broke short-term resistance at 510 on May 3rd and worked its way higher the next six days. Technically, we have a short-term breakout and short-term trend reversal. The breakout level at 510 becomes support and a close below this level would call for a re-evaluation. Thus, the breakout is bullish until proven otherwise and I am using August 2023 as my guide here. SPY experienced an outsized decline then (red shading), broke short-term resistance with a 4.5% bounce (low to high) and then peaked in early September. Broken resistance turned support (red-green line) and the August breakout failed on September 15th.
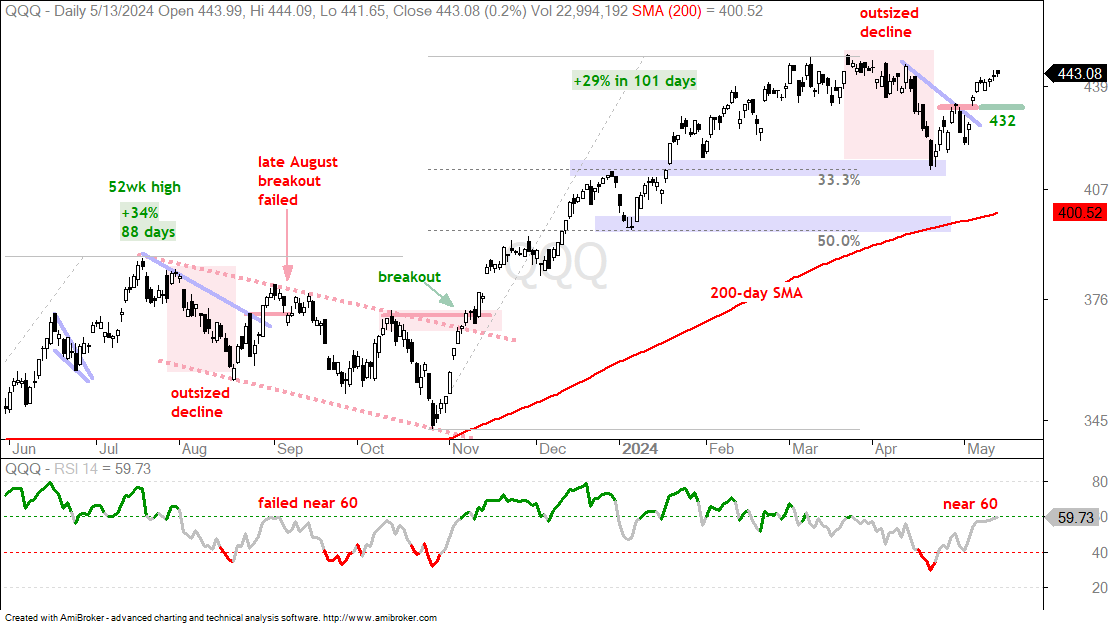
The next chart shows QQQ with a short-term breakout at 432 on May 3rd. QQQ extended higher the next six days and exceeded 440. The breakout level around 432 turns into first support. A strong breakout should hold so a break back below 432 would be negative. As with SPY, I am comparing the current breakout with the breakout in late August 2023. QQQ broke out with a surge on August 28th and failed to hold this breakout as it moved lower in September.
Chart Analysis, Setups and Trading Ideas
The following charts show price bars with the 200-day SMA (red line), the price-relative (ITB/RSP ratio) with the 200-day SMA and the percentage difference between the 5 and 200 day SMAs. On the price chart, I am looking for tradable pullbacks within a bigger uptrend or bullish consolidation patterns. With the price-relative, I am looking for relative strength. The price-relative (ITB/RSP ratio) rises when the ETF or stock outperforms. And finally, the percentage difference between the 5 and 200 day SMA is bullish (long-term uptrend) with a move above 3% and stays bullish until a move below -3%. This basically measures the tide or long-term bias.
XLK and the Comparison with August
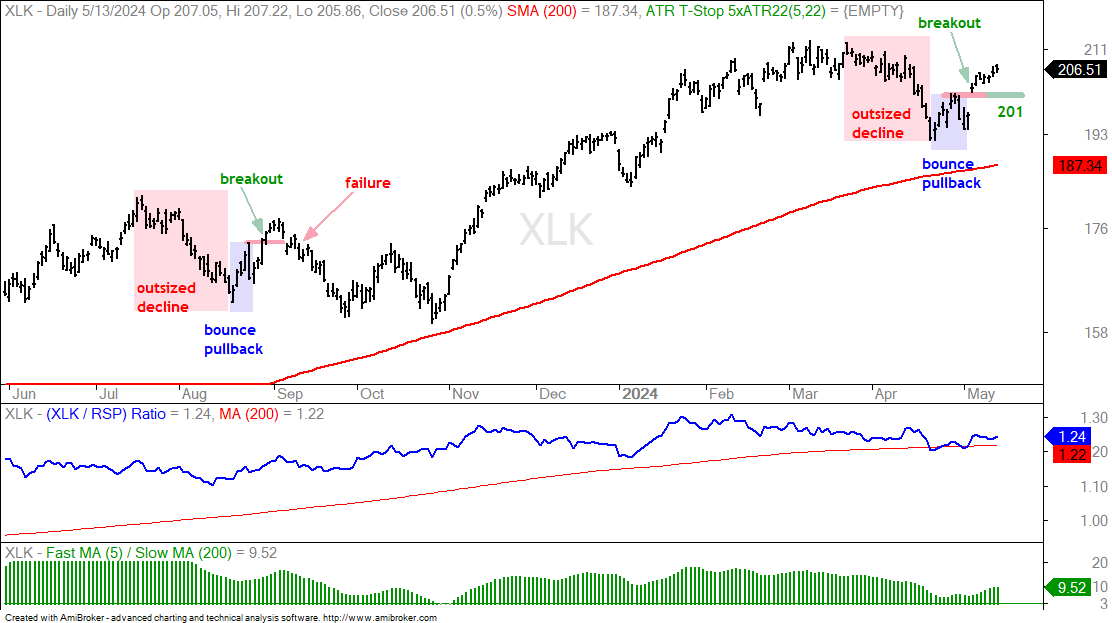
The next chart shows the Technology SPDR (XLK) and my comparison with August. We can see an outsized decline to reverse the medium-term uptrend. There is then a bounce and a pullback to establish short-term resistance. XLK broke short-term resistance in August, held this breakout for five days and then fell back below the breakout zone in early September (failed breakout). Currently, we have an outsized decline and short-term breakout working. This breakout is bullish as long as it holds. A close below 198 would signal a breakout failure and argue for another leg lower. Technology accounts for 29.5% of the S&P 500 and is by far the biggest sector.
MAG7 is not the LAG7
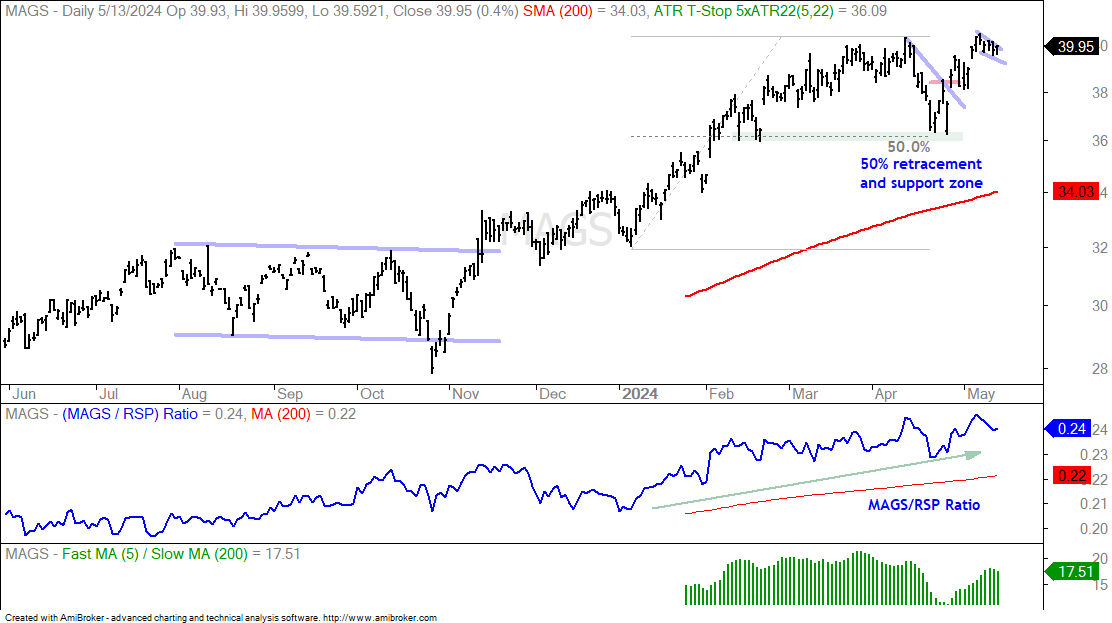
The next chart shows the Mag7 ETF (MAGS) hitting a new high last week (May 6th). Stocks and ETFs hitting new highs here in May are leading, not lagging. The price-relative (MAGS/RSP ratio) also hit a new high in early May (blue line). On the price chart, MAGS reversed at the 50% retracement and support zone from the February low (green shading). The ETF broke short-term resistance with the surge off the late April low. After hitting a new high last week, MAGS edged lower the last five days and formed a small pennant. A breakout here would open the door to more new highs.
Nvidia Gets Pre-Earnings Breakout
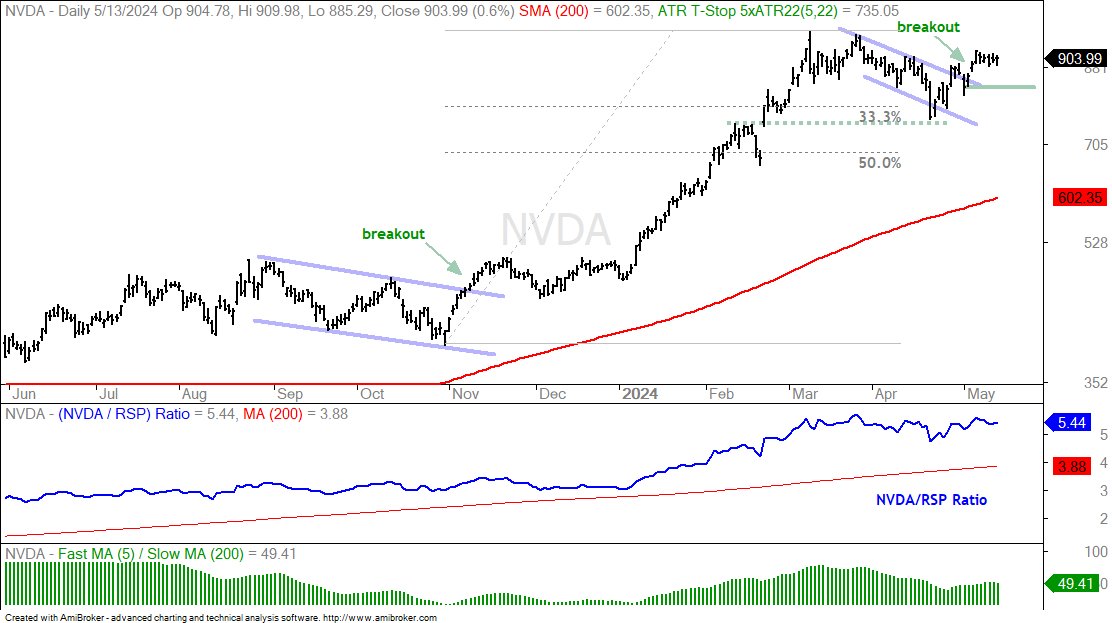
Nvidia (NVDA) is helping MAGS with a flag breakout. Note that AMZN and GOOGL are the leaders because they recorded new highs over the last few weeks. MSFT is not far behind. META rebounded after its late April gap. TSLA and APPL are the laggards, but they too surged over the last few weeks. Note that NVDA reports on May 22nd. On the price chart below, the stock retraced around 33% of the October-March advance and returned to the mid February breakout level (dashed line). It broke out of the flag and is holding this breakout with a tight consolidation the last five days. My key level is 830 (green line) and a break here would negate the breakout.
CIBR, SKYY and IGV are Near Resistance
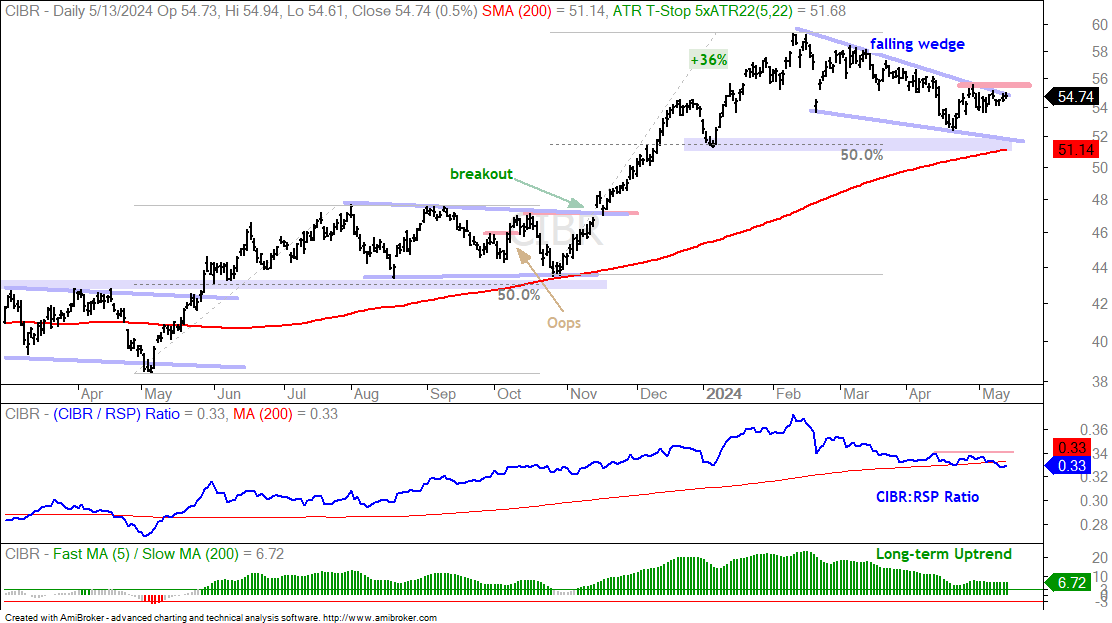
Will this oversold bounce extend and turn into a new leg higher? ETFs such as the Cybersecurity ETF (CIBR), Software ETF (IGV) and Cloud Computing ETF (SKYY) may hold the key. All three are in long-term uptrends and correcting over the last few months. They bounced off the mid April lows, but are just short of breakouts. In fact, they are very close to resistance and at make or break levels. Another push higher would trigger breakouts that would be positive for the tech sectors. Failure to break out would be negative. The first chart shows CIBR with a falling wedge and resistance at 55.5 (call it 56). A breakout here would be bullish.
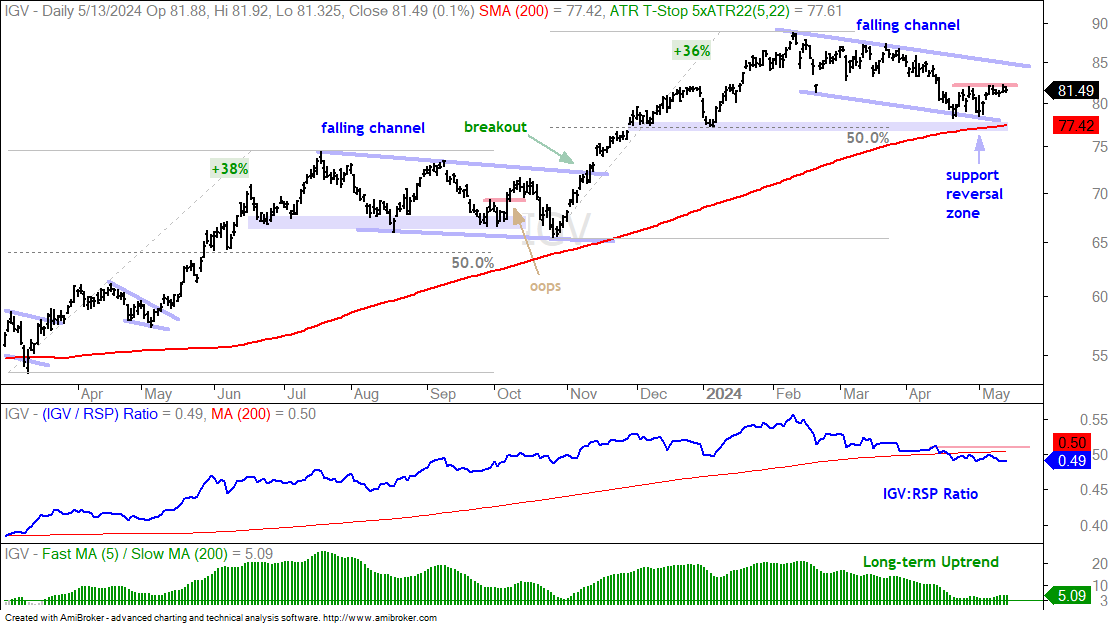
The next chart shows IGV with a falling channel that retraced around 50% of the prior advance and returned to the rising 200-day. IGV fell sharply into mid April and then firmed the last few weeks. A breakout at 82 would reverse the swing within the falling channel and increase the odds of a bigger breakout.
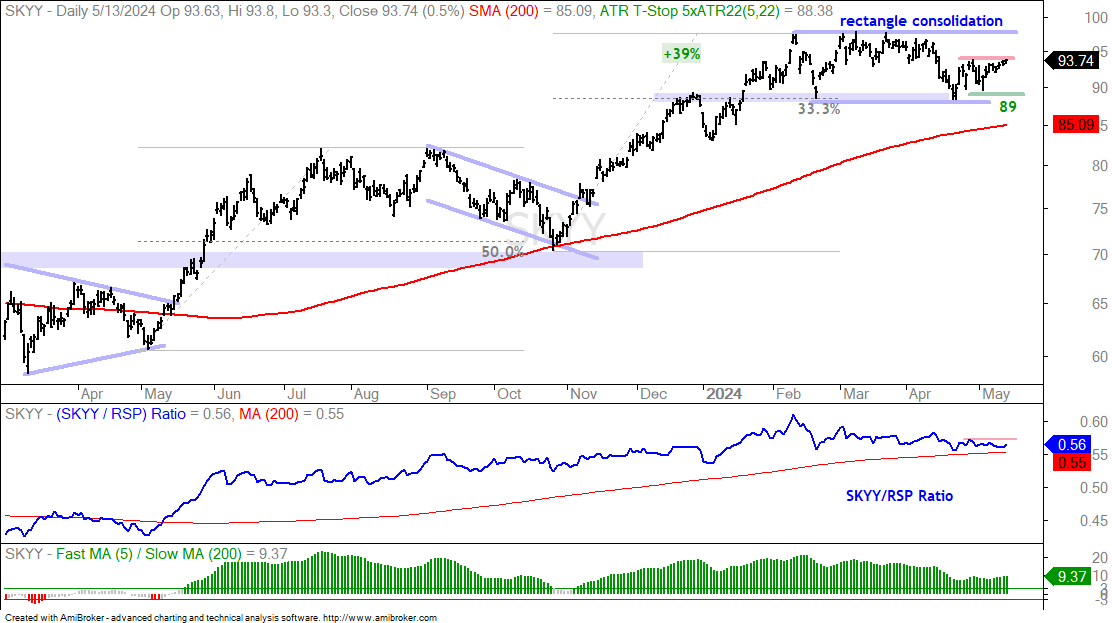
The next chart shows SKYY with a rectangle consolidation since February. The ETF bounced off support and the 33% retracement line in the second half of April, but remains just shy of a short-term breakout at 94. A breakout here would increase the chances of a bigger breakout at 98.
AMD Corrects back to Rising 200-day SMA
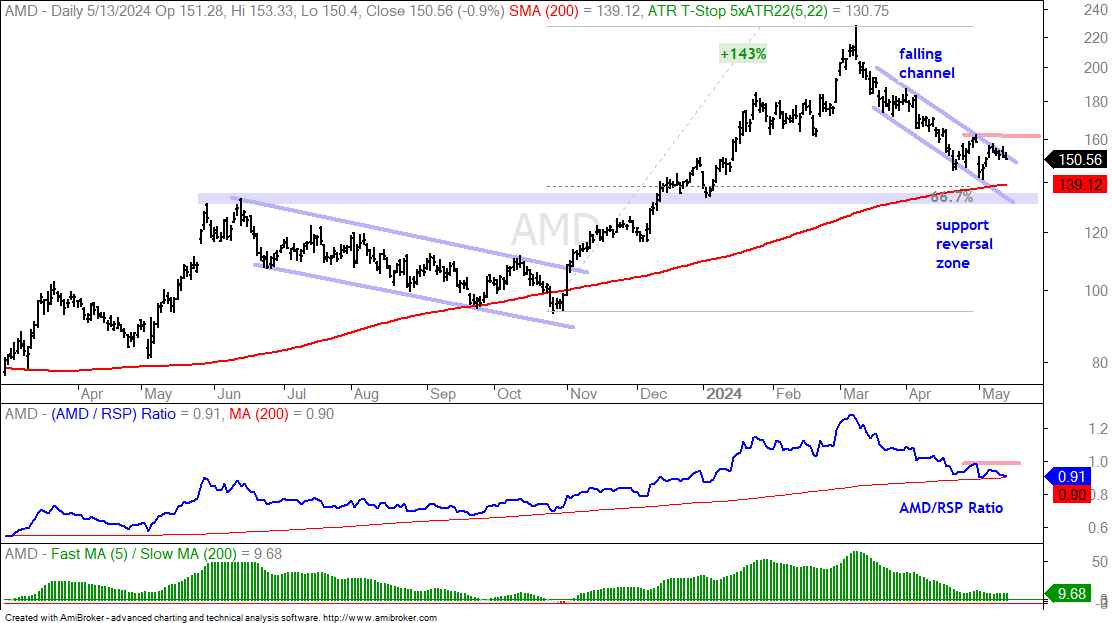
Advanced Micro Devices (AMD) is setting up as it forms a correction within a bigger uptrend. The stock surged some 143% into March and its 5-day SMA was over 50% above the 200-day SMA. After becoming very extended, AMD corrected with a move that retraced almost 66.7% of the prior advance. There is also support from May-June resistance and the early January low. Throw in the rising 200-day SMA and AMD hit a Support-Reversal Zone in the 140 area. A falling channel formed with resistance at 161. A breakout here would be bullish and signal a continuation higher.
SMCI Corrects after Monster Move
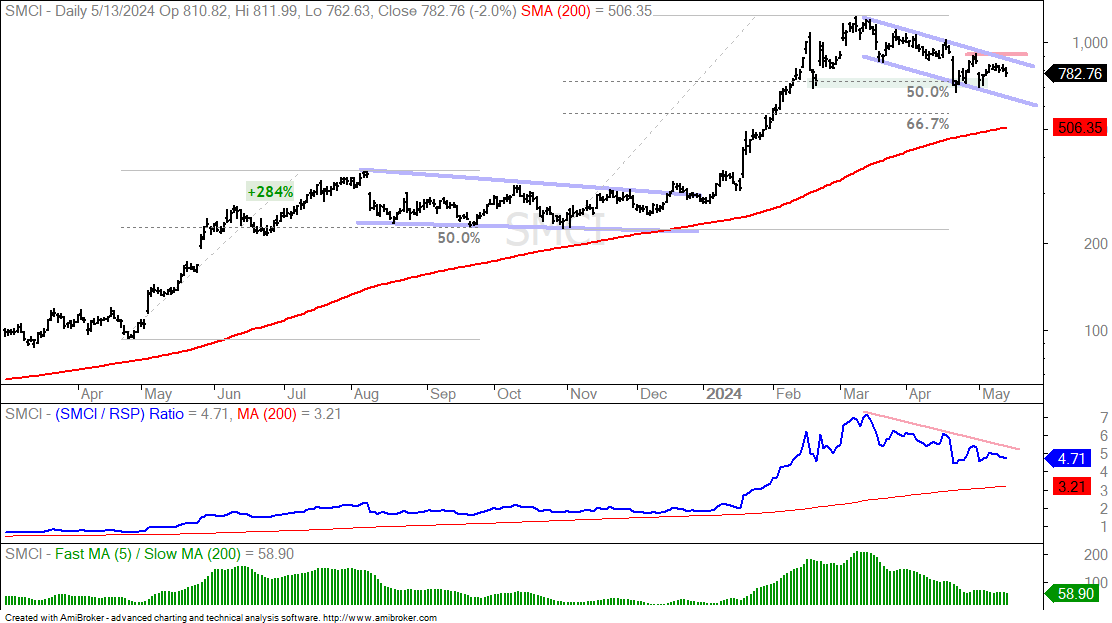
Super Micro Computer (SMCI) is another stock that rode the AI story to dizzying heights. The stock surged 284% from late April to early August (2023), corrected for 4-5 months and then surged 350% from early January to mid March. The stock then corrected into April and hit a Support-Reversal Zone (green shading). Two items mark this Support-Reversal Zone: the 50% retracement and the February low. SMCI is firming, but remains short of a breakout that would signal the end of this correction. I am marking resistance at 900 and a breakout here would signal a continuation of the bigger uptrend.
Lilly and Merck Consolidate within Uptrends (plus TMO)
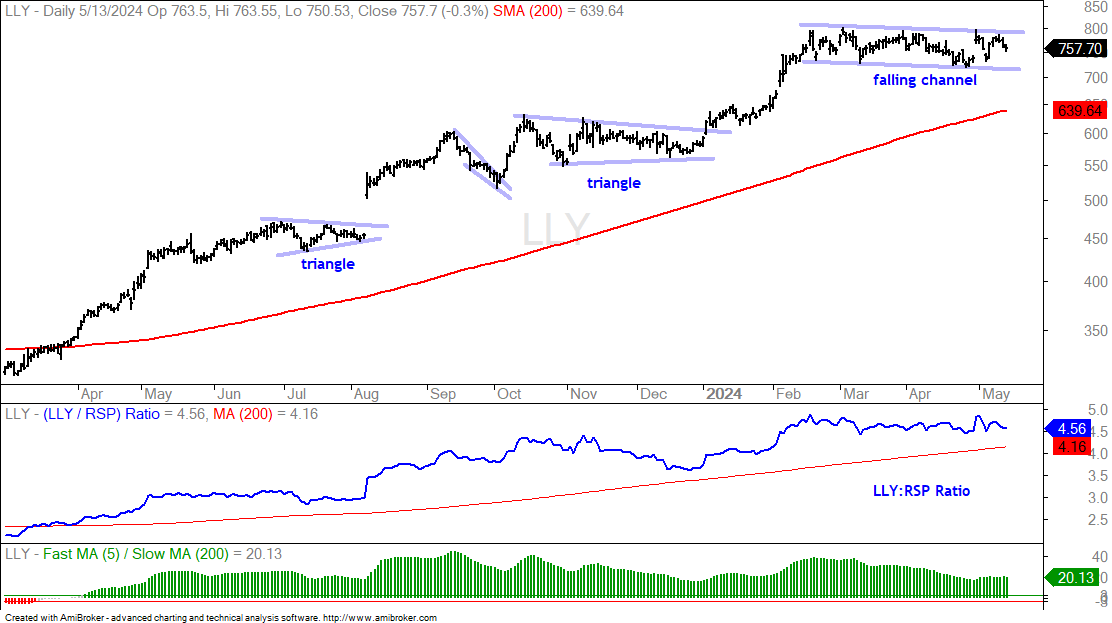
The next two stocks are key components of the Healthcare SPDR (XLV). Eli Lilly (LLY) accounts for 11.4% and is the biggest holding. Merck (MRK) accounts for 6.2% and is the fourth largest holding. Thermo Fisher (TMO), which I will also feature, accounts for 4.3% and is the sixth largest. Note that I featured XLV on May 2nd as it bounced off a Support-Reversal Zone. The first chart shows LLY with a surge to new highs in February and an extended consolidation into May. This looks like a falling channel and I consider it a bullish continuation pattern. LLY surged in late April with a gap, but did not break out. I am marking resistance at 800 and a breakout here would be bullish.
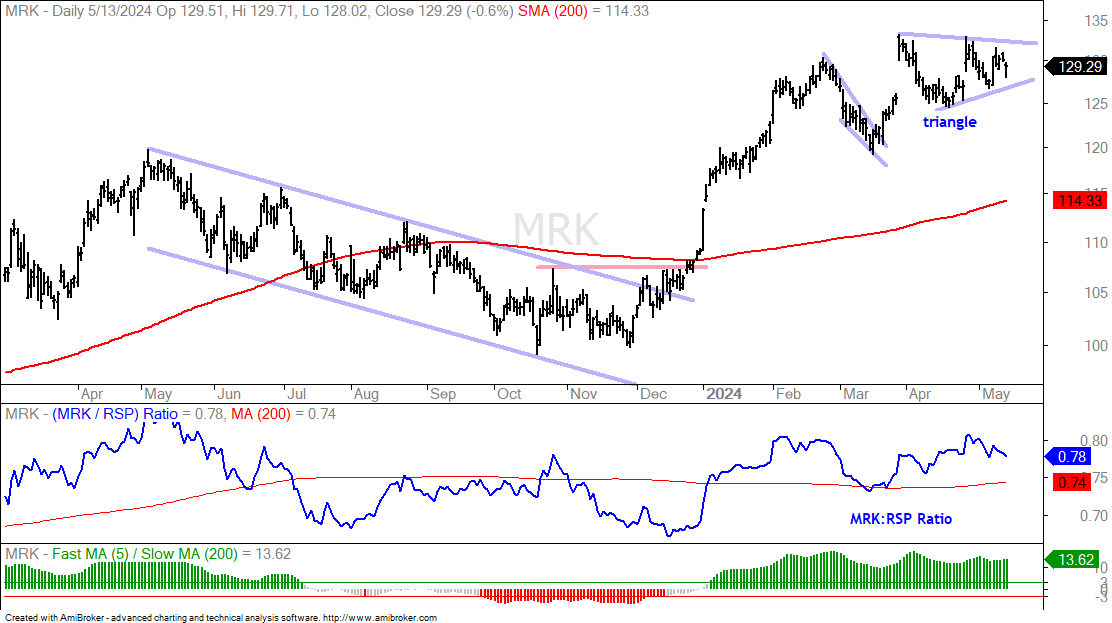
The next chart shows MRK with a gap-surge to new highs in late March and a consolidation into May. This triangle is a rest with a bigger uptrend and a bullish continuation pattern. A breakout at 132 would signal a continuation higher.
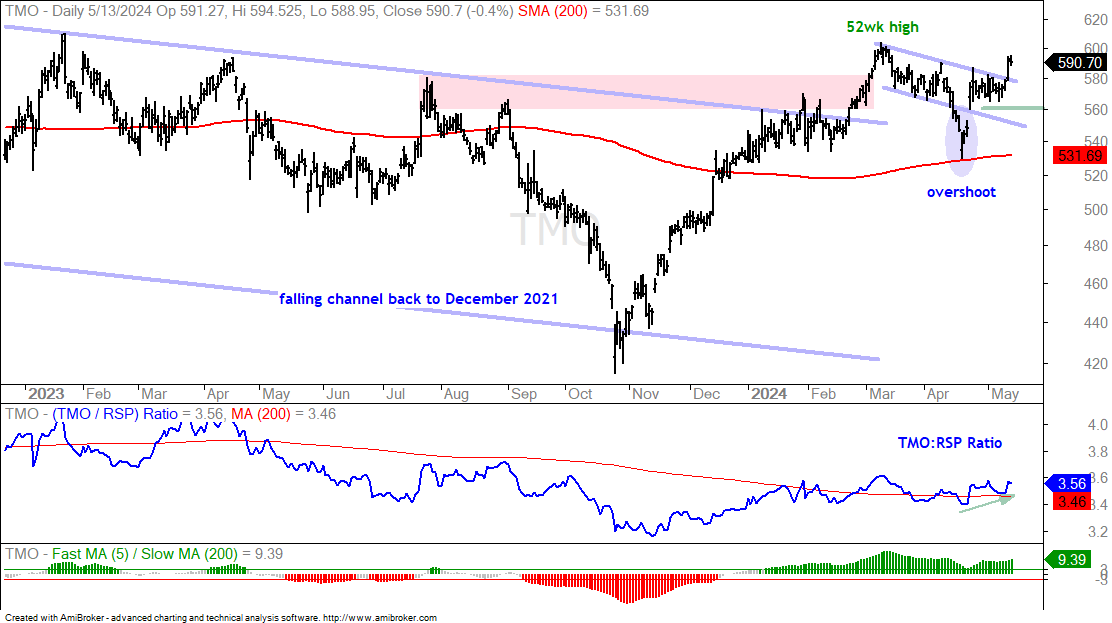
The next chart shows TMO with a falling channel that extends back to December 2021! TMO broke out of this channel with a surge into March and recorded a 52-week high. The stock fell back into April and even plunged to its 200-day SMA in mid April. I attribute this overshoot to broad market weakness at the time. TMO immediately rebounded and then consolidated into May. The stock broke out with a surge on Friday and this signals an end to the corrective period. I would mark re-evaluation support at 560.