

Russell 2000 Hits Inflection Point as it Battles to Hold Uptrend – Plus IJH & IJR
- Arthur Hill, CMT
Welcome to the Chart Fix!
The small and mid cap ETFs are at inflection points as they battle to hold their long-term uptrends. This group lagged in September, held up in October and turned volatile in November. Will weakness in semis and large-cap tech drag them down? Today’s report will show the key levels to watch for a breakout in the Russell 2000 ETF (IWM), and spotlight a teetering trend-following indicator.
Recent Reports and Videos at TrendInvestorPro
- Knee-Jerk Leaders/Laggards – Energy Hit – MAGS and SMH Go Separate Ways
- Bullish Setups for the Russell 2000 ETF, Industrials SPDR and Amazon
- Tech Breaks Down – Spreads Widen – Smalls and Mid Caps Pick Up Slack
- QQQ Derails with Outsized Decline – Defensive Groups Lead – Biotech Breakout
- Click here to take a trial and gain full access.
Breakout Attempts Fail for Russell 2000 ETF
The Russell 2000 ETF (IWM) firmed and turned up in October, but failed to hold its breakout as selling pressure took hold this week. The chart below shows weekly candlesticks for IWM over the last three years. As the blue shading shows, IWM is in a long-term uptrend with a series of higher highs and higher lows since the May 2025 breakout.
IWM fell rather sharply in August-September, but managed to firm in the 50-61.8 percent retracement zone in October. After surging 28% into August, it is normal to give back half during a correction. Think of it as two steps forward and one step backward. IWM firmed with a harami, which is an inside week, and turned up in late October with a break above the channel trendline.
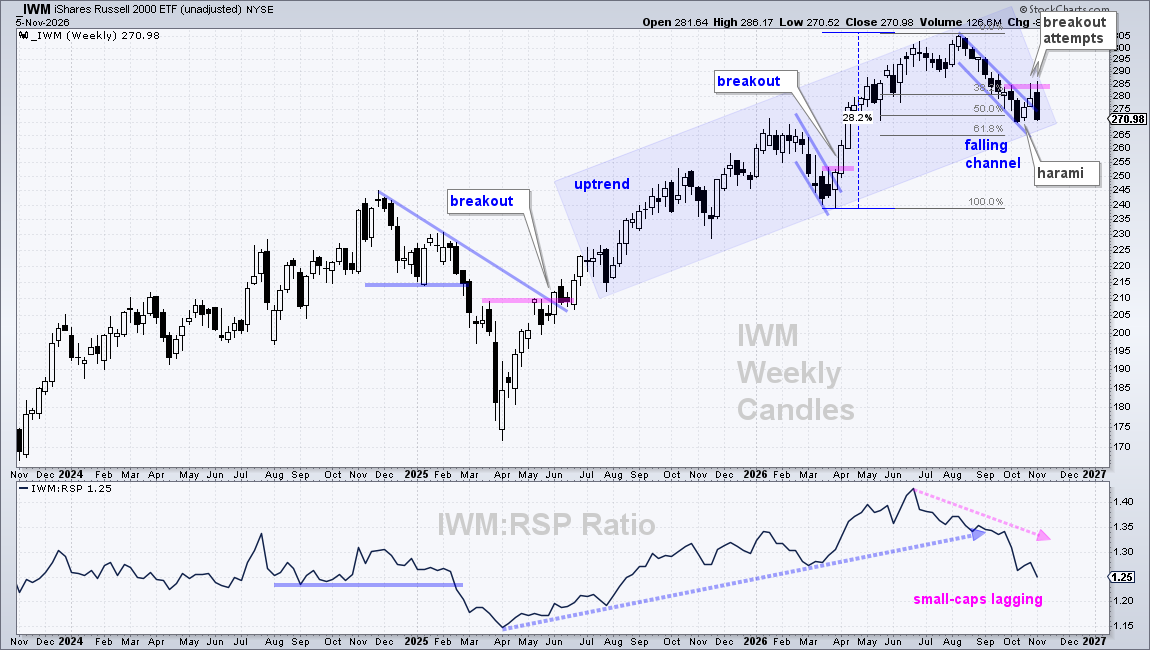
This chart showed promise in late October as small-caps held up when techs and QQQ got hit. IWM attempted weekly breakouts at 285 last week and this week, but could not hold its gains. More concerning, this week’s failure occurred with an exceptionally sharp decline on Thursday. This second failure solidifies 285 as the level to beat. A weekly close above 285 would be bullish.
We must also entertain the bearish possibilities with this week’s sharp decline. First, there are two failed breakout attempts. Second, IWM is lagging the S&P 500 EW ETF (RSP) since July. The bottom window shows the IWM:RSP ratio turning down in July and moving sharply lower in September-October. Relative to the average stock in the S&P 500, small-caps show relative weakness. And thirdly, IWM is on the verge of a bearish trend signal.
Plan your trade, and then trade your plan. Before making a trade, it is important to plan your entry/exit strategy. For entries, traders need to decide if they are buying before the breakout or after the breakout. For exits, traders need to pick an exit level or indicator exit signal – before entering the trade. Traders can also consider profit targets to lock in future gains or trailing stops. Once planned, traders can then trade according to that plan. This will help manage the emotions when volatility strikes.
TrendInvestorPro covered breadth thrusts in the S&P 1500 and S&P MidCap 400 over the last two weeks. These thrusts are in jeopardy as semis drag down the market. We noted the outsized decline in QQQ on October 15th, the semiconductor breakdowns on October 20th and the widening yield spreads. Click here to take a trial.
Long-term Uptrend in Jeopardy as PPO Teeters
The next chart shows weekly candlesticks with the 4-week EMA, 40-week EMA and PPO(4,40,0), which measures the percentage difference between the two EMAs. An uptrend signaled when the 4-wk EMA crossed above the 40-wk EMA in June 2025. Most recently, the short EMA fell to the long EMA in October and we are at an inflection point for the long-term uptrend.
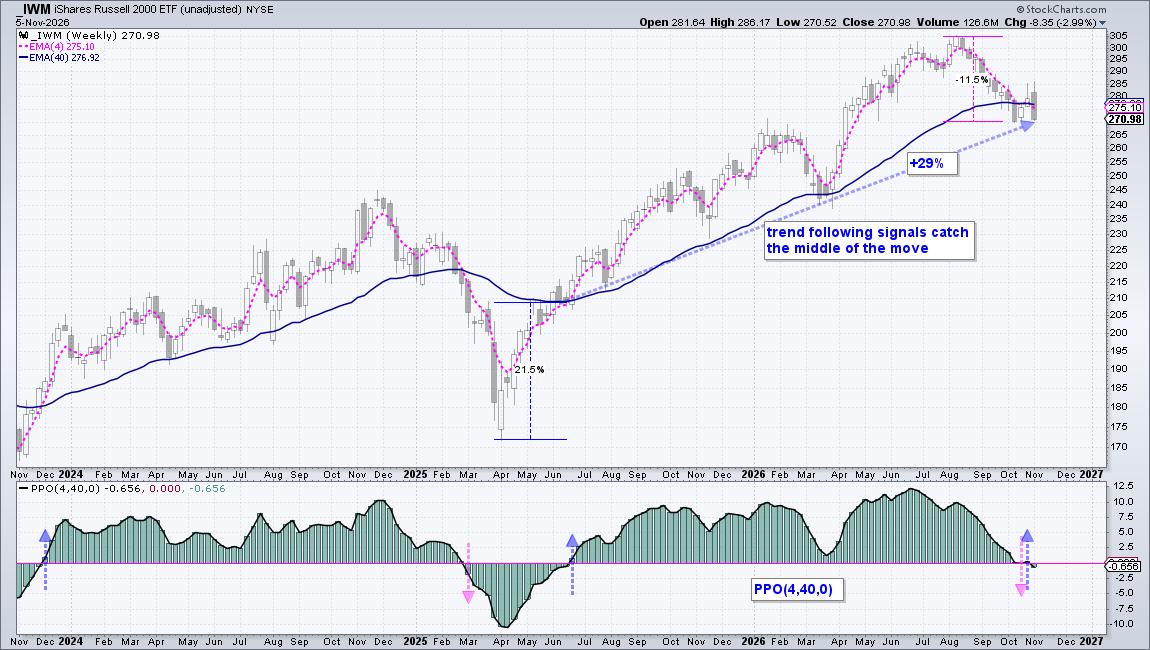
We are now seeing whipsaws with the volatility over the last few weeks. The PPO turned negative three weeks ago, positive last week and back negative this week. This week is still a work in progress because this chart is based on Thursday’s close. Should the PPO stay negative at the end of the week, a downtrend would signal for IWM. The combination of relative weakness and a downtrend would be bearish.
As with all trend-following indicators, there will be good signals, bad signals and whipsaws. In addition, trend-following indicators lag. Notice that IWM was 21.5% off its early April low when the uptrend triggered. Similarly, IWM is currently around 11.5% below its August high. In between these lagging signals, IWM gained 29% (blue arrow line). One good trend pays for the whispaws and bad signals.
Russell 2000 is the Canary in the Small-Cap Coal Mine
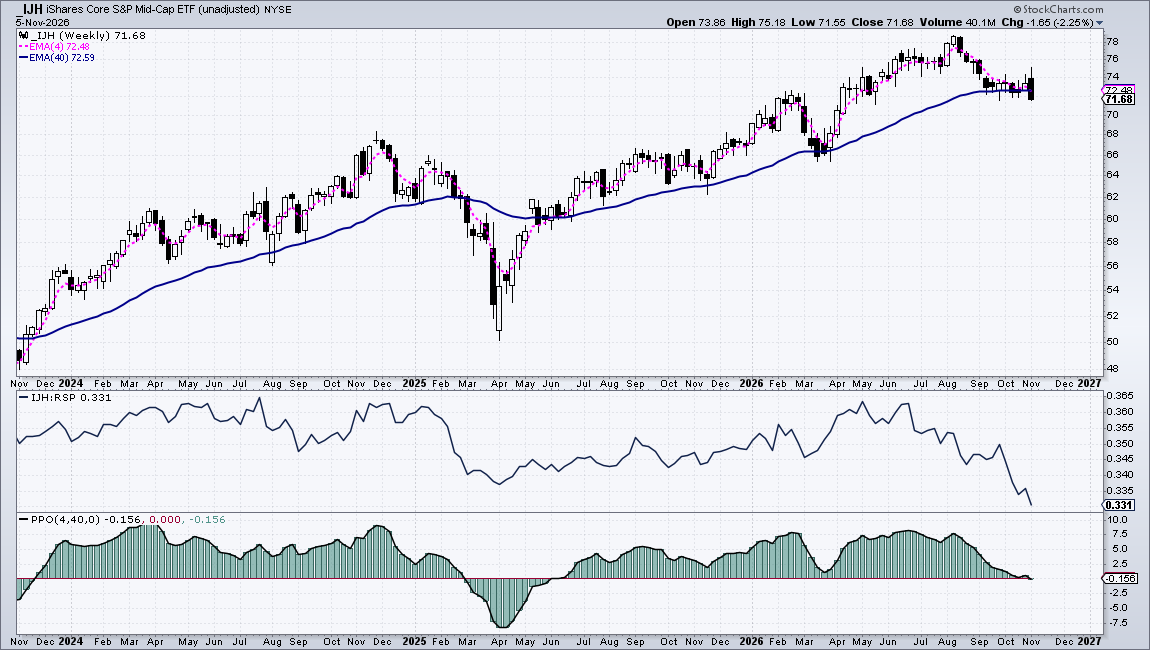
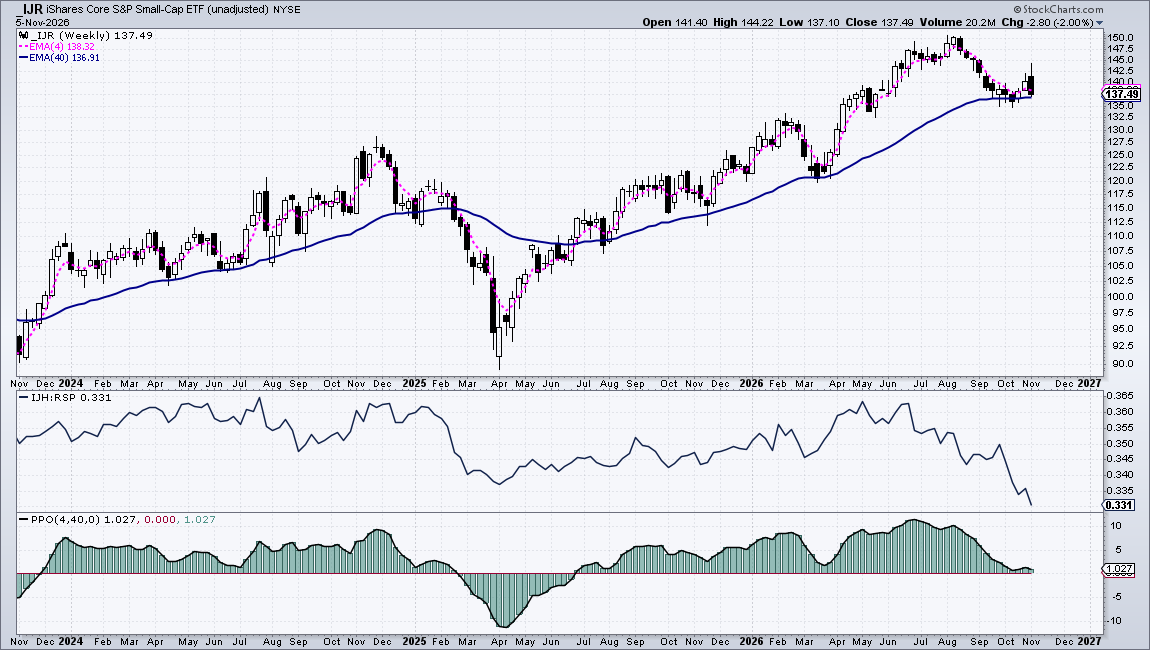
The Russell 2000 ETF (IWM) is the canary in the coal mine for small-caps and mid-caps. Furthermore, the S&P SmallCap 600 SPDR (IJR) and S&P MidCap 400 ETF (IJH) show a strong positive correlation with the Russell 2000 ETF, which means they move in the same direction. Listing requirements are stricter for the S&P SmallCap 600 because S&P requires components to be profitable. Fortune estimates that some 40% of Russell 2000 components are unprofitable. Thus, the Russell 2000 represents the risky end of the stock market and relative weakness bodes ill for the risk-on trade.
For reference, here are the charts for IJH and IJR.
TrendInvestorPro specializing in finding tradable pullbacks within uptrends. Click here to take a trial and gain full access to our reports and videos.