
QQQ Derails with Outsized Decline – Defensive Groups Lead – Biotech Breakout
- Arthur Hill, CMT
Welcome to the Chart Fix!
Wicked rotations are underway within the stock market. Tech led in September, but turned laggard in October as QQQ experienced an outsized decline, which can derail an uptrend. Healthcare lagged in September, but turned leader in October. Overall, Healthcare and Energy are the strongest sectors. Within Healthcare, the Biotech ETF is taking the lead with an October breakout.
Recent Reports and Videos at TrendInvestorPro
- Finance Hits Retracement – AI/Semis Get Oversold Bounces – Biotechs Lead
- Breadth Models Remain Bullish – Rates Trend Higher – Yield Spreads Show Stress
- Agribusiness and Aero-Defense ETFs Firm – Oil Services ETFs Turn Up
- Seasonal Patterns – Thrust Set Up – SPY, QQQ & XLK Hold Breakout Zones
- Click here to take a trial and gain full access.
Wicked Rotations within the Stock Market
October is a mirror image of September. Just a month ago, QQQ (+3.3%) and Tech (+5%) were leading the pack, while small-caps, mid-caps and the defensive sectors were lagging. Fast forward to October and the roles have changed. QQQ (-3.3%) and Tech (-3.6%) are leading the way lower, while small-caps, mid-caps and the defensive sectors lift the market.
SPY is caught in the middle. Weakness in tech and the hyper-scalers is weighing, but this weakness is offset by strength elsewhere. As the red bar on the PerfChart below shows, SPY is up .88% month-to-date. QQQ, Tech and Communication Services are down 3.3%, 3.6% and 8.8%, respectively.
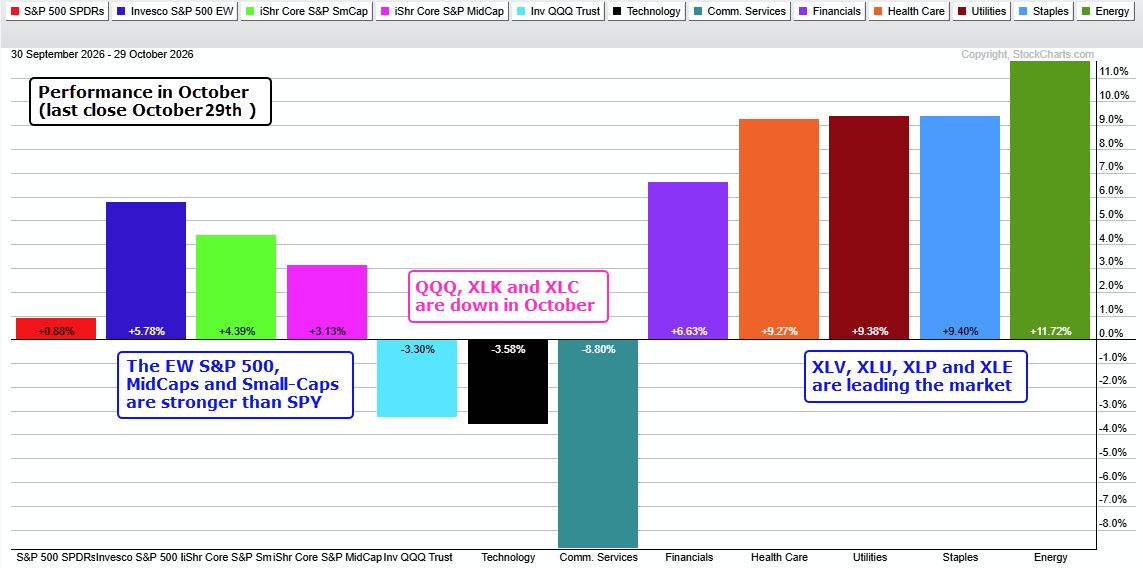
Meanwhile, the S&P 500 EW ETF (RSP) is up 5.78% in October, the S&P SmallCap 600 SPDR (IJR) is up 4.39% and the S&P MidCap 400 ETF (IJH) is up 3.13%. On the right side of this PerfChart, we can see the leading sectors. Healthcare, Utilities, Staples and Energy are up more than 9% in October.
QQQ Uptrend Derails with Outsized Decline
While the performance in small-caps, mid-caps and defensive sectors is impressive, I am concerned with the weakness in QQQ, XLK and XLC. In particular, QQQ suffered an outsized decline from a 52-week high as it fell more than 7% from October 7th to 20th. Prior outsized declines led to a long corrective period from December to March and a correction in June-July. Note that this outsized decline was brought to our subscribers’ attention in the report on October 20th.
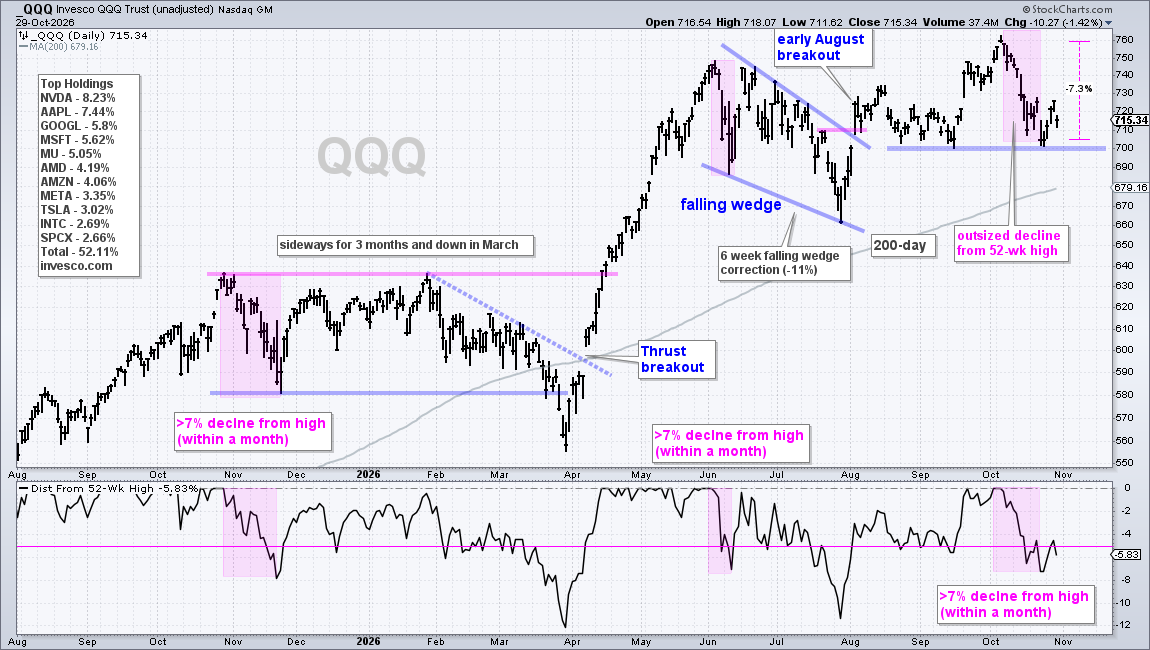
The indicator window shows the percentage distance from 52-week high indicator. The pink shaded boxes show when QQQ fell over 7% from a 52-week high in a relatively short period of time (1-4 weeks). Sudden and sharp declines from new highs can destabilize the uptrend, leading to a corrective period.
QQQ is currently testing the early August breakout zone in the 700-710 area. The early August breakout was the last bullish signal and this breakout is under threat. A break below 700 would negate this early August breakout and further the argument for a derailed uptrend.
Chartists looking for opportunities should focus on industry groups and stocks within leading sectors. In particular, Healthcare and Energy hit new highs this week and sport the strongest charts. This week, TrendInvestorPro covered breakouts in biotech (Healthcare sector) and bullish setups in oil services (Energy sector). Click here to take a trial and get this report.
Biotech ETF Corrects and Breaks Out
The first chart shows the Biotech ETF (IBB), which is dominated by large-caps biotechs. As the holdings on the chart show, the top 11 stocks account for 52% of the ETF. Amgen and Gilead, the two top holdings, hit new highs this week.
First and foremost, IBB is in a long-term uptrend with a new high this week and price above the rising 200-day SMA. The rising 200-day and July low mark long-term support in the 180-190 area.
The ETF surged 33.6% from June to August and then corrected into mid October with a falling channel. Corrections and pullbacks within uptrends provide traders with opportunities. This pullback retraced around 38% of the prior advance and returned to the July high. Note that prior resistance turns future support and IBB held the 200 area in October (blue dashed line).
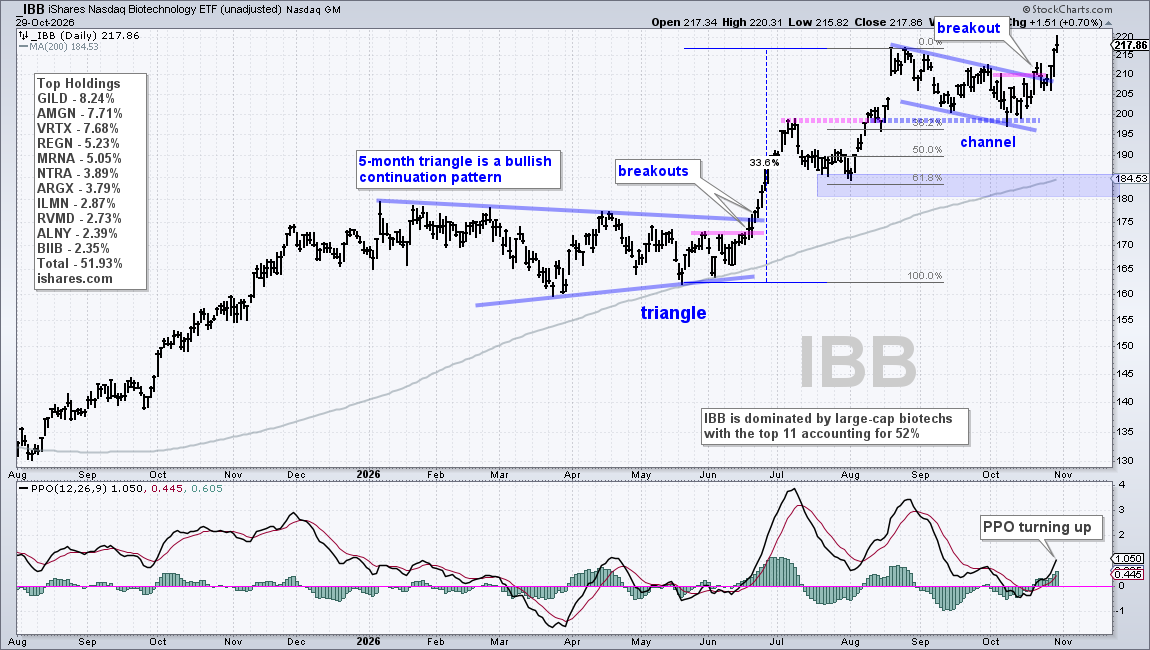
IBB turned up in October as price broke out on October 20th and the PPO turned back up. Notice that the PPO moved above its signal line and back into positive territory, which means the 12-day EMA crossed back above the 26-day EMA.
Weekly Chart and PPO for Long-term Perspective
Keep in mind that biotechs can be volatile and there could be a post-breakout pullback, especially with the wicked market rotations. While a break below the October low would seem negative, it would not derail the long-term uptrend. Instead, such a move would put IBB back in corrective mode. As long as the broader market environment remains bullish and IBB is in a long-term uptrend, pullbacks are considered corrections and potential opportunities.
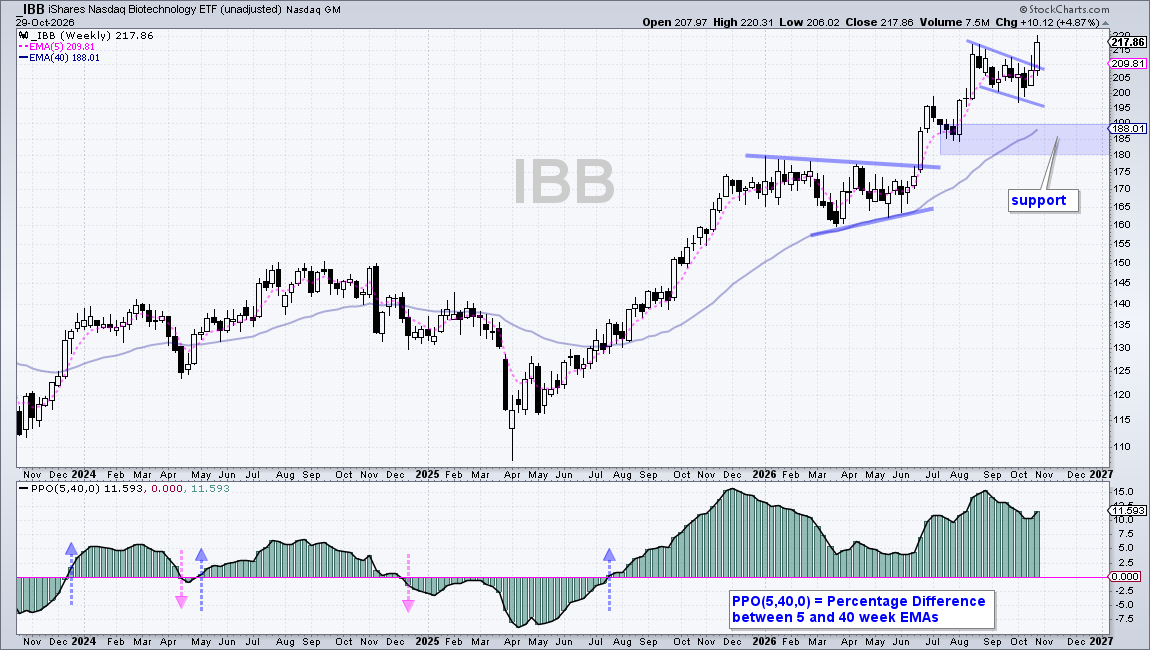
IBB is in a long-term uptrend as long as the long-term PPO remains positive. The chart above shows weekly candlesticks, the 5-week EMA and the 40-week EMA for a long-term perspective. In the indicator window, we have the PPO(5,40,0). This indicator is positive when the 5-week EMA is above the 40-week EMA (uptrend) and negative when the 5-week EMA is below the 40-week EMA (downtrend).
TrendInvestorPro specializing in finding tradable pullbacks within uptrends. We brought the IBB setups to our subscribers’ attention in June, August, September and October. Click here to take a trial to TrendIvestorPro