Zweig Breadth Thrust Dominates the Headlines – But What about an Exit Strategy?
- Arthur Hill, CMT

")
The Zweig Breadth Thrust for the S&P 1500 triggered on Thursday as stocks surged last week. In poker terms, this thrust signals an abrupt participation shift as stocks move from folding to all-in within ten days. A bullish thrust signal is only part of the puzzle. How do we know when this signal fails? Today’s report will look at the ZBT signal in the S&P 1500 and offer an exit strategy. Stick around to the end for an offer to access a fully quantified strategy based on the Zweig Breadth Thrust.
ZBT Triggers for S&P 1500, but Not S&P 500
The first chart shows the Zweig Breadth Thrust (ZBT) indicator triggering bullish as it moved from below -20% to above +23% within ten trading days (blue line). This thrust signal means S&P 1500 advance-decline breadth became oversold with strong selling pressure and then recovered in dramatic fashion with a surge in upside participation. Moreover, this shift occurred within a 10 day window. This reversal of fortune was both sudden and sharp.
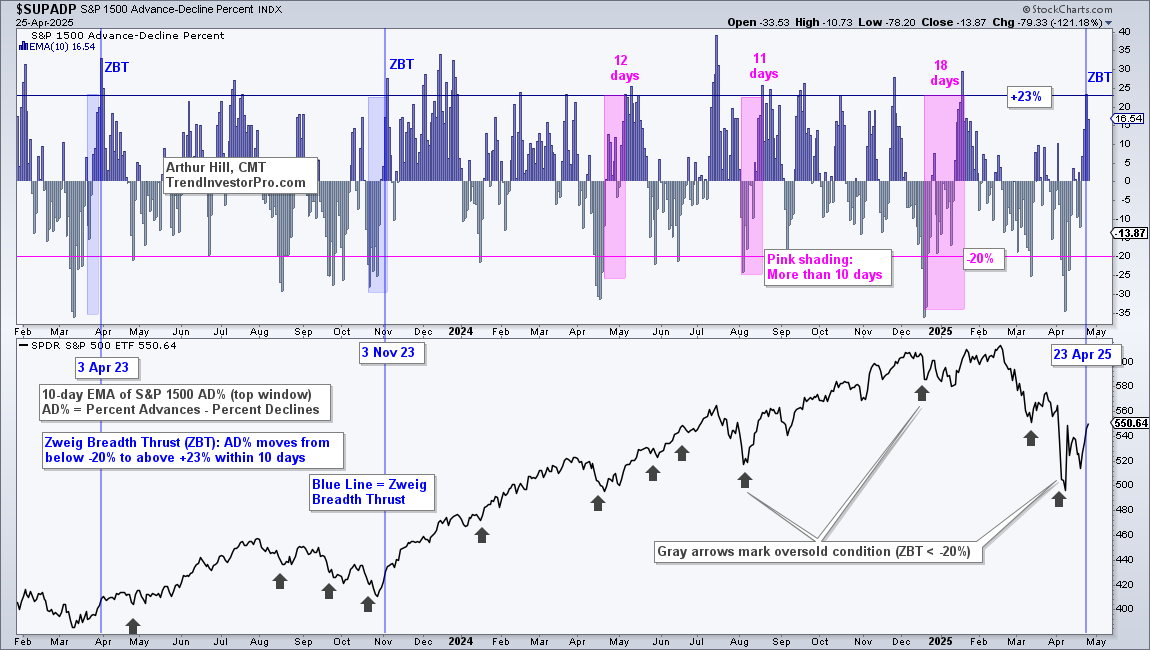
Note that the Zweig Breadth Thrust trigger an epic signal in November 2023, and we were on it. See this report (11-November-2023) for details on the original NYSE-based Zweig Breadth Thrust. See this report (18-November-2023) for details on using S&P 1500 Advance-Decline Percent to create a Zweig Breadth Thrust indicator.
Subscribers have access to two timely reports and videos. The first report explains the mechanics of the original NYSE-based Zweig Breadth Thrust indicator and then shows a modern version using S&P 1500 Advance-Decline Percent. The second report covers the setups and thrust signals for the percent above SMA indicators. Some of these indicators also triggered this week, but not all.
S&P 500 ZBT Falls Short
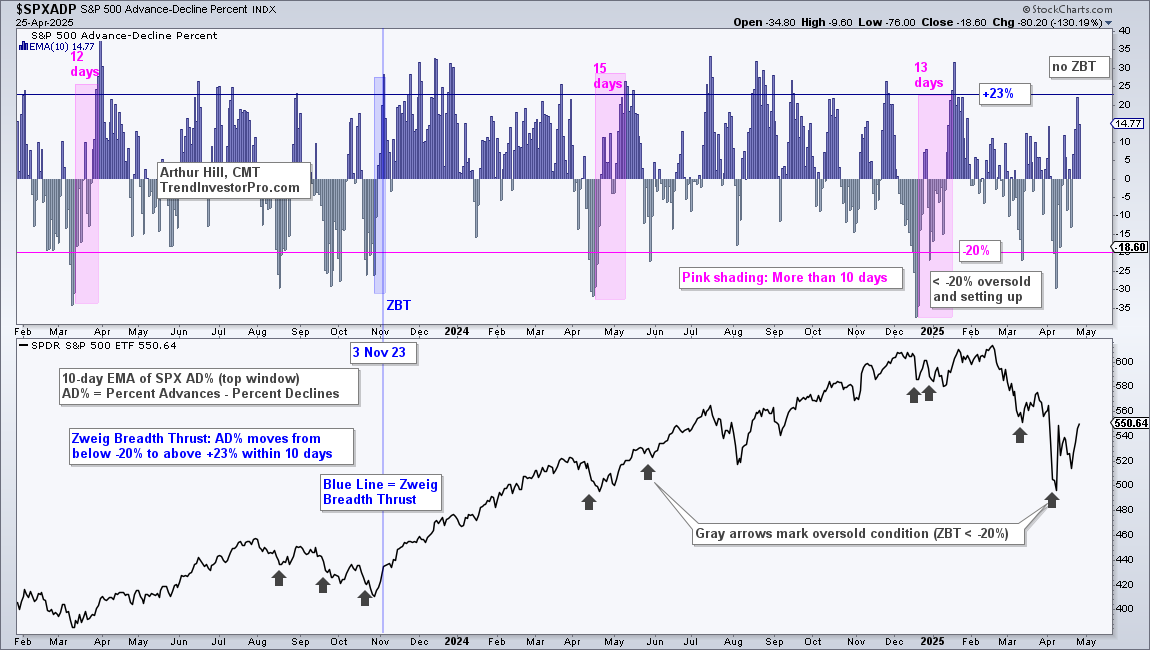
The ZBT indicator for the S&P 500 did not trigger. The indicator was below -20% on April 8th and did not make it back above +23% within the 10 day window. In fact, the indicator did not make it back above +23% this week. This shows less upside participation within the S&P 500, and more upside participation within the S&P 1500. Small and mid cap breadth outperformed large-cap breadth this week.
Where’s the Exit?
The Zweig Breadth Thrust is only used for bullish signals, which means chartists must find another indicator to signal a failed thrust. As its name implies, a thrust is a strong upward move that is powerful enough to foreshadow an extended advance. The Zweig Breadth Thrust in November 2023 provides a classic example as SPY continued higher, never looking back. The blue line shows when both the S&P 1500 and S&P 500 ZBT indicators triggered in early November.
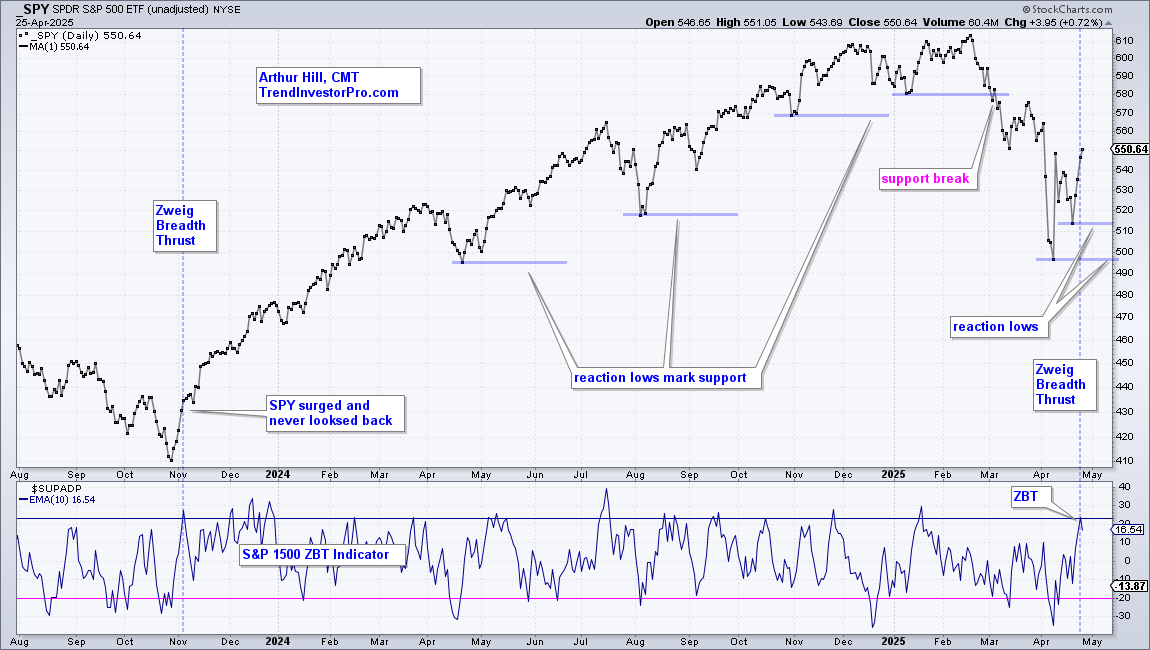
Chartists looking for an exit strategy can consider prior support levels based on reaction lows (troughs). The horizontal blue lines show these support levels, starting with the late October 2023 low. SPY forged a reaction low in January 2025, hit a new high in February and then broke support to trigger an exit. Current support levels are based on the April lows.
Chartists looking for a more dynamic approach can consider a trend-following indicator, which we will explore next (subscribers).
This week at TrendInvestorPro we posted two educational reports and videos covering the Zweig Breadth Thrust and two other breadth indicators for generating thrust signals. We also show how a trend-following indicator can be used for an exit strategy with the current Zweig Breadth Thrust. This strategy is fully disclosed and quantified with backtest results.
Click here to subscribe and get immediate access to these reports and videos.
This content is for subscribers. (Login or Subscribe)
SPY surged above the lower Keltner line with a big move this week. A successful rocket lift should extend and we should see further gains. A failed liftoff will turn down and head back towards the April lows. There are two things to watch for a failure. First, a close below last week’s low (508). Second, a close below the lower Kelter channel for five consecutive days. I require five days to avoid whipsaws, such as the one seen in early August 2024.
Charting the ZBT Keltner Strategy
I put this strategy to the test using Amibroker. The strategy buys when either the S&P 1500 or S&P 500 trigger a Zweig Breadth Thrust and SPY is above the lower line of the Keltner Channel. The strategy sells when SPY closes below the lower line of the Keltner Channel for 5 consecutive days.
The chart below shows the signals since 2020. Green up arrows mark the buys and red down arrows mark the sells. In the middle window, we have the Zweig Breadth Thrust signals: 1 for when either the S&P 500 or S&P 1500 triggers and 2 when both trigger.
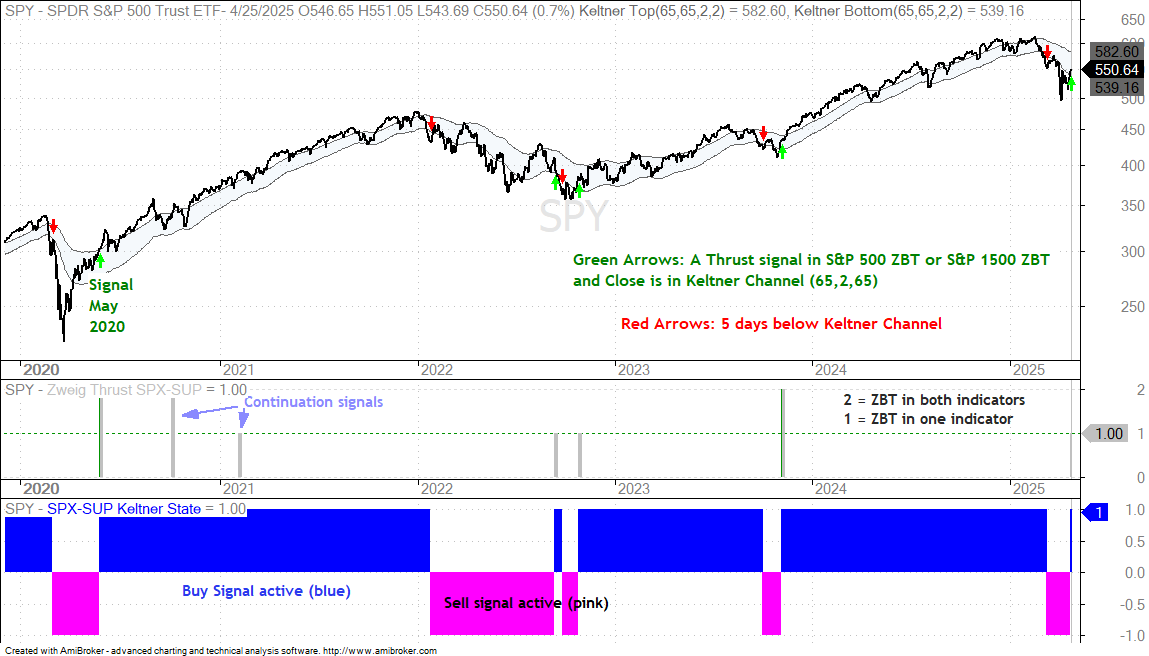
Not every thrust signal triggers a new BUY. Signals in October 2020 and February 2021 are “continuation signals” because they triggered when a BUY signal was already active (May 2020). The bottom window shows periods when a BUY signal is active (blue) and periods when a SELL signal is active (pink).
Higher Return and Strong Win Rate
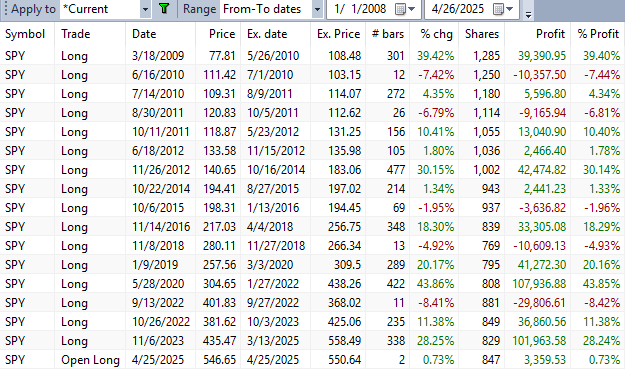
The test runs from January 2008 until April 2025. Note that there were no signals from 2005 until 2008. This strategy buys SPY on the open on the day after the entry signal and sells on the open the day after the exit signal. There are no commissions or slippage. Results are compared against SPY buy-and-hold and signals using the 5/200 day SMA cross.
First, note that it is hard to beat a basic strategy that buys when the 5-day SMA crosses above the 200-day SMA and sells on a close below. This simple timing strategy produced a Compound Annual Return (CAR) of 7.93% with an Average Drawdown of 15.74%. The Win Rate, however, was below 50% because of whipsaws. This is the downside of moving average crossover strategies.
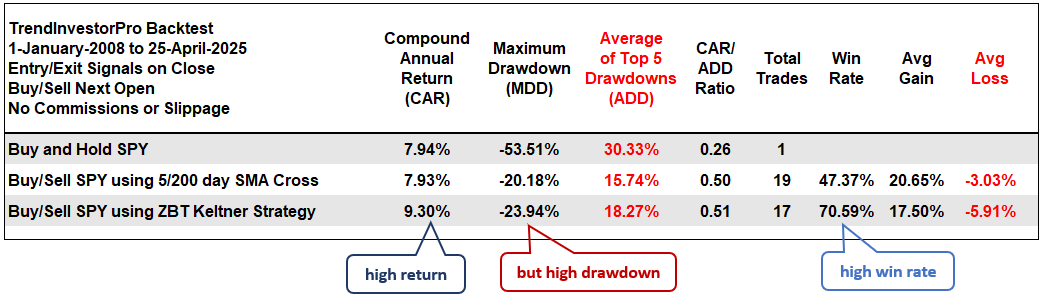
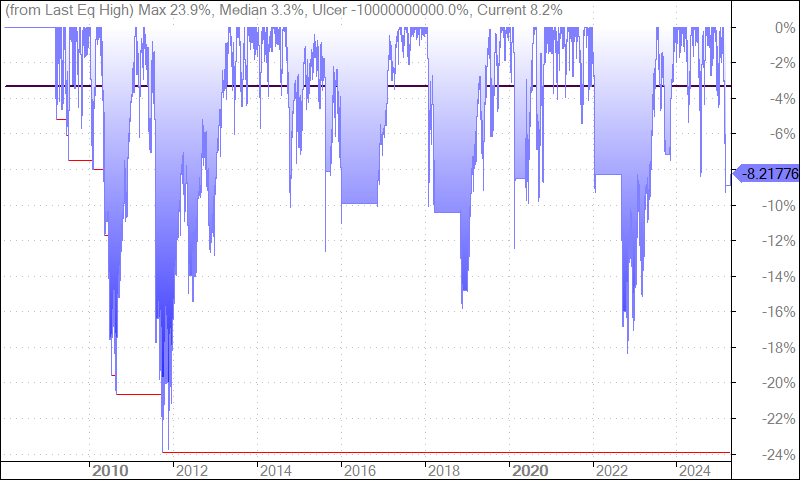
The bottom line shows results for the ZBT Keltner strategy. The Compound Annual Return (CAR) was 9.3%, which beat the buy-and-hold. The Average Drawdown was above 18% because of two deep drawdowns in 2010 and 2011, which was a period with extreme volatility. Kind of like now! There were 17 trades and the Win Rate was an impressive 70.59%.
Keep an Eye on the Exit
The Zweig Breadth Thrust is a robust indicator that signals a sudden shift in participation. More often than not, this shift marks the start of an extended advance. As with a rocket launch, the key is to get escape velocity and there is no turning back. A strong lift off continues higher, while a failed launch makes a u-turn and heads back to earth. The Zweig Breadth Thrust provides the lift off signal and we must then turn to price to monitor follow through. The low prior to the Zweig Breadth Thrust should hold and/or price should not move below the lower like the Kelter Channel for more than five days.
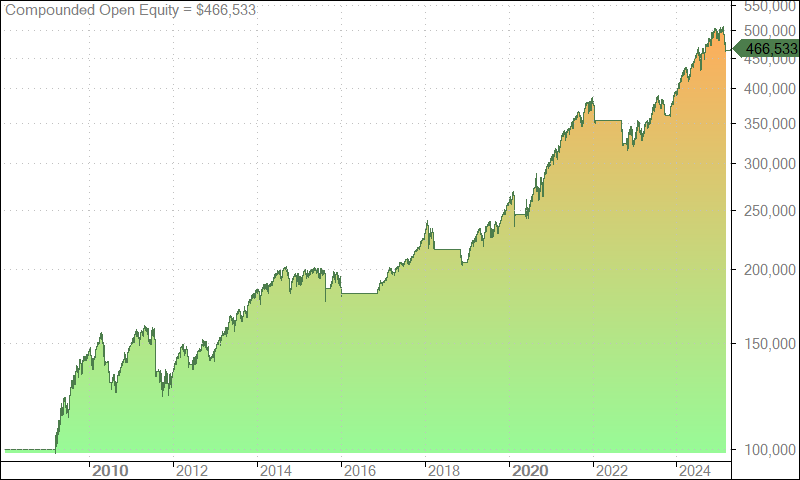
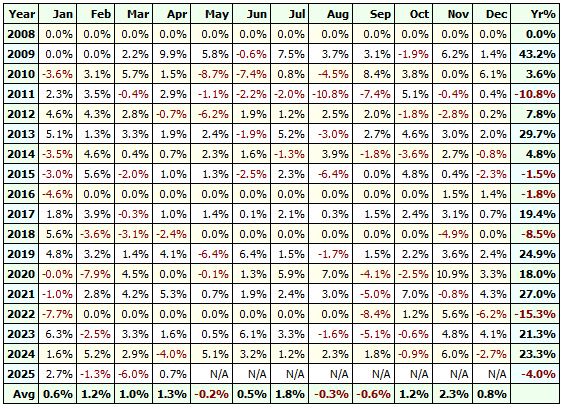
Performance Charts
Below are some backtest charts from Amibroker. These include signals list, the equity curve (green line), the drawdowns (blue) and the monthly/yearly profit table.