Systematic Strategies and Next Level Technical Analysis
QQQ-MAGS Hold Strong – 10yr Yield Challenges Resistance – Housing Moment of Truth
Arthur Hill, CMT
Archive
Equity ETFs
Use CRTL+P to Print
Headlines
Weight of the Evidence Remains Bullish
SPY Forms Another Cup-with-handle
QQQ and MAGS Hold Flag Breakouts
XLK Breaks Re-evaluation Level
Communication Services SPDR holds Channel Breakout
XLF and XLI Lead with 52-week Highs
Healthcare Leads Since August
Breakouts Hold for ARTY and SOXX, but Fold for AIQ and SMH
10yr T-Yield Tests Resistance Zone
Housing ETFs Continue to Struggle
Other Chart Setups and Follow Up (ITA, ICLN, IFRA, IYZ)
Holiday Schedule
Note that the NYSE and Nasdaq close early on Christmas Eve and are closed Christmas Day, as well as New Years Day.
NYSE and Nasdaq Schedule:
1PM Close – Wednesday – December 24th
Closed – Thursday – December 25th
Closed – Thursday – January 1st
TrendInvestorPro will publish reports with videos on the following days:
Monday – December 22nd
Tuesday – December 23rd
Tuesday – December 30th
The normal publishing schedule resumes on Tuesday, January 6th
Wishing you and yours a very Merry Christmas!
Evidence Remains Bullish
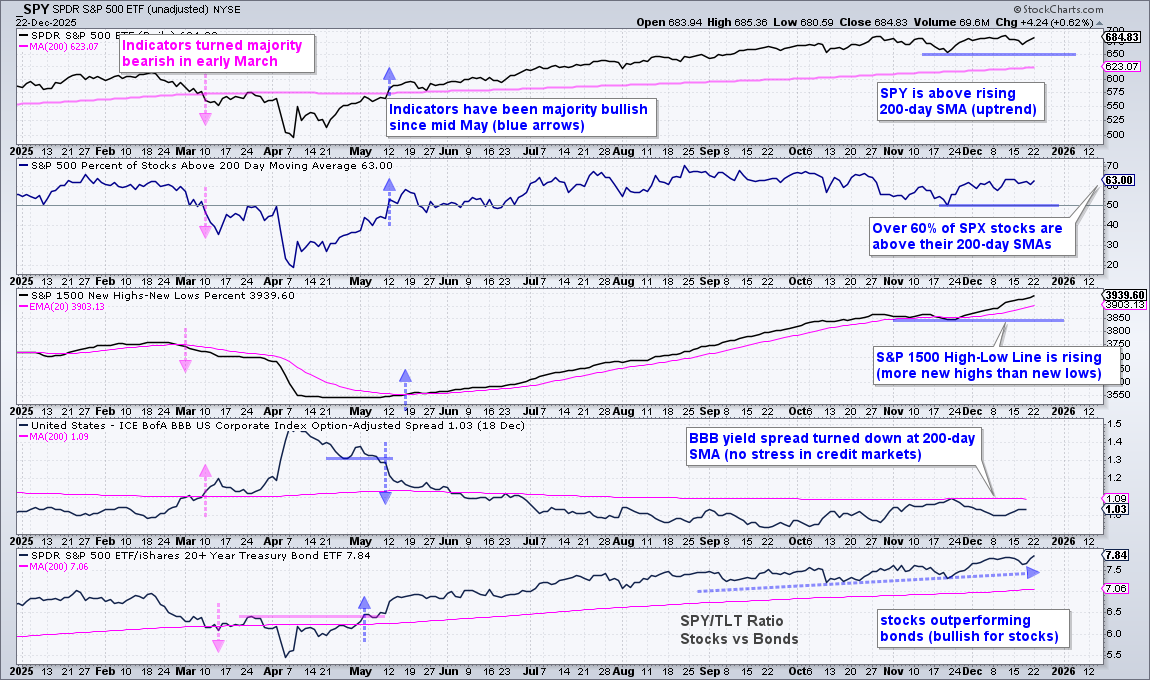
The weight of the evidence remains bullish for stocks. SPY is trading very close to a new high and remains well above the rising 200-day SMA. 63% of S&P 500 stocks are also above their 200-day SMAs, which means the vast majority are in long-term uptrends. New highs within the S&P 1500 continued to outpace new lows as the S&P 1500 High-Low Line rose throughout December.
The credit markets show no signs of stress as the BBB yield spread turned down at the 200-day SMA in late November and moved lower into December. This spread narrowed, which is a sign of confidence. In the bottom window, the SPY/TLT ratio is trending higher as stocks (risk assets) continued to outperform bonds (safe-haven assets).
SPY Forms Another Cup-with-handle
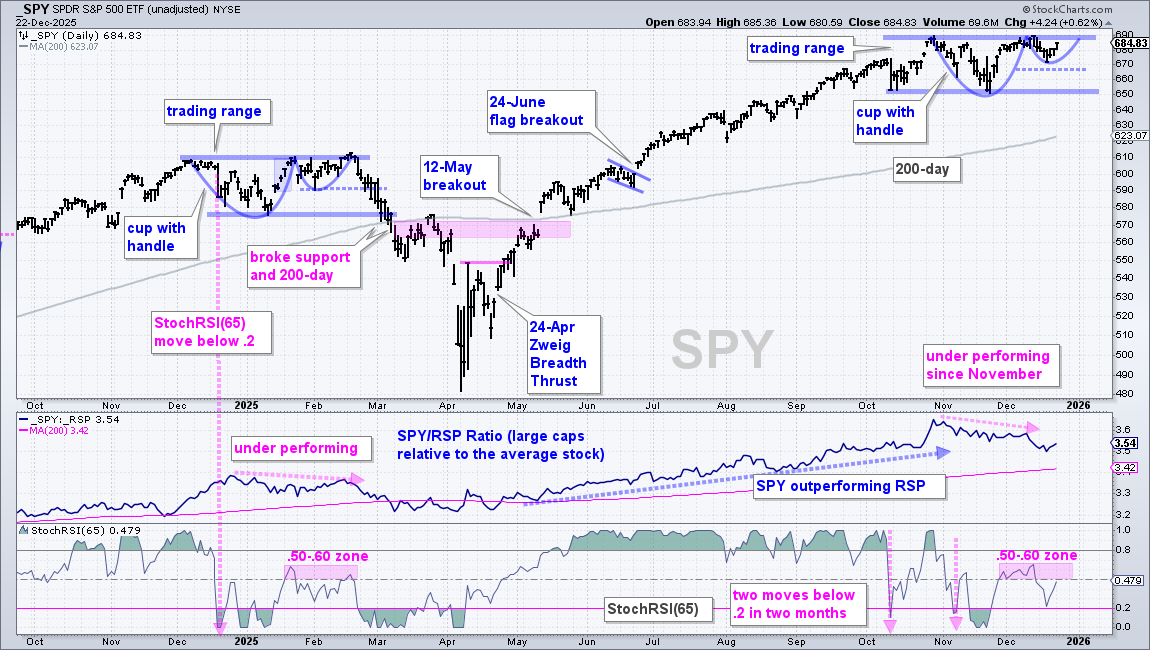
The next chart shows SPY trending higher from mid May to October and then trading range bound since late October. The thick blue lines mark the consolidation zone with support at 650. Within this consolidation, we can see a cup-with-handle forming (blue arcs). These are bullish continuation patterns that mark a consolidation within the uptrend. A break above resistance would confirm this pattern and signal a continuation higher. The handle low and a buffer mark first support at 665 (dashed line). A break here would negate the cup with handle and show the first sign of weakness. Now compare this setup with February 2025. The similarities are uncanny.
The middle window shows SPY underperforming the S&P 500 EW ETF (RSP) since November. However, SPY is still outperforming long-term because the price-relative (SPY/RSP ratio) remains above its rising 200-day SMA. The lower window shows StochRSI(65) plunging below .20 in October-November to signal a downward momentum thrust. The indicator rebounded to the .50-.60 zone (pink shading), and has yet to fully recover. StochRSI exhibited similar price action in February. For now, the bulls remain in charge on the price chart with 665 marking the first level to watch.
QQQ and MAGS Hold Flag Breakouts
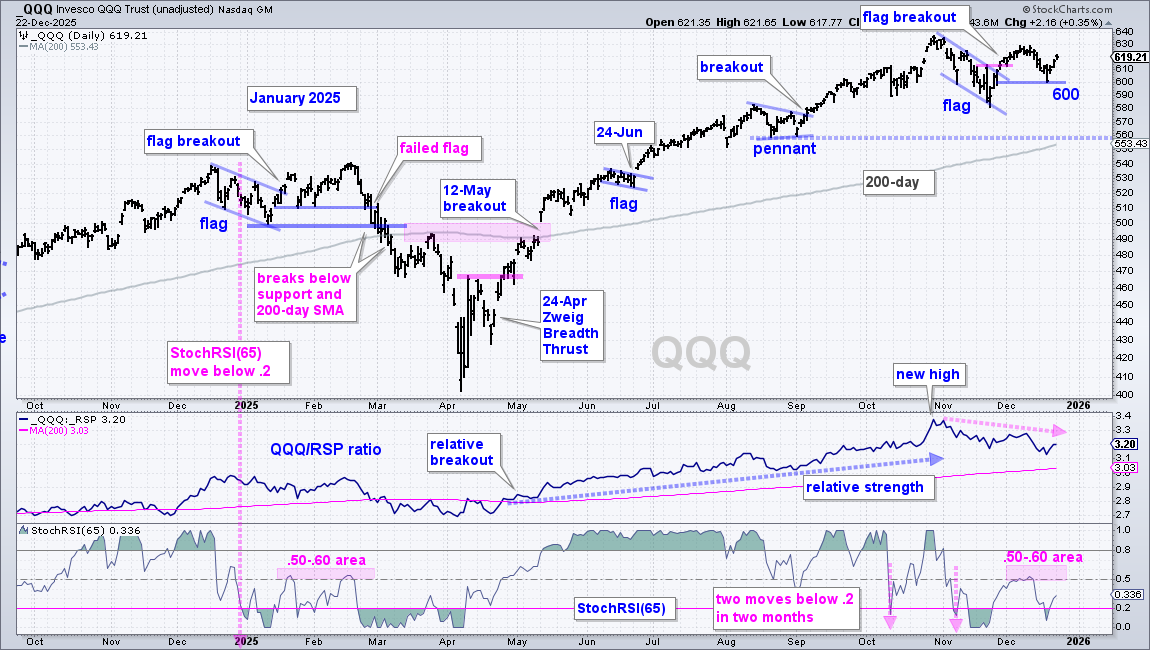
QQQ remains in a long-term uptrend with a new high in October and price well above the rising 200-day SMA. In the middle window, the price-relative (QQQ/RSP ratio) is also in an uptrend as QQQ shows long-term relative strength. QQQ, however, is lagging since November because the price-relative fell the last seven weeks and the ETF formed a lower high on the price chart.
Short-term, QQQ corrected with a falling flag in November and broke out with a surge Thanksgiving weeks. The ETF extended to 630 and then fell back in mid December with a test of the flag breakout (600 area). This test proved successful as QQQ rebounded the last three days. Thus, the flag breakout is holding and bullish. A break below 600 would negate the flag breakout and argue for a deeper correction, perhaps towards the August lows and 200-day SMAs (~560).
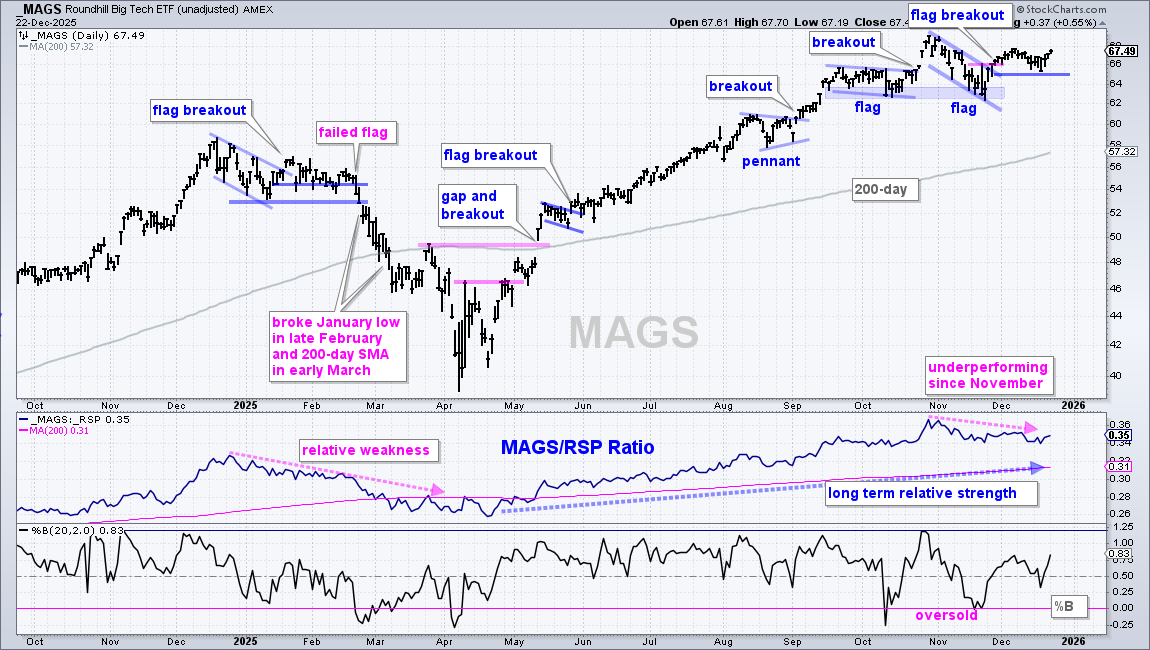
The next chart shows the Mag7 ETF (MAGS) with a falling flag in November and a flag breakout in late November. There was not much follow through after the flag breakout, but the breakout is holding and bullish until proven otherwise. A close below 65 would negate the flag breakout and argue for a deeper correction.
XLK Breaks Re-evaluation Level
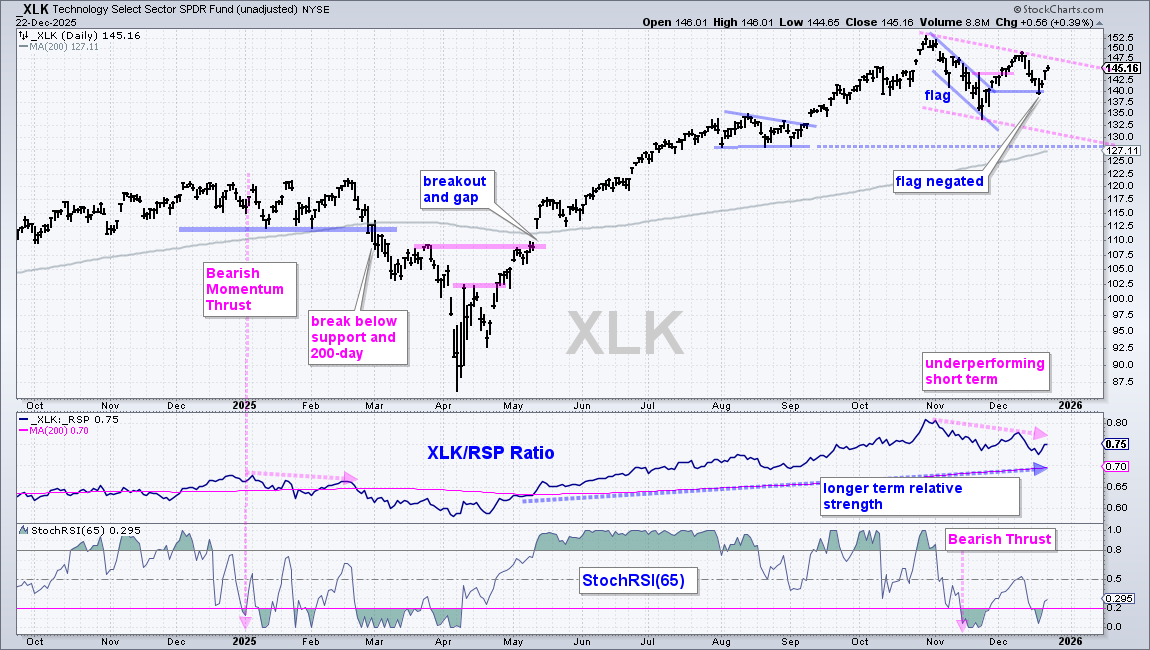
The Technology SPDR (XLK) broke my re-evaluation level at 140 with a sharp decline into Wednesday, December 17th. XLK immediately rebounded with a move above 145 the last three days. Perhaps this was an overshoot, but my re-evaluation was broken with the close below 140. This means XLK is in correction mode with the pink dashed lines defining this correction. A lower line extends towards the August low and rising 200-day SMA for a downside target in the 128 area
SPY, QQQ, MAGS and XLK hold the key for large-caps and large-cap tech stocks. So far, three of these four ETFs are holding their short-term support levels (SPY, QQQ, MAGS). Watch these three for clues. Short-term support breaks in two or more would argue for a deeper correction.
Communication Services SPDR holds Channel Breakout
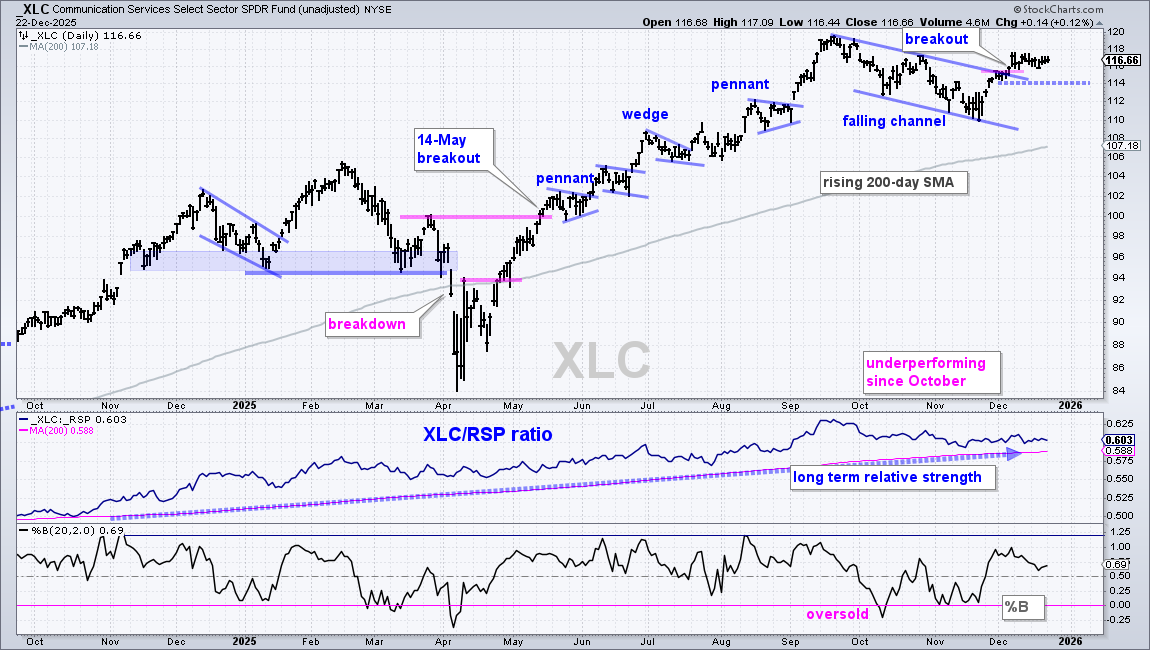
The next chart shows the Communication Services SPDR (XLC) with a falling channel correction and a breakout in the 115 area. XLC stalled after this breakout, but the breakout is holding and bullish until proven otherwise. A close below 114 would negate the breakout. Top holdings in XLC include: META (19.88%), GOOGL (18.98%), NFLX (5.54%), CMCSA (4.81%) and DIS (4.58%). These weightings do not make much sense because Alphabet (GOOGL) has a much larger market cap ($3.75 trillion) than META ($1.67 trillion). Perhaps there will be a re-alignment early next year.
XLF and XLI Lead with 52-week Highs
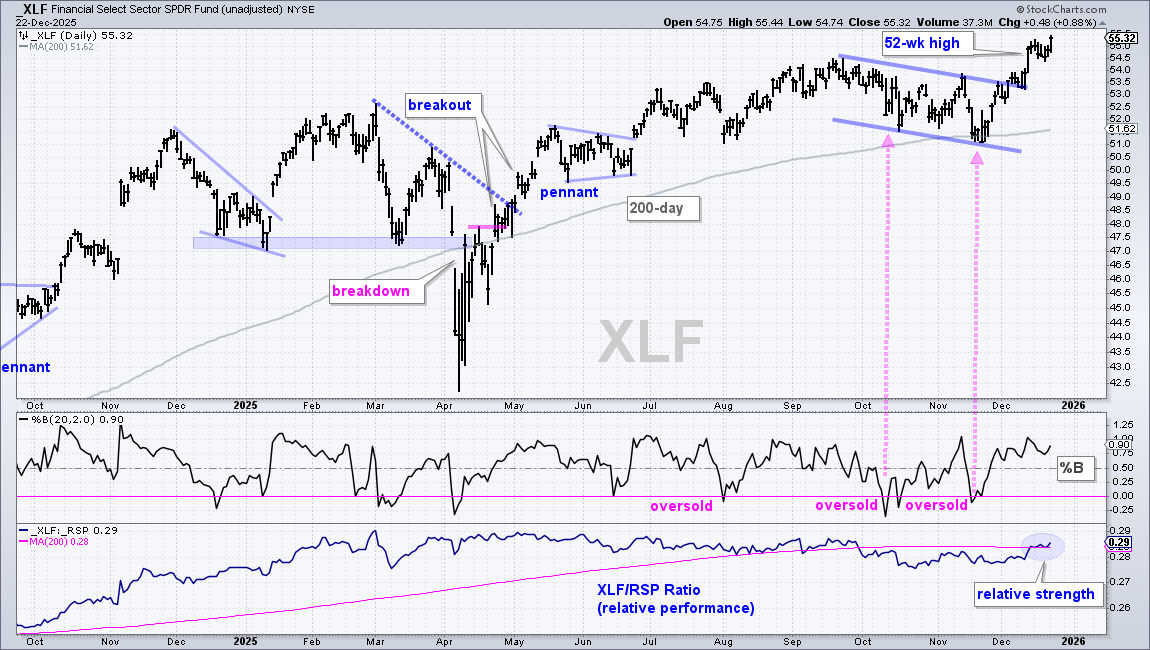
The next chart shows the Finance SPDR (XLF) hitting a new high in September, correcting into November and breaking out to new highs in December. Even though XLF was underperforming in October-November and even broke its 200-day SMA in late November, it grabbed the lead in December with an 8% surge off the November low. As an aside, note that 82.67% of XLF stocks (!GT200XLF) are above their 200-day EMAs. This is the highest of any sector.
Hindsight is 20/20, but we can take four lessons from this chart. First, the 200-day SMA should be treated as a zone, not a specific level. XLF hit the 200-day SMA and firmed in this zone before moving higher. Second, the long-term trend was up because XLF recorded a 52-week high on September 19th and was just 6% below this high in late November. Third, %B became oversold in October-November to offer chances to trade the pullback. And finally, we are in a bull market and this means positive outcomes are more likely than negative outcomes.
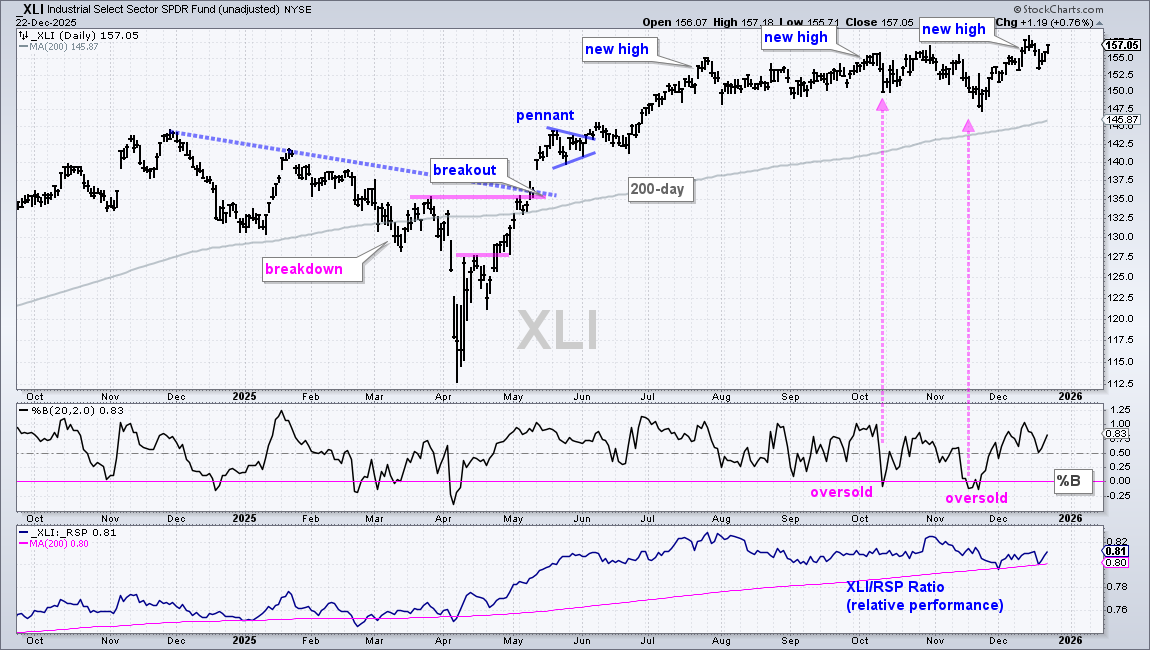
The next chart shows the Industrials SPDR (XLI) with new highs in June, July, October and December. Price is also well above the rising 200-day SMA. Trading since late July has been extremely choppy because this is a very diverse sector, just like Finance. Nevertheless, the long-term trend was always up and the oversold conditions offered opportunities (pink arrows).
Healthcare Leads Since August
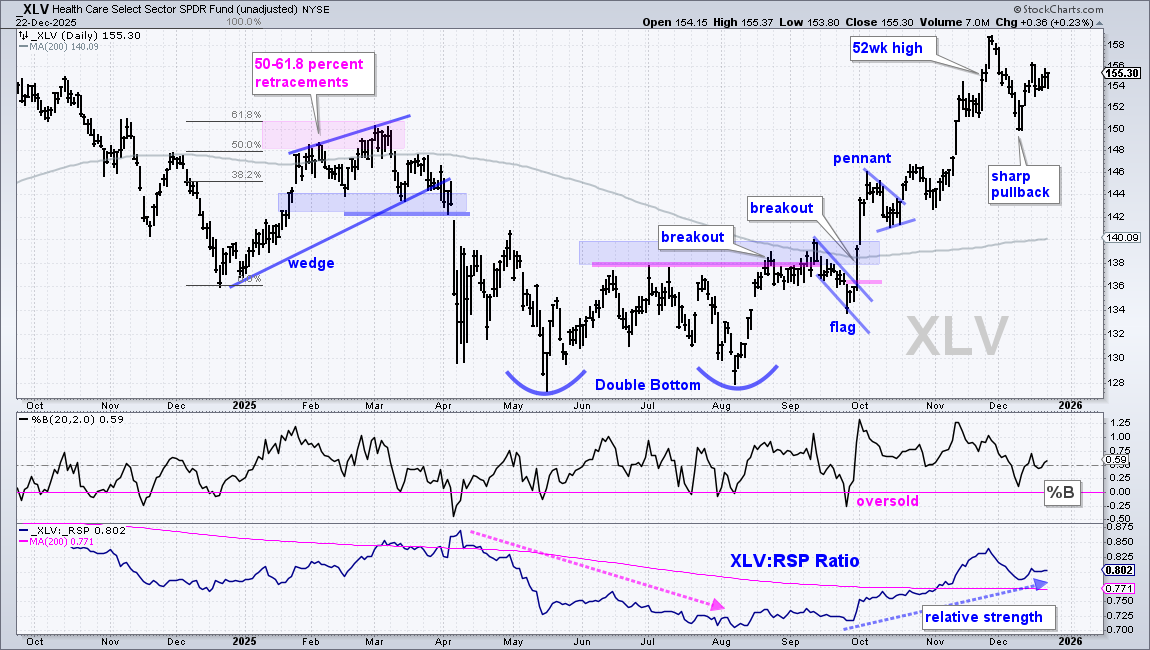
The Healthcare SPDR (XLV) is on a tear since August with a 19% gain over the last 100 days. In fact, XLV is the leading sector over this timeframe. XLK and XLY are a distant second with 10.50% gains. The chart shows XLV with a Double Bottom breakout in late August and new highs in November. There was a hard and sharp pullback into early December and then a rebound the last two weeks. I do not see a setup on this chart, just a leading uptrend.
The six biggest sectors in the S&P 500 account for a whopping 86.64% of the S&P 500 – and these six are still in long-term uptrends. The Industrials SPDR (XLI), Finance SPDR (XLF) and Consumer Discretionary SPDR (XLY) hit new highs in mid December. The Healthcare SPDR (XLV) is the biggest gainer this August. Even though the Technology SPDR (XLK) and Communication Services SPDR (XLC) are lagging since November, they are still in long-term uptrends. Note that the other five sectors account for 13.37% of the S&P 500 (Consumer Staples, Materials, Utilities, REITs and Energy).
Breakouts Hold for ARTY and SOXX, but Fold for AIQ and SMH
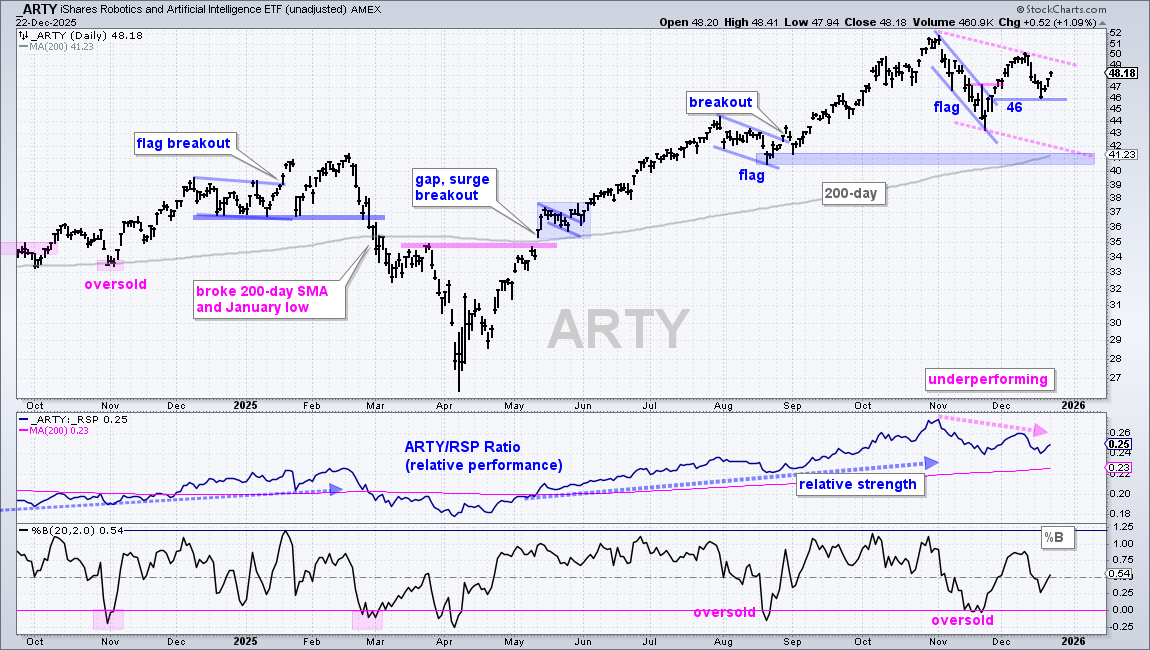
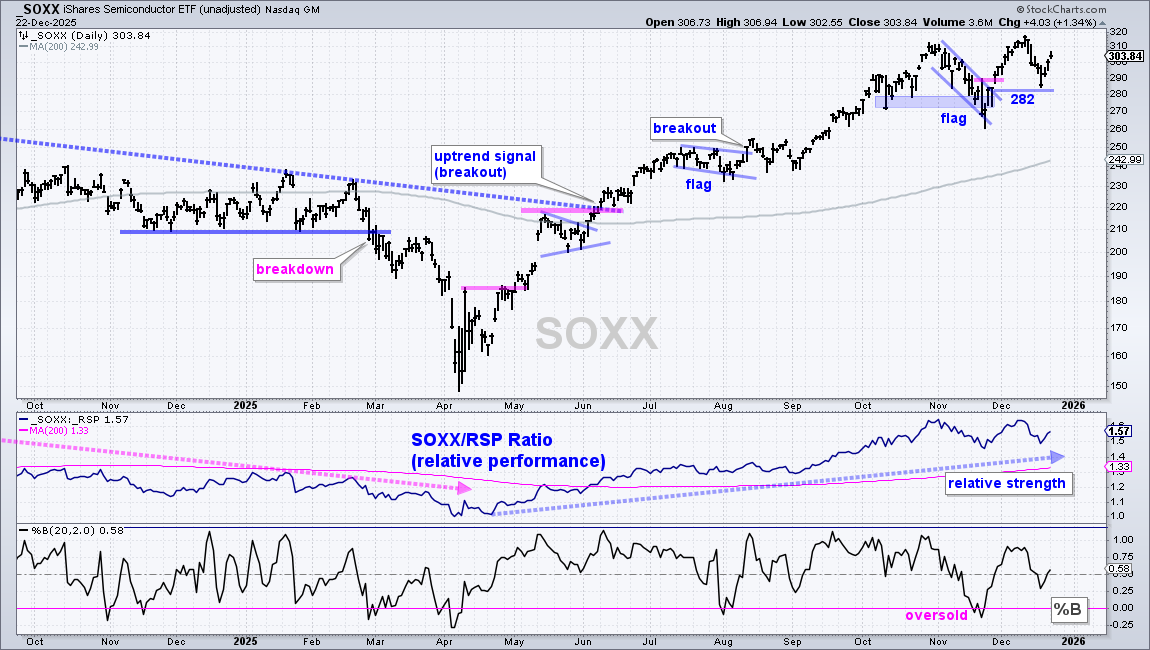
The next charts update the flag breakouts for the Robotics AI ETF (ARTY) and Semiconductor ETF (SOXX). These two did not close below the re-evaluation level (blue lines). Technically, their flag breakouts are still alive. A close below 46 in ARTY would signal a failed flag and target a deeper correction.
For SOXX, a close below 282 would signal a failed flag and target a deeper correction.
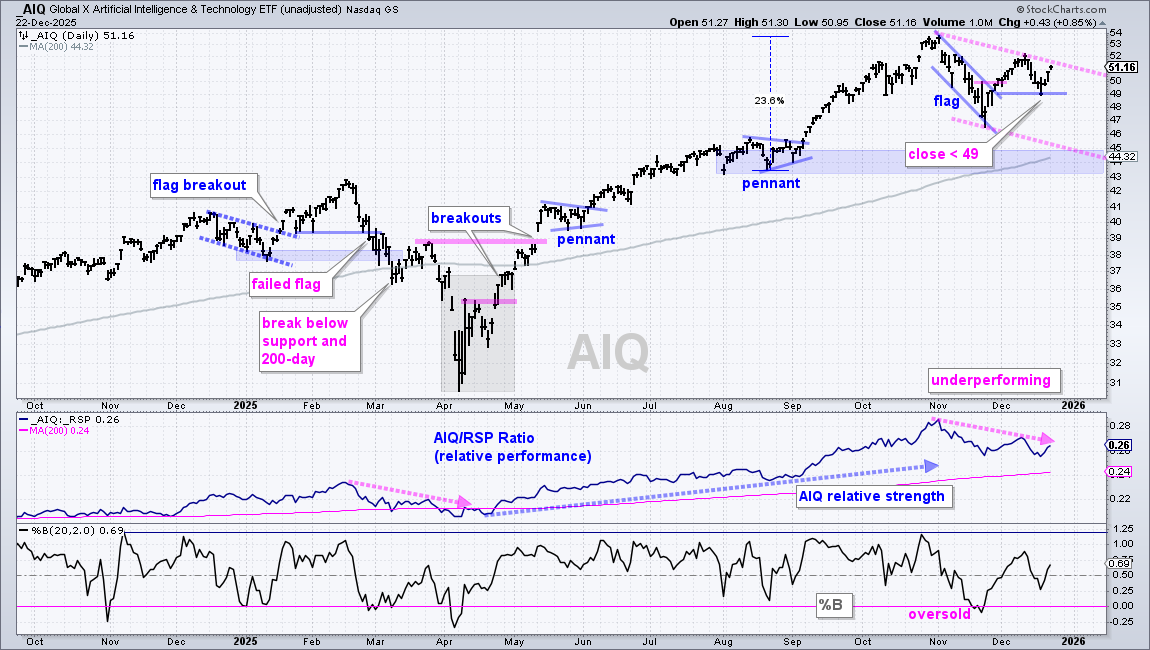
The next chart shows AIQ closing below 49 on December 17th (48.97). This was an 3 cent overshoot, but the level was breached. Notice that AIQ rebounded the very next day. One technique to avoid whipsaws is to set a stop-loss once the re-evaluation level is triggered. For example, put a stop just below the low of the day the stop-loss was triggered. This keeps the trade alive should the ETF rebound the next day.
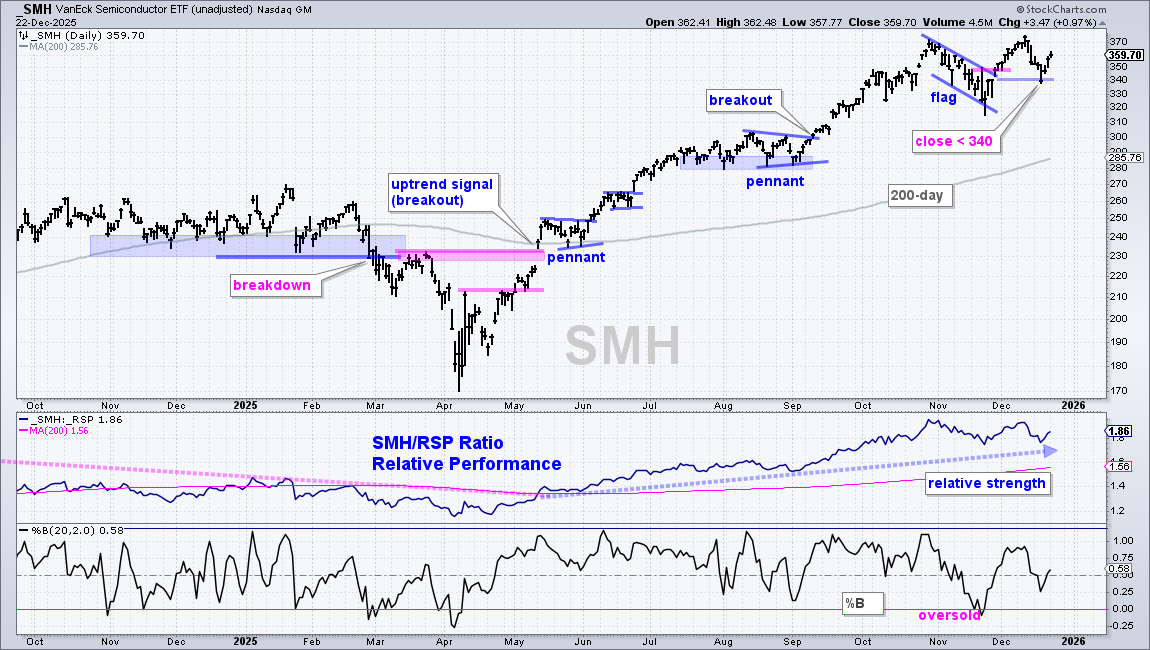
The next chart shows the Semiconductor ETF (SMH) closing below the re-evaluation level at 340 on December 17th, and then rebounding the last three days. As with AIQ, the December 17th decline could be an overshoot because of the immediate rebound. A move below the December 17th low would suggest otherwise and argue for a deeper correction.
10yr T-Yield Tests Resistance Zone
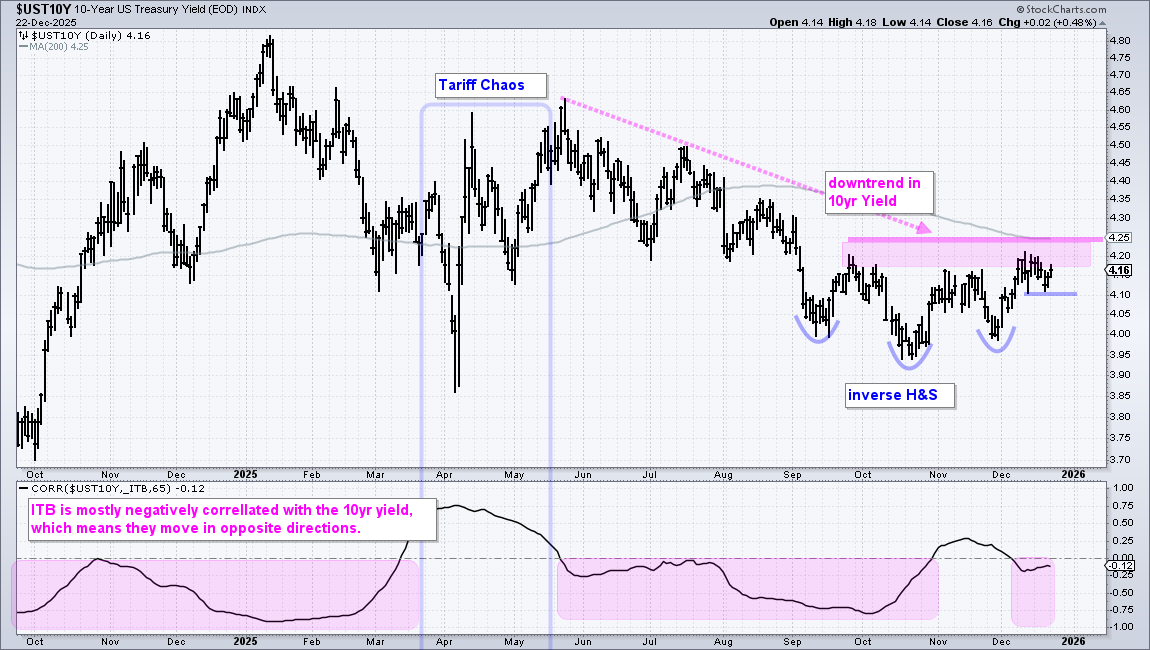
The 10-yr Treasury Yield ($UST10Y) remains in a downtrend with resistance in the 4.10-4.25 percent area. I decided to widen this zone to reduced the chances of whipsaw and change my stance after a decisive breakout. The 10yr yield established resistance with highs f5rom late September to December. There is also the falling 200-day SMA at 4.25%. Thus, a break above neckline resistance at 4.25% would confirm the head-and-shoulders and reverse the downtrend. It has yet to happen, but would be negative for housing and small-caps. A break below 4.10% would reverse the short-term upswing and affirm resistance.
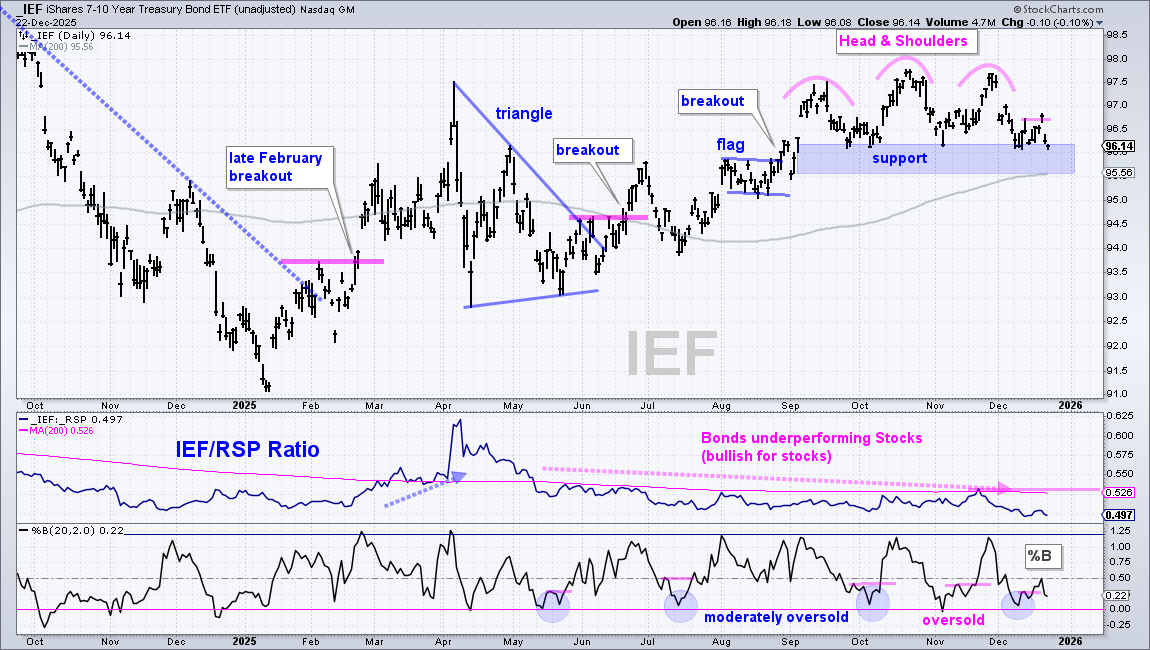
The next chart shows the 7-10Yr TBond ETF (IEF) with a mirror image. In keeping with the logic above, I am marking a support zone in the 95.5-96 area. A break below 95.5 would confirmed the head-and-shoulders pattern and reverse the uptrend.
Housing ETFs Continue to Struggle
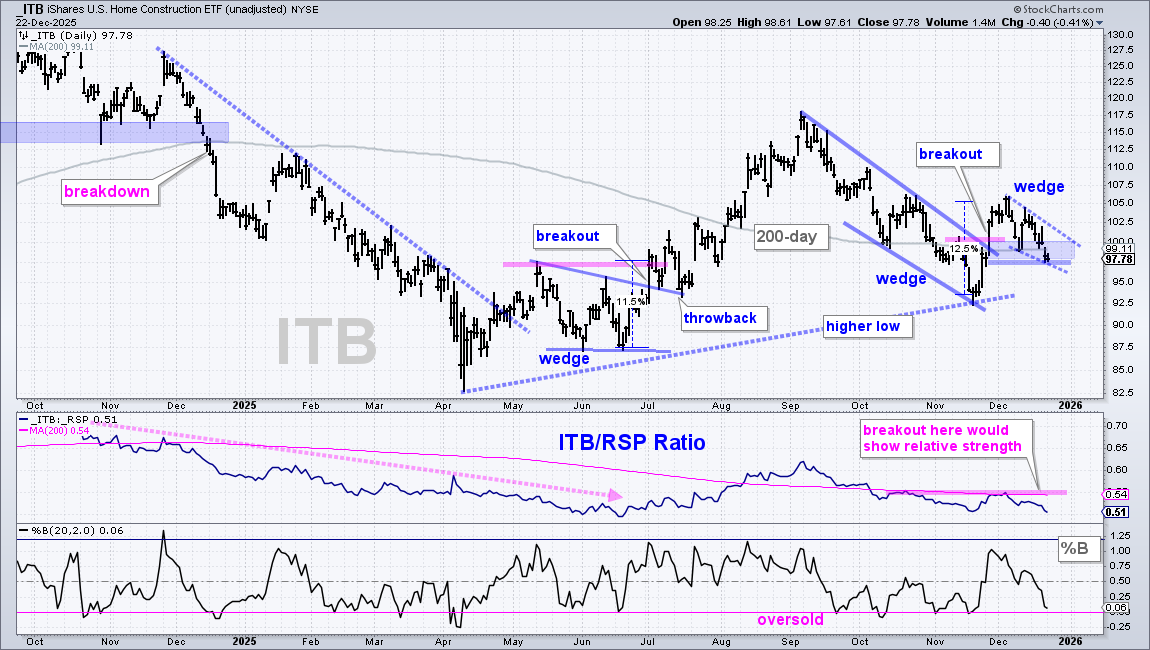
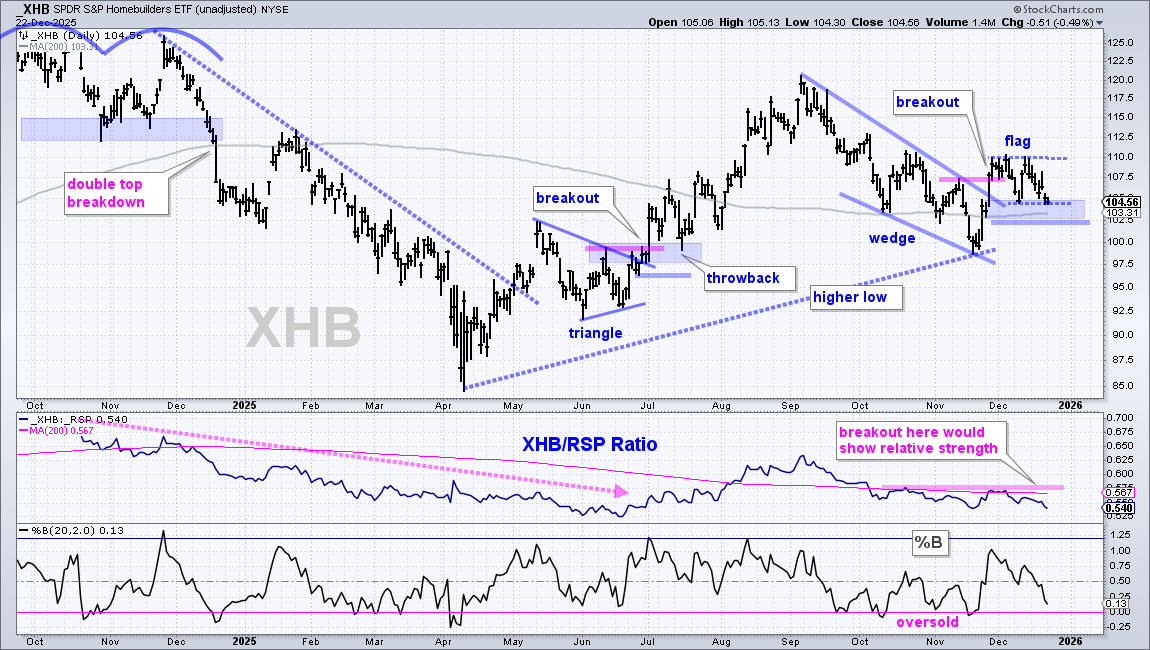
The Home Construction ETF (ITB) broke out in late November with a 12.5% surge. It looked like a strong breakout, but then the 10yr Yield surged from 4 to 4.2% in early December. As a result, ITB fell back to the breakout zone and 200-day SMA with a small falling wedge. The ETF is also trading just above my re-evaluation level at 97. A close below 97 would negate the late November breakout. With the breakout still alive, watch for a reversal here and break above the wedge line at 102.5 to revive the November breakout. And watch the 10yr yield for clues.
The next chart shows the Homebuilders ETF (XHB) with similar characteristics.
Other Chart Setups and Follow Up (ITA, ICLN, IFRA, IYZ)
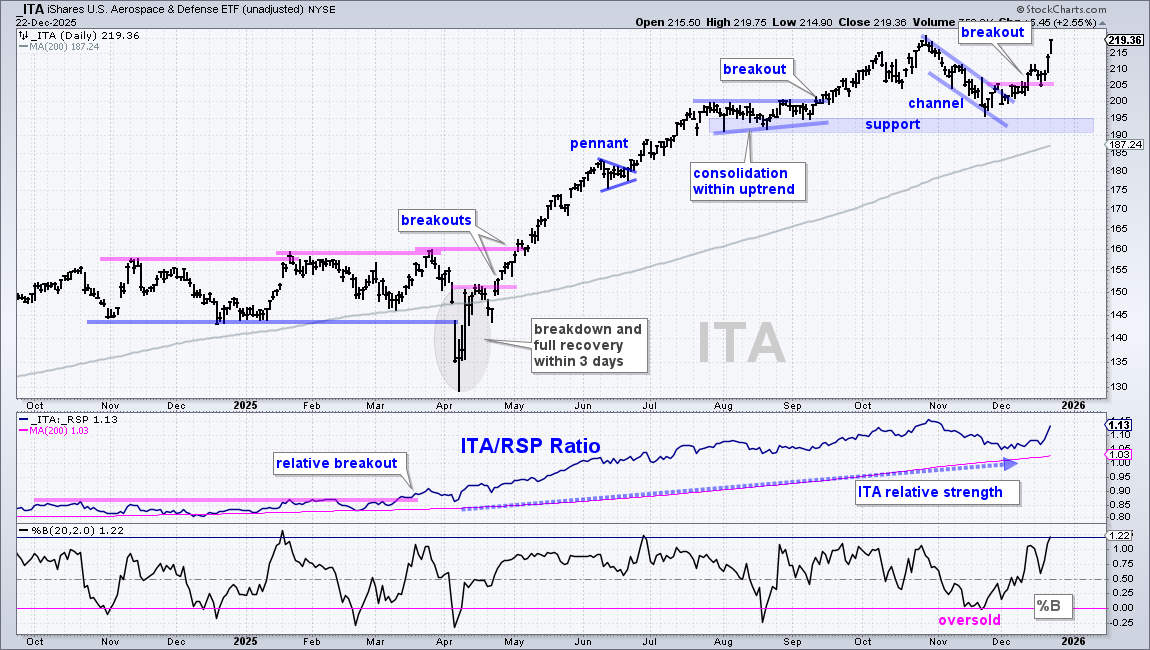
The Aerospace & Defense ETF (ITA) extended on its channel breakout with a surge to the October high.
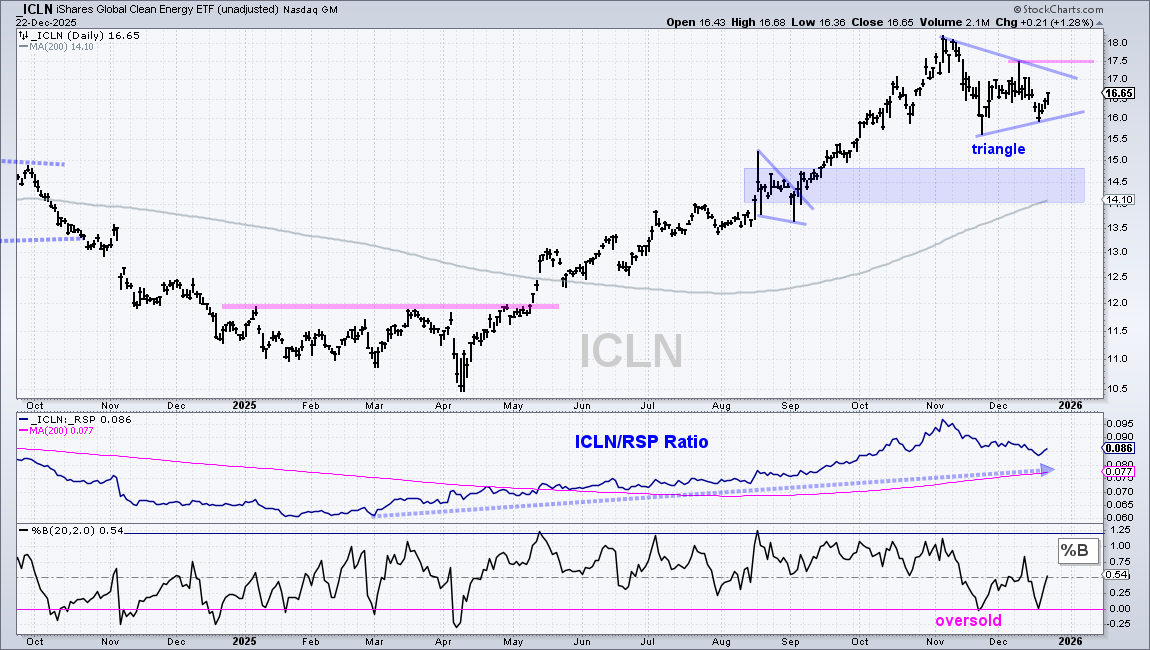
The Global Clean Energy ETF (ICLN) fell sharply on December 17th, but rebounded the last three days. The long-term trend is still up and ICLN remains a long-term leader. %B touched the zero line last week to become oversold. On the price chart, ICLN formed a low at 16 and a triangle is taking shape. This is a consolidation within an uptrend, which makes it a bullish continuation pattern. A close below the December 17th low would call for a re-evaluation.
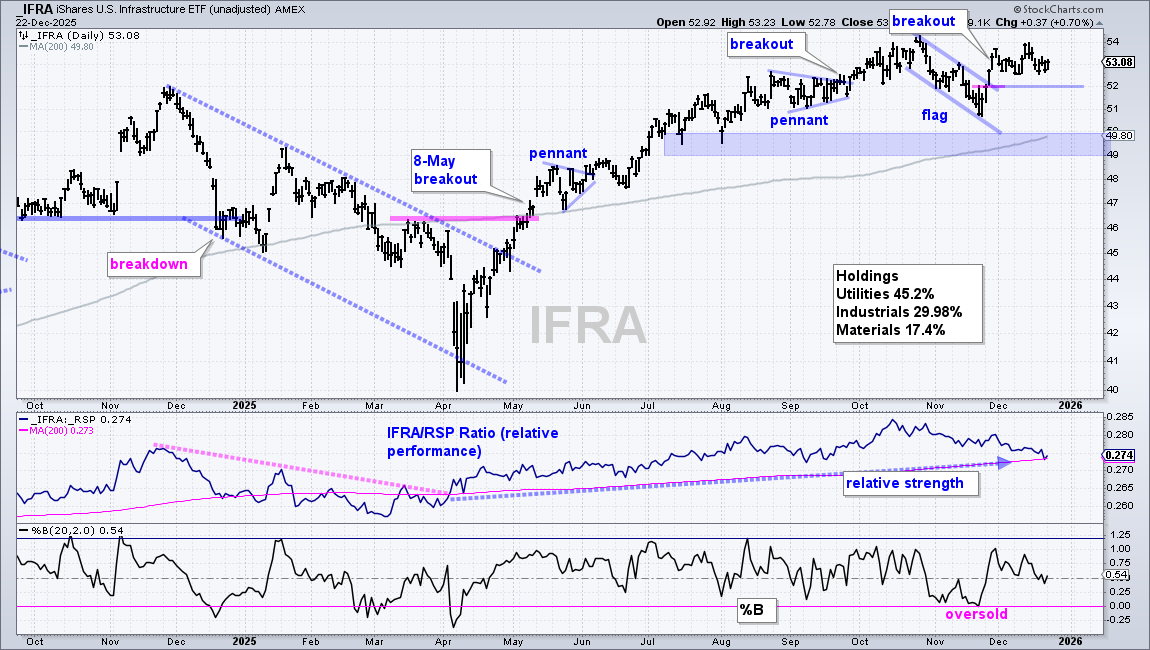
The Infrastructure ETF (IFRA) is holding its flag breakout as it consolidates in the 53 area.
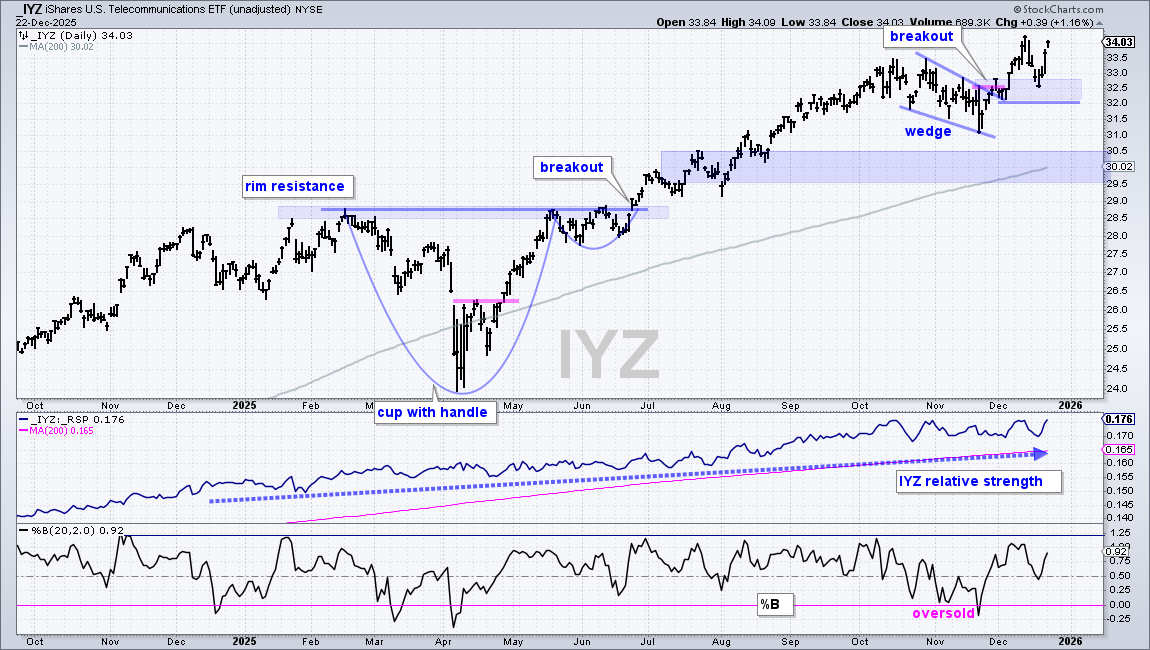
The Telecom ETF (IYZ) successfully tested the wedge breakout zone with a throwback to the 32.5 area last week and surge back to 34.
DISCLAIMER: This content provided strictly for informational and educational purposes. It should not be interpreted as an offer to buy or sell any security, nor as a solicitation to engage in any investment activity. Nothing here constitutes a recommendation regarding any specific security, portfolio, transaction, or investment strategy.
At times, the author or affiliates may hold positions or interests in securities discussed. Any stocks or examples mentioned are not endorsements or suggestions to purchase. This material does not consider your individual financial goals or circumstances, and you should seek guidance from a qualified financial or investment adviser before making any trading or investment decisions.
Past performance does not guarantee future results.
Send feedback to support(at)trendinvestorpro.com or use the contact form.