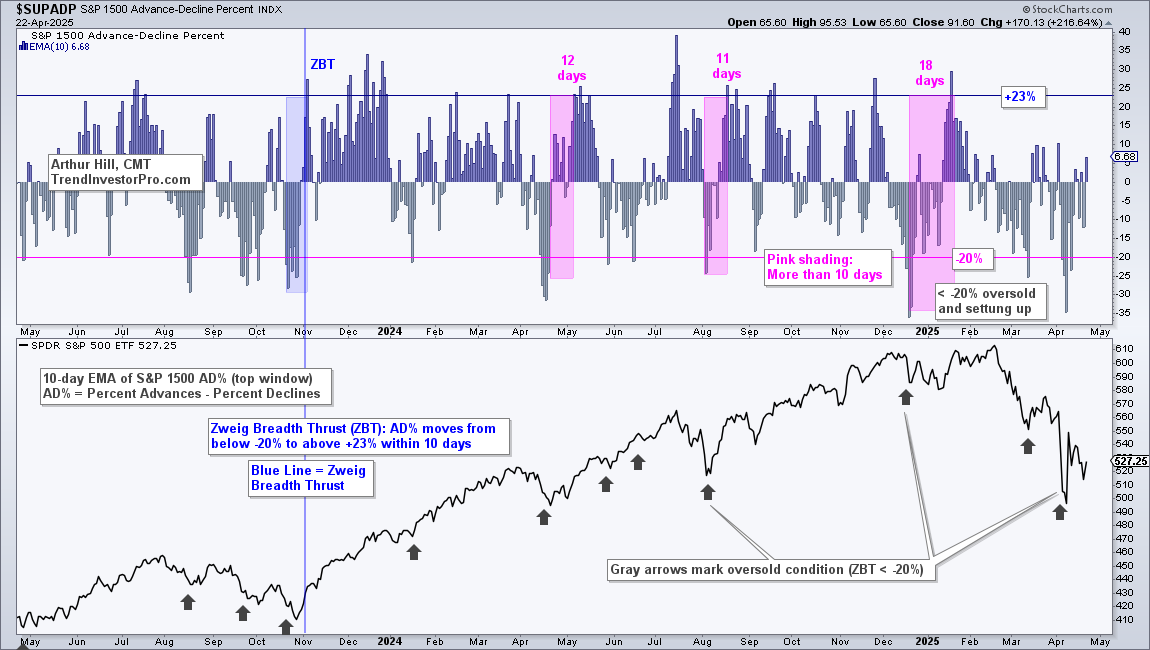
The next chart shows the S&P 1500 ZBT indicator setting up and becoming oversold with moves below -20% on April 4th, 7th, 8th and 10th. This is a classic case of becoming oversold and remaining oversold. A move above +23% by April 25th (Friday) would trigger a bullish Zweig Breadth Thrust for the S&P 1500.
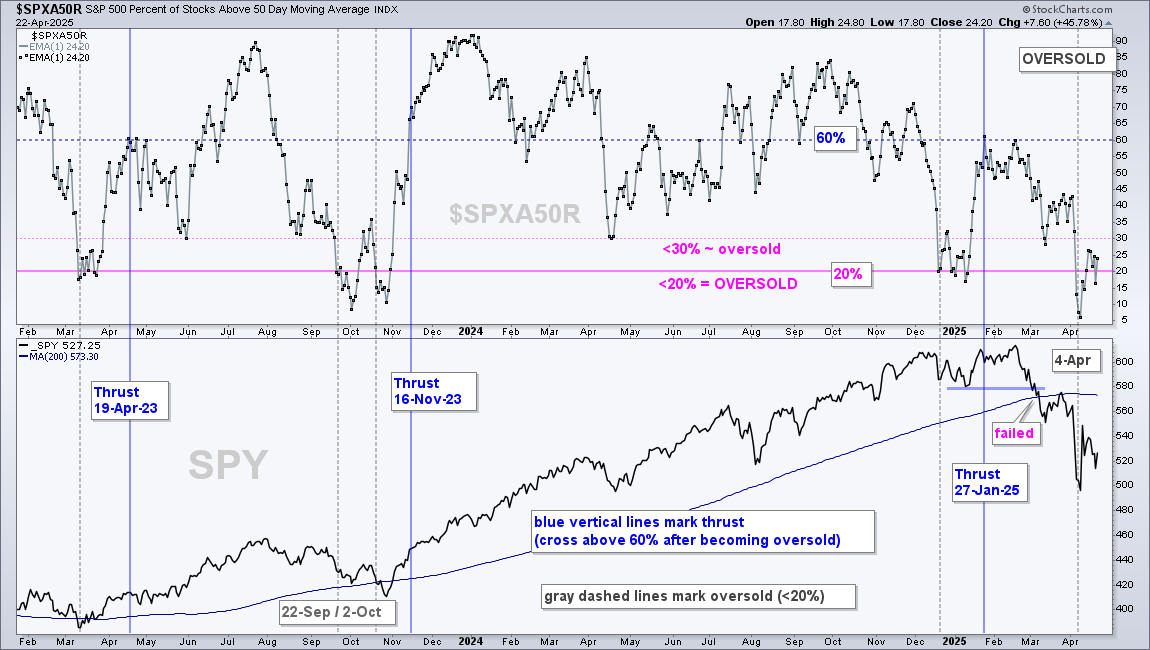
Percent above 50-day Gets Oversold Bounce
The next chart shows S&P 500 Percent Above 50-day SMA ($SPXA50R) moving below 20% to become oversold on April 4th, and staying oversold on April 7th and 8th. SPY then surged some 10% on April 9th. The indicator fell back below 20% on Monday and we got an oversold bounce on Tuesday. SPY is currently in the midst of an oversold bounce that could return to the March lows (550-560 area). So far, the indicator is short of a bullish thrust, which would require a move above 60%. See the blue lines for prior signals.
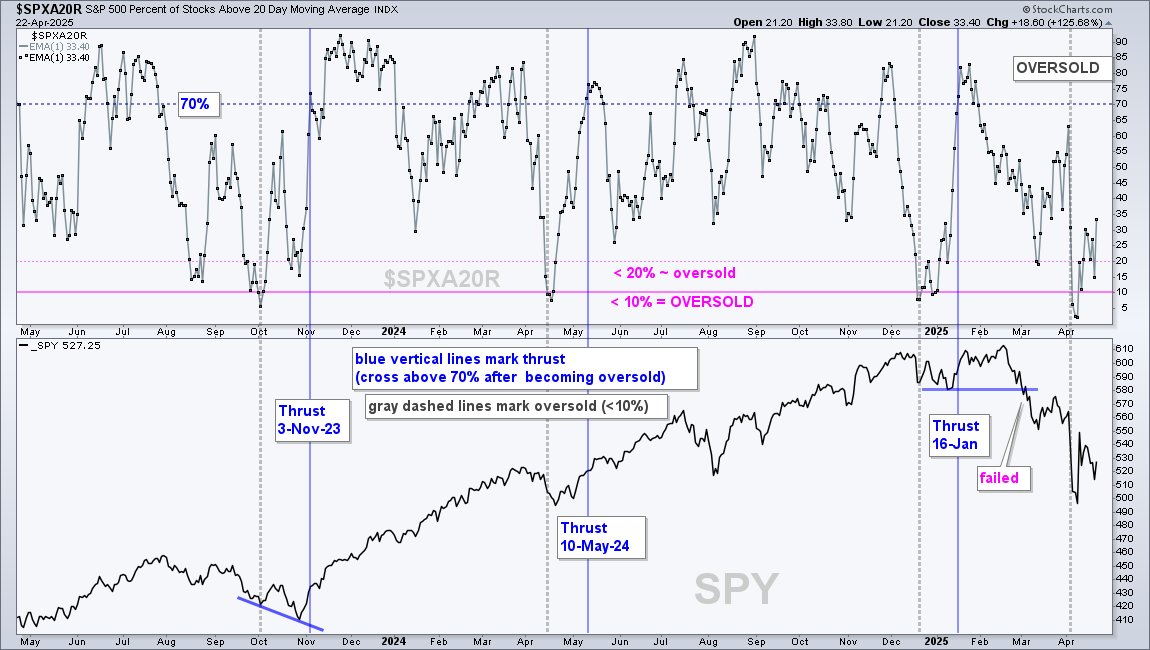
Percent above 20-day Gets Oversold Bounce
The next chart shows S&P 500 Percent Above 20-day SMA ($SPXA20R) becoming oversold with a move below 10% on April 4th and dipping to 2% on April 8th. SPY then surged some 10% on April 9th. This is just a bear market bounce for now. See August-October 2023 for examples of oversold bounces that failed to generate a thrust signal. Follow through above 70% is needed to trigger a thrust signal.