The market as a whole is not firing on all cylinders, but that is not really important. What, then, is important?
We cannot expect a perfectly bullish stock market and rising tide that lifts all boats, as was the case in 2013 and 2017. Instead, we need to know which cylinders are firing bullish and which are firing bearish. We then need a methodology to count these cylinders and weigh the evidence.
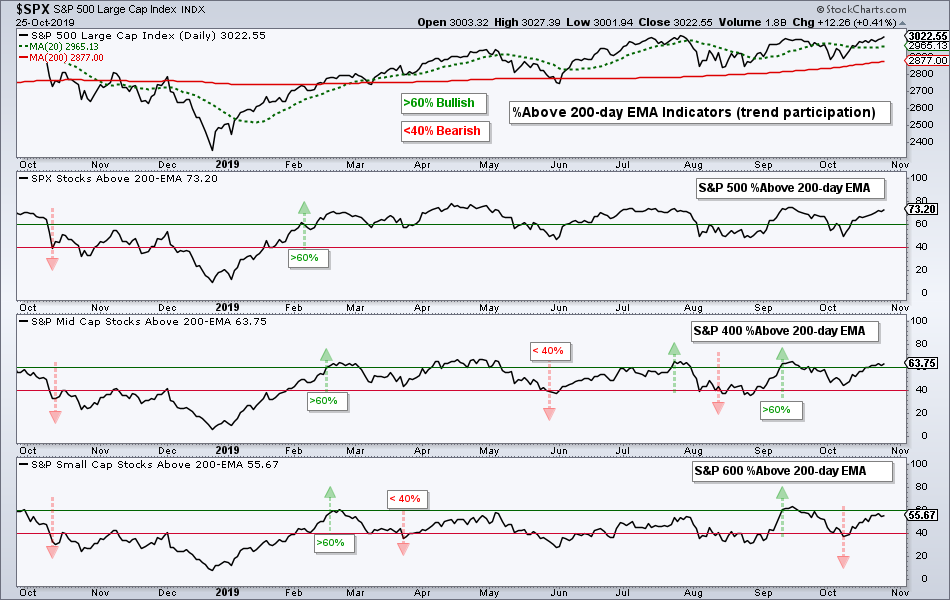
Mr. Market may not be perfect, but Mr. Market is clearly more bullish than bearish when the majority of cylinders are firing bullish. Personally, I use an array of breadth indicators in my Index and Sector Breadth models to objectively weigh the evidence. The chart below shows an example of these indicators. Note that 73% of S&P 500 stocks, 64% of S&P 400 MidCap stocks stocks and 56% of S&P 600 SmallCap stocks are above their 200-day EMAs.

Viewed another way, this chart implies that 27% of $SPX stocks, 36% of $MID stocks and 44% of $SML stocks are below their 200-day EMAs. This evidence is not overwhelmingly bullish, but it is clearly more bullish than bearish.
Small-caps are clearly dragging their feet and mid-caps are not as strong as large-caps. This mixed performance in the broad market is also affecting ETFs because individual stock performance is often mixed within sectors and industry groups. The key is to separate uptrends from downtrends and leaders from laggards.


