
Broad market timing is important because the state of the stock market is the single biggest influence on stocks and stock-based ETFs. The odds are in our favor during bull markets and stacked against us during bear markets. There are also periods of whipsaw when nothing seems to work on a consistent basis, such as now. Even so, we still need a model or indicator(s) to tell us the state of the stock market. There will be extended bull markets and extended uptrends again. For now, however, we must endure the whipsaws.
Today we will dive into the Composite Breadth Model and its five inputs. These are the S&P 500 Trend and Thrust Models, the S&P 1500 Trend and Thrust Models and the 5/200 cross for the S&P 500. I will cover the indicators for each model and then test the individual models. The Composite Breadth Model held up pretty good during these tests, but the S&P 1500 Thrust Model performed surprisingly well. Even so, it may not be the best model for differentiating between bull and bear markets.
Breadth models measure the weight of the evidence for the stock market. The CBM has five inputs and these inputs are based on fifteen indicators. Breadth indicators measure the degree of participation. The more stocks that participate in a move, the more likely the move is sustainable. That, at least, is the theory.
Trend Model Indicators
There are five indicators in each trend model. First, there are three %Above SMA indicators to quantify trend participation for three different timeframes. To keep it logical, the bullish/bearish thresholds scale at equal intervals (10 percent increments) as the moving average periods lengthen.
%Above 200-day SMA measures long-term trend participation. It turns bullish with a cross above 60% and bearish with a cross below 40%.
%Above 150-day SMA measures medium-to-long term trend participation. It turns bullish with a cross above 70% and bearish with a cross below 30%.
%Above 100-day SMA measures medium-term trend participation. It turns bullish with a cross above 80% and bearish with a cross below 20%.
High-Low% is the percentage of new highs less the percentage of new lows. This indicator measures strong uptrends (new highs) relative to strong downtrends (new lows). This indicator triggers bullish with a cross above +10% and bearish with a cross below -10%.
The 10-day EMA of AD% identifies participation thrusts, both up and down. AD% is the percentage of advancing stocks less the percentage of declining stocks. A participation thrust occurs when we see a high percentage of stocks moving in one direction over a relatively short period of time. The indicator triggers bullish with a cross above +30% and bearish with a cross below -30%.
Trend Model Signals
The trend models are bullish (positive) when at least three of the five indicators are bullish. The models are bearish (negative) when the majority of indicators are bearish (at least 3). The chart shows the S&P 500 Trend Model Signals with the red and green arrows in the top window. The individual indicators are in the lower windows. Most recently, we can see SPX $Above 200-day SMA and SPX %Above 150-day SMA turning bullish (green arrows) in late November. SPX %Above 100-day SMA turned bullish at the end of January.
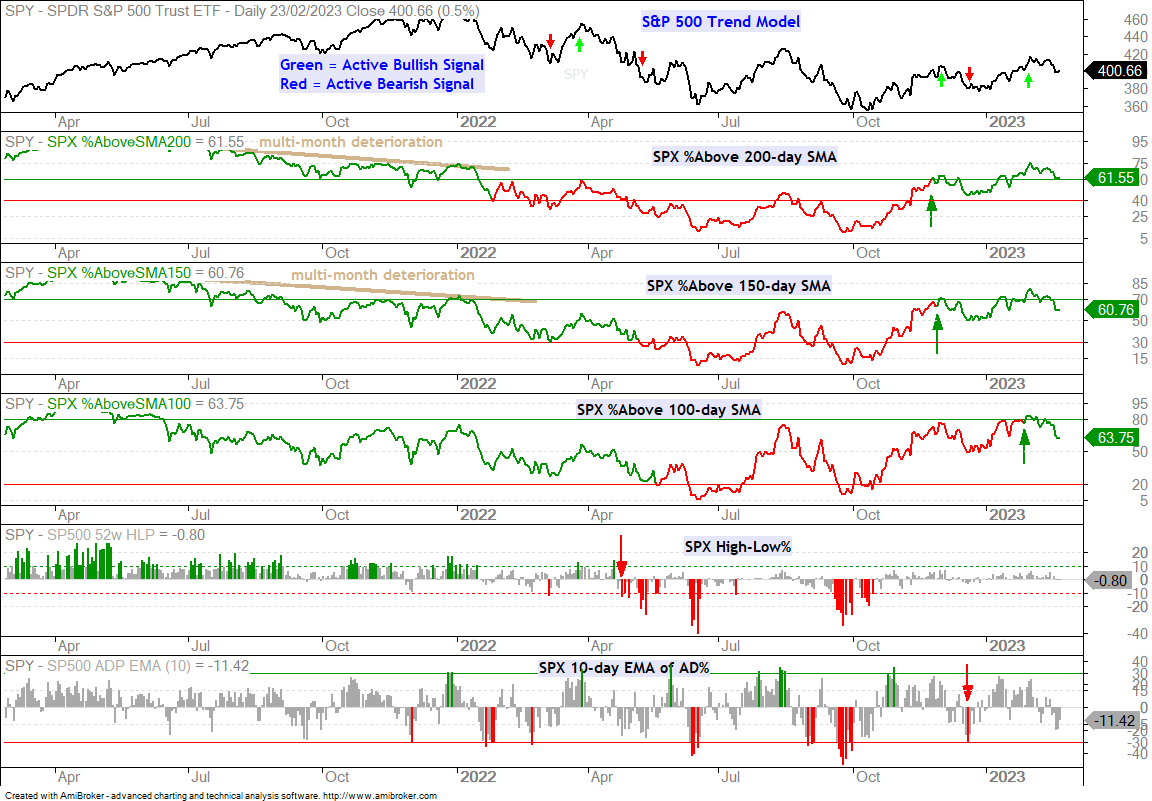
In the lower window, SPX High-Low Percent turned bearish in late April with a move below -10% and has yet to reverse this signal. Despite a big advance in stocks from October to January, we have yet to see a material expansion in new highs. The bottom window shows the 10-day EMA of SPX AD% exceeding -30% on December 19th and turning bearish. It has yet to reverse this signal with a thrust above +30%.
Thrust Model Indicators
The thrust models have three indicators. Two measure short-term participation using the percentage of stocks above the 50 and 20 day SMAs. The third is the 10-day EMA of AD%, which is also used in the trend models.
%Above 50-day SMA measures short-term trend participation. It turns bullish with a cross above 85% and bearish with a cross below 15%.
%Above 20-day SMA measures short-term trend participation. It turns bullish with a cross above 90% and bearish with a cross below 10%.
Thrust Model Signals
The chart below shows SPY with the S&P 1500 Thrust Model signals in the top window (green/red arrows). The model turns bullish (positive) when two of the three indicators are bullish and bearish (negative) when the majority of indicators are bearish. This model turned bearish (negative) on December 1st, 2021. There was a whipsaw in August-September (yellow shading).
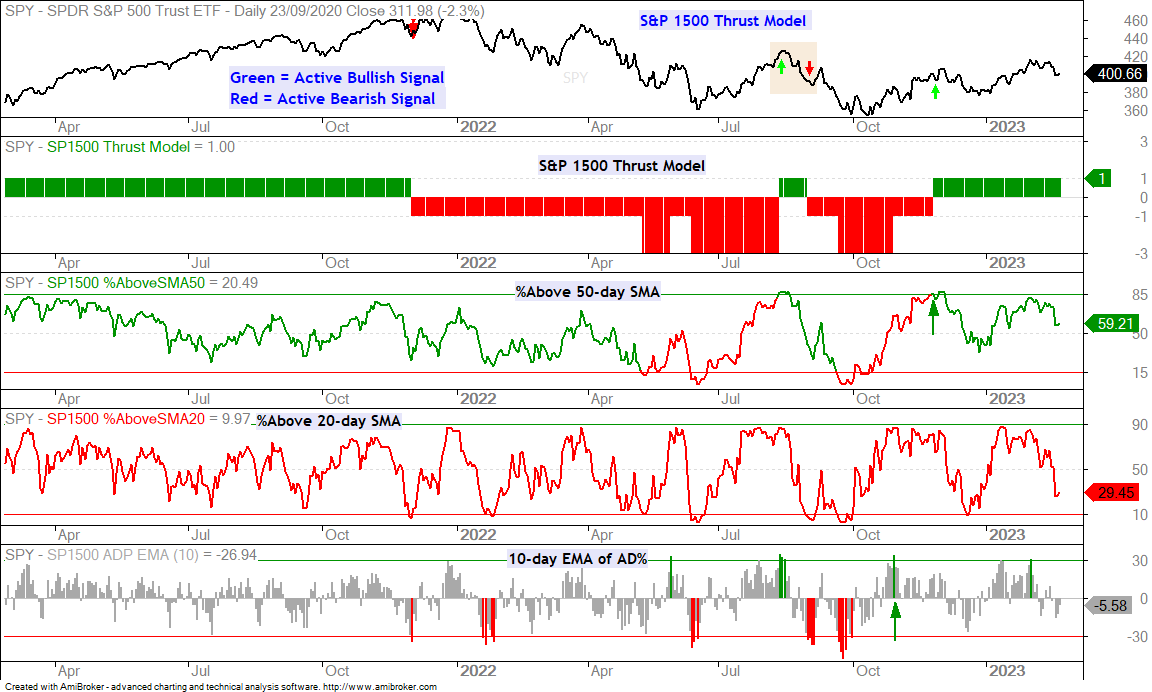
The model is currently bullish because the 10-day EMA of S&P 1500 AD% surged above +30% on October 28th and has yet to reverse this signal. S&P 1500 %Above 50-day SMA moved above 85% on November 25th and this turned the model bullish. S&P 1500 %Above 20-day SMA moved below 10% on September 23rd, 2020. This indicator has yet to get back above 90% and remains on a bearish signal.
Setting the Base Case
Before looking at performance for the different breadth models, let’s set the base case, which is the 5/200 day SMA cross for the S&P 500. This is as simple as it gets for trend-following and determining the direction of the key benchmark for the US stock market. The S&P 500 is the most widely followed index, it is the most used index for benchmarking returns and the 200-day SMA is the most widely used long-term moving average.
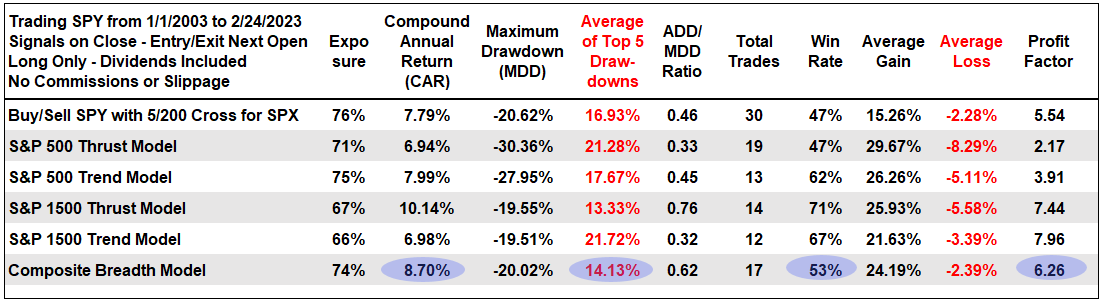
The table below shows performance for buy-and-hold and the 5/200 cross. Note that this is buying SPY based on moving average signals from the S&P 500. I am using the S&P 500 to avoid any ambiguity from dividend adjustments. Performance for the 5/200 cross is not bad: CAR 7.79% (green shading), MDD 20.62% and Average DD 16.93% (blue shading). The Win Rate was 47% (yellow shading) so this strategy has a 50/50 chance of producing a profitable trade.

S&P 500 Thrust the Trend Models
The next table shows performance for the S&P 500 models. The SPX Trend Model performed better than the S&P 500 Thrust Model. CAR was higher (7.99% vs 6.94%), the Average Drawdown (ADD) was lower (17.67% vs 21.28%) and the Profit Factor was higher (3.91 vs 2.17). Profit Factor is the total Dollar profit divided by the total Dollar loss. It is the ex-post reward to risk ratio. A Profit Factor of 3.91 means the system had $3.91 in profits for every $1 in losses.

S&P 1500 Thrust and Trend Models
The next table shows performance for the S&P 1500 models and the Thrust Model stands out. First, it is the only one with double digit returns. It also has the lowest Average Drawdown (13.33%) and the second lowest Maximum Drawdown (19.55%), which occurred in October 2012. The Win Rate was the highest (71%).

Composite Breadth Model Performance
Now let’s show the four models with the 5/200 cross and the Composite Breadth Model. The Composite Breadth Model has five inputs: the S&P 500 Trend and Thrust Models, the S&P 1500 Trend and Thrust Models and the 5/200 cross for the S&P 500. It is bullish (positive) when at least three of the five inputs are bullish and bearish when the majority are bearish. The CBM has the second highest CAR (8.7%) and the second lowest Average Drawdown (14.13%), behind the S&P 1500 Thrust Model. Performance slipped a bit after that because the CBM had the fourth best Win Rate (53%) and third best Profit Factor (6.26). The CBM is clearly one of the better performing models, but perhaps not the best.
Comparing Chart Signals
The next chart shows SPY with the Composite Breadth Model signals in the top half and SPY with the S&P 1500 Thrust Signals in the bottom half. First, let’s look at the Composite Breadth Model, which had 17 buy signals (9 winners and 8 losers). There were whipsaw periods in 2004, 2006 and 2022 (blue shading). Despite these whipsaws, the CBM managed to catch some big trends and turn bearish in a timely manner (3-August-2007, 11-October-2018 and 26-February-2020).
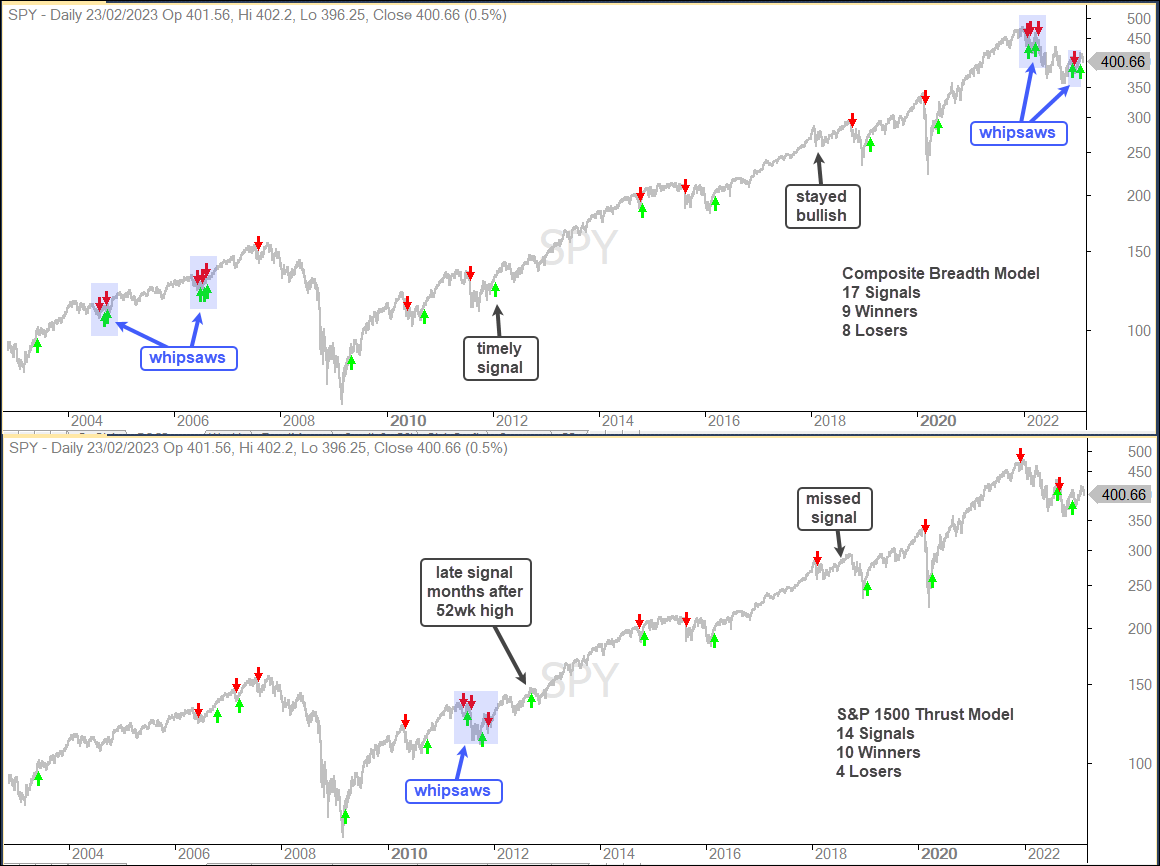
The S&P 1500 Thrust Model generated 14 buy signals with 10 winners and four losers. Clearly, the Win Rate is higher here. There were also fewer whipsaws. While it seems as if the S&P 1500 Thrust model is the winner, note that the model was still bearish when SPY was up over 10% and at 52-week highs in late August 2019 (missed signal). Also note that SPY hit a new high in February 2012 and the S&P 1500 Thrust Model did not trigger bullish until mid September (late signal). The Composite Breadth Model did not turn bearish in early 2018 (stayed bullish) and turned bullish in early 2012 (timely signal).
Final Thoughts
There is no such thing as the perfect indicator or model. Market timing models are designed to participate in bull markets and limit the drawdowns during bear markets. Both the Composite Breadth Model and S&P 1500 Thrust Model do the job with decent returns and limited drawdowns. As with the stock market, models will suffer when trends fail to take hold. Historically, the Composite Breadth Model is more prone to whipsaw than the S&P 1500 Thrust Model. This is especially true since January 2022 because big market swings are generating breadth signals and trends are not extending. 2023 looks like it is starting out the same. Nevertheless, for broad market timing and differentiating between bull and bear markets, the S&P 1500 Thrust Model falls short because it was not bullish when SPY is at a 52-week high.
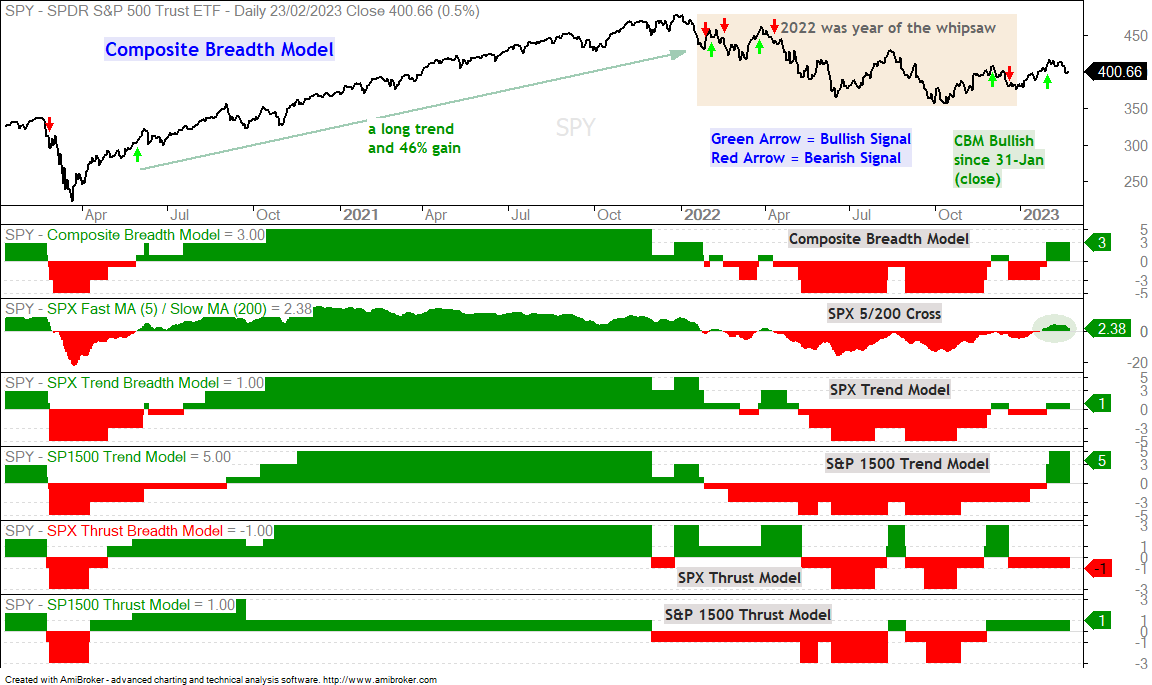
The S&P 1500 Thrust Model is bullish with two indicators on bull signals and one on a bear signal (+1). This model would turn bearish should the 10-day EMA of S&P 1500 AD% move below -30% or if the percentage or if S&P 1500 stocks above their 50-day dips below 15%. A bearish signal in the S&P 1500 Thrust Model would move the Composite Breadth Model from +3 to +1. The 5-day SMA is currently 2.38% above the 200-day SMA. A bearish cross in this input would also negatively affect the CBM.
Despite the whipsaws, I continue to follow the Composite Breadth Model and the 5/200 cross for the S&P 500. The chart below shows SPY rising from mid October to early February and forming a rising wedge. There are four swings within this wedge (up, down, up and down). SPY reversed the upswing with a break below 405 on Tuesday. SPY is now testing the wedge line and 200-day SMA. A wedge break would signal a continuation of the August-October decline and argue for a test of the October low.
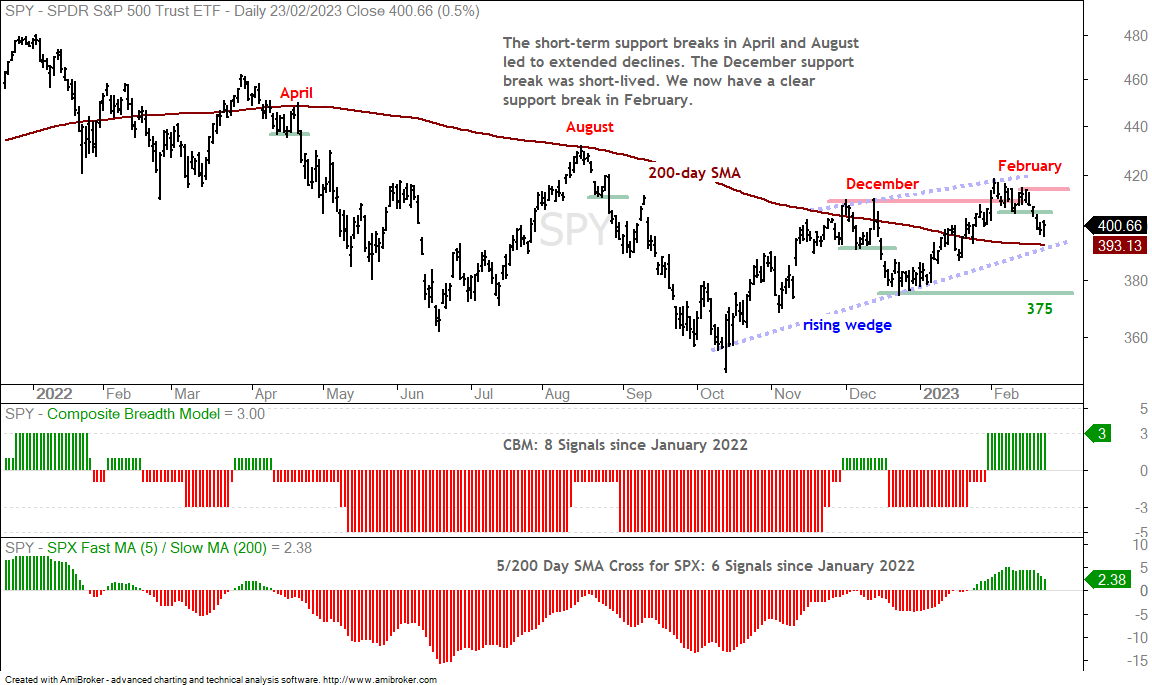
The indicator windows show the Composite Breadth Model and the 5/200 cross for the S&P 500 (not SPY). The weight of the evidence favors the bulls right now, but they are losing their grip. I hate to forecast a signal, but I think we are heading for another bearish signal and the whipsaw trend could continue. A bearish CMB signal or bearish 5/200 cross would be enough for me to turn bearish again.