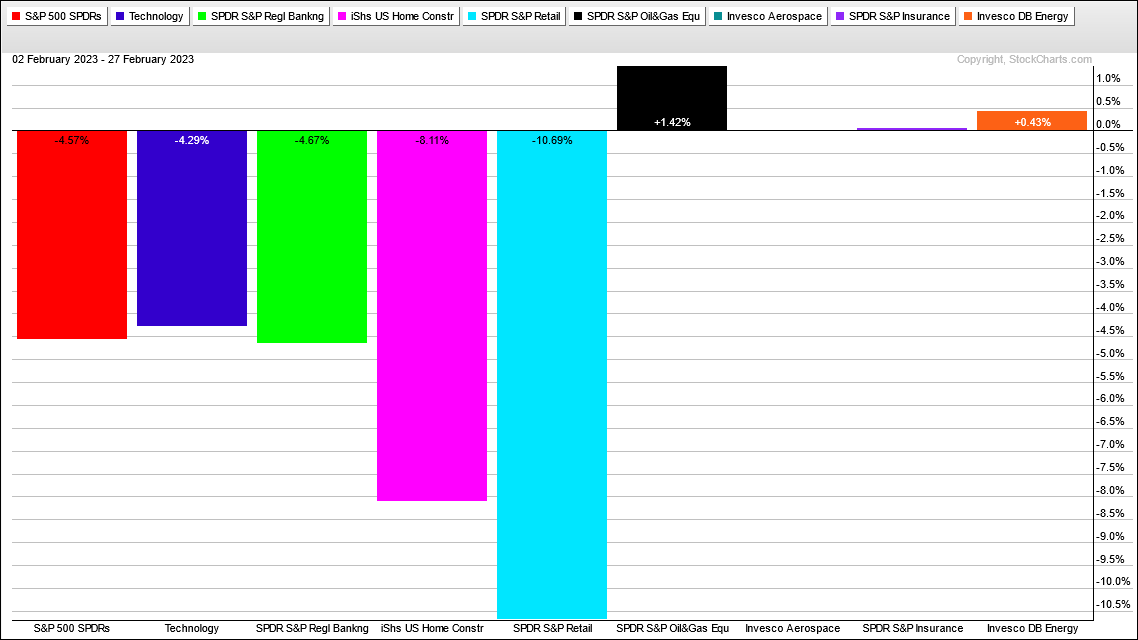
February has been a tough month for stocks and the vast majority of ETFs. The S&P 500 peaked on February 2nd and is down around 4.6% the last 16 days. All sector SPDRs are down over this period with Consumer Discretionary, Communication Services and Real Estate leading the way lower. Selling pressure is not just in stock ETFs, but also in other groups. Of the 275 ETFs in the Master List, only 16 are up over the last 16 days. These include BDRY, TUR, GREK, JO, UUP, KRBN, XES, ITA, EWU, CANE, DBE, DBA, OIH, DOW, KIE, PPA.
Of the stock-based ETFs, the Oil & Gas Equipment & Services ETF (XES), the Oil Services (OIH), the Aerospace & Defense ETF (ITA), the Aerospace & Defense ETF (PPA) and the Insurance ETF (KIE) are the only ones with gains. These last five ETFs are the strongest stock-based ETFs at the moment. Most of the other stock-based ETFs are in short-term downtrends. These downtrends could be corrections after the big advance in January, but I will respect the downtrends as long as resistance holds. Today’s report will focus on these short-term downtrends and the levels needed for trend-reversing breakouts.
Note that I will post a strategy update on Friday (instead of Thursday).
About the ETF Trends, Patterns and Setups Report
This report contains discretionary chart analysis based on my interpretation of the price charts. This is different from the fully systematic approach in the Trend Composite strategy series. In this ETF Trends, Patterns and Setups report, I am looking for leading uptrends and tradable setups within these uptrends. While I use indicators to help define the trend and identify oversold conditions within uptrends, the assessments are mostly based on price action and the price chart (higher highs, higher lows, patterns in play). Sometimes the chart assessment can be at odds with the indicators.
Report Schedule
Tuesday – 28 Feb: Market/ETF Report
Wednesday – 1 Mar: Market/ETF Video
Friday – 3 Mar: Updates for the Systematic Strategies
Systematic Strategies and Tables
Here are the three active strategies and their respective tables.
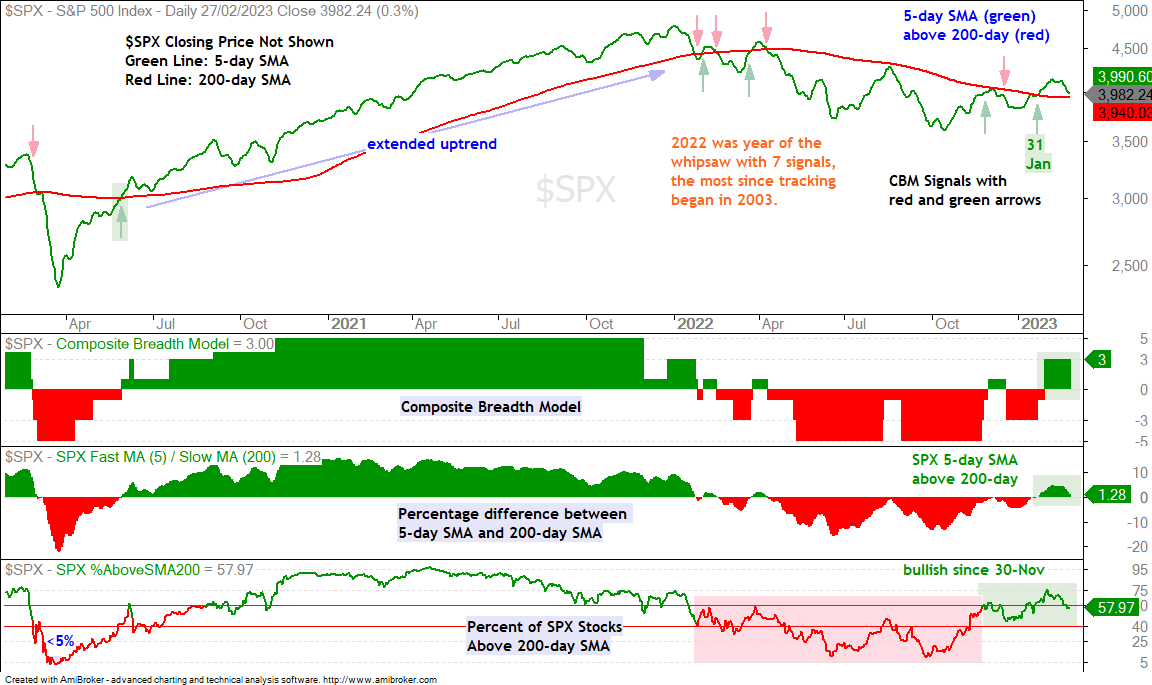
The Composite Breadth Model turned positive with a move to +3 on January 31st and the weight of the evidence is bullish for stocks. The 5-day SMA for the S&P 500 is above the 200-day SMA and around 58% of S&P 500 stocks are above their 200-day SMAs.
As far as my bull/bear stance for stocks, I am watching the Composite Breadth Model and the 5/200 cross for the S&P 500. The bulls have an edge as long as the CBM is positive and the 5-day is above the 200-day (currently 1.28%). I would turn bearish on stocks should one of these indicators turn bearish.
Three Strikes and You're Out
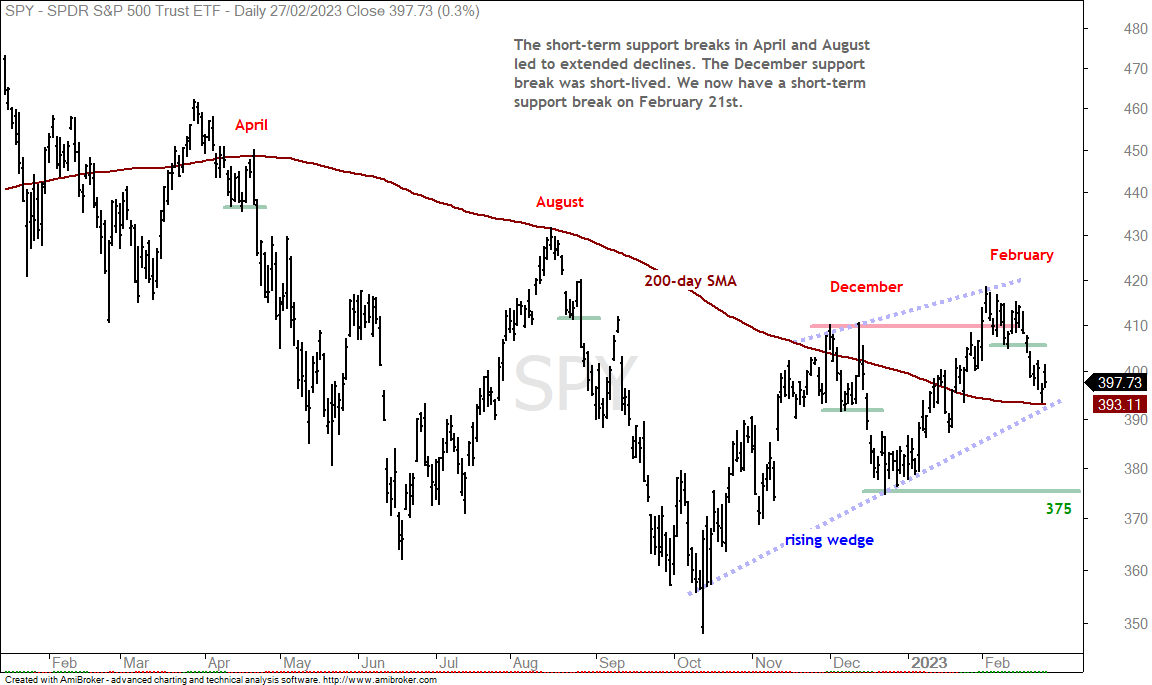
The S&P 500 SPDR (SPY) is in an uptrend over the last few months with a higher low in October and a higher high in February. The blue lines define this uptrend with a rising wedge taking shape. Typically, a rising wedge forms as a counter-trend bounce within a bigger downtrend. This means the advance from mid October to early February could be a bear market bounce. For now, the uptrend remains intact as the ETF tests the 200-day SMA and the lower trendline. A break below 390 would amount to strike two.
There are four swings within the rising wedge: up from mid October to mid December, down into late December, up into early February and down with the short-term support break on February 21st. This short-term support break is strike one as the upswing within the wedge reversed. A complete wedge reversal requires a lower low and a break below 375 would signal the start of a downtrend. This would be strike three.
The Short-term Swings
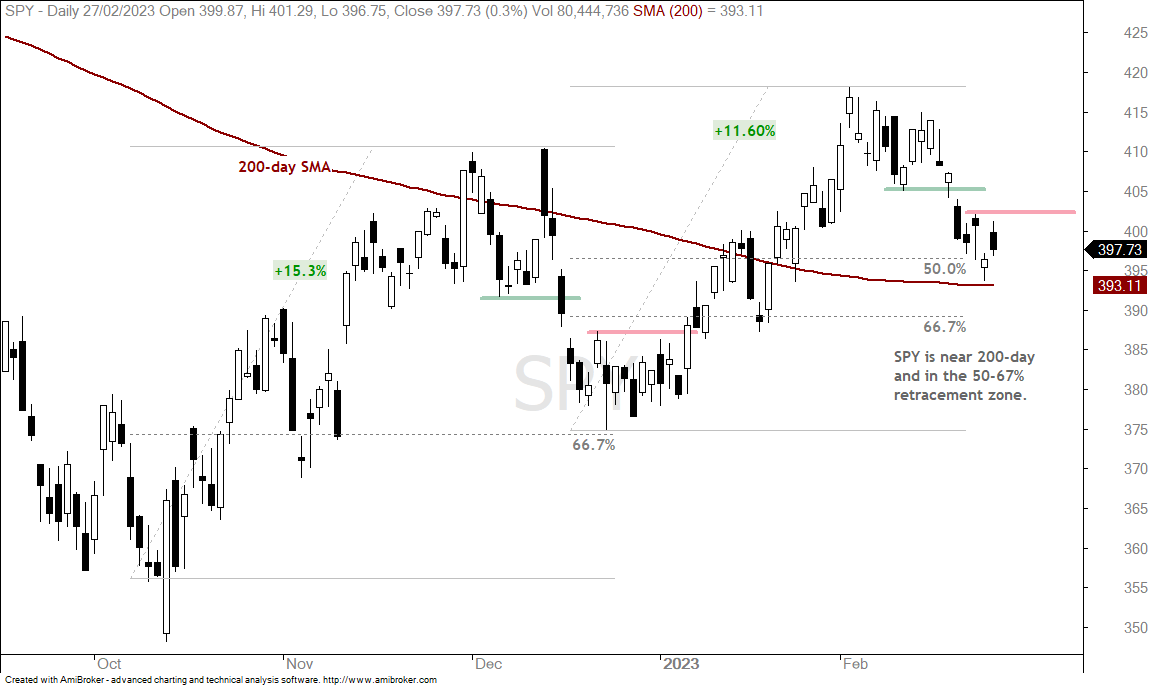
The next chart shows candlesticks with the support and resistance levels for the short-term swings. The short-term trend is down and SPY is in a potential reversal zone. Note that the current decline retraced a little over 50% of the prior advance, which was 11.60%. SPY is also near the 200-day SMA, which is also a battle zone. If the bulls are in control of the bigger trend, then this is an area to watch for a short-term breakout. The red line marks short-term resistance at 403 and a breakout here would be short-term bullish. Until such a breakout, the short-term trend is down and stocks are looking wobbly.
TLT Falls Along with Stocks (Yields Rise)
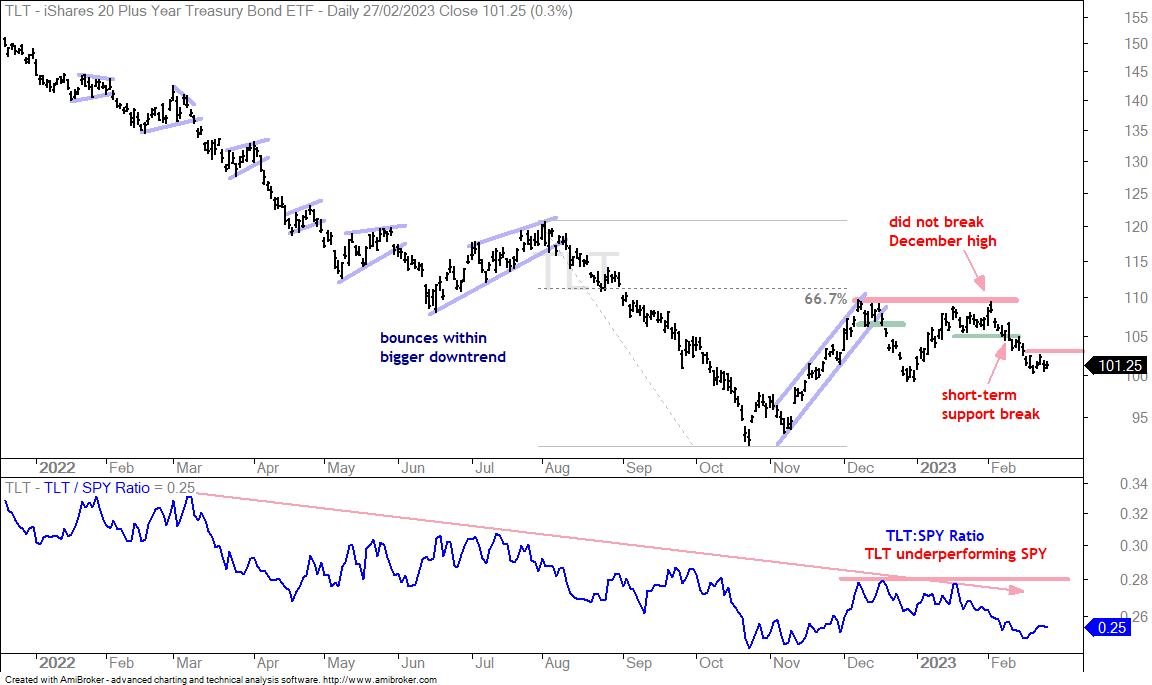
The 20+ Yr Treasury Bond ETF (TLT) rose with the stock market in January and fell with the stock market in February. These two have been positively correlated since January 2022, both rising and falling together. This relationship will change one day, but for now it remains in place. The chart below shows TLT failing to break its December high in early February and breaking short-term support in mid February. TLT firmed around 100 the last six days and remains in a short-term downtrend. A break above 103 would reverse the short-term downtrend and this could be short-term positive for stocks.
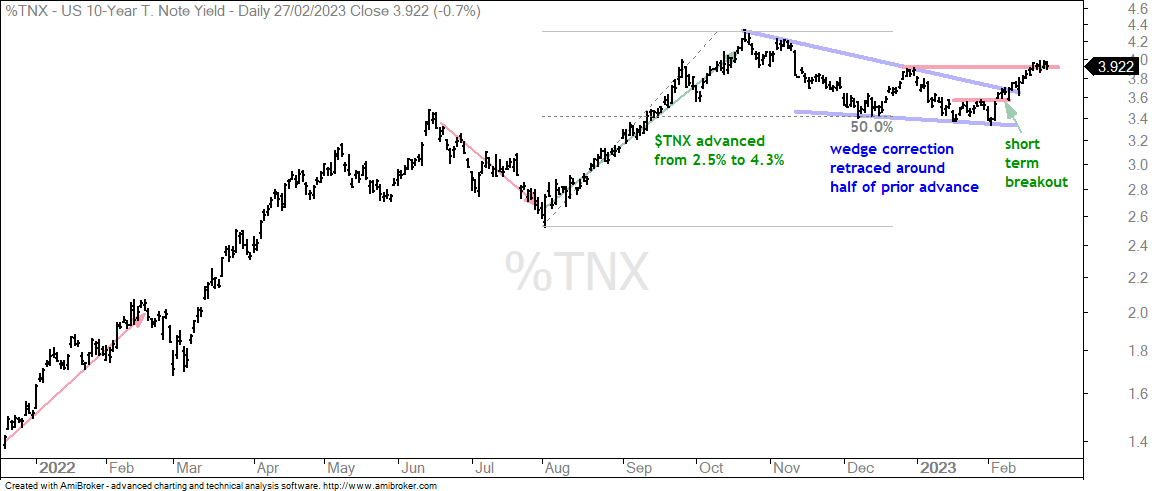
Keep in mind that the 10-yr Treasury Yield rises when TLT falls. This means rising yields were negative for stocks in February. The next chart shows the 10-yr Treasury Yield moving from 3.4% in early February to 3.92% in late February. $TNX broke short-term resistance on February 6th, the wedge line a few days later and exceeded its January high last week. The falling wedge is deemed a correction within a bigger uptrend and these breakouts signaled the end to the correction. The trend is higher for yields.
Does Tech have another Leadership Leg Ahead?
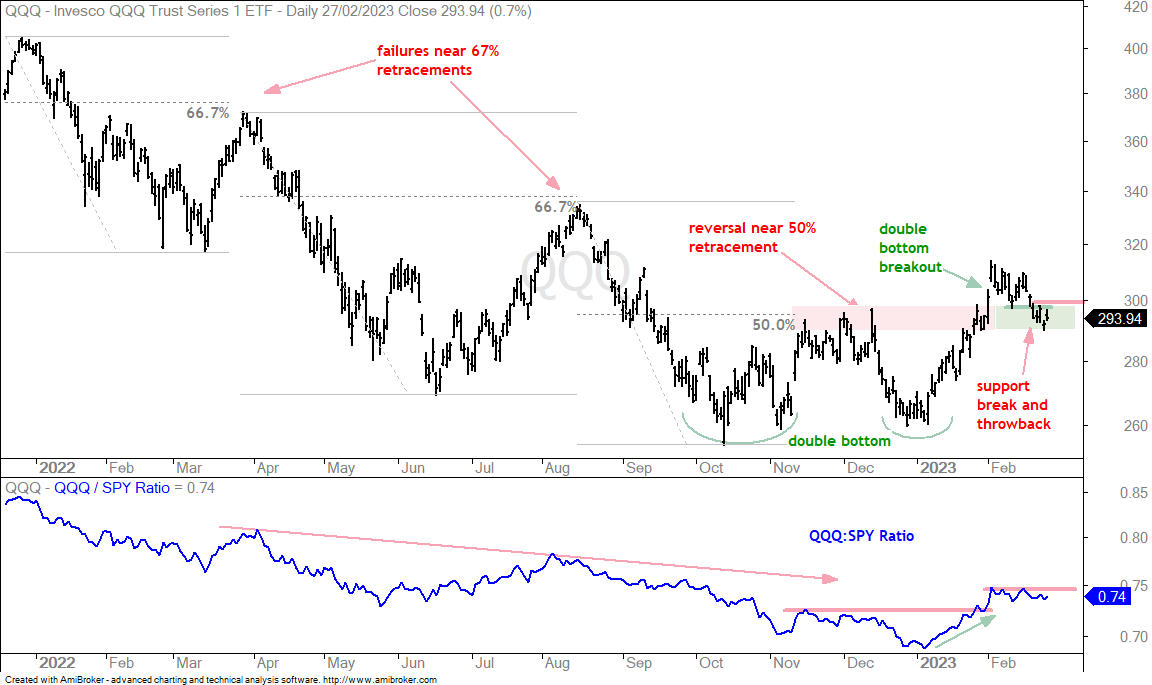
Tech-related ETFs led the market higher in January and then pulled back with the rest of the market here in February. Rising yields could be part of the story here so an upside breakout in TLT could be positive for tech. The chart shows QQQ with a double bottom breakout and then a short-term support break last week. The breakout zone (red shading) turns first support (green shading) and this could be a post-breakout throwback. A throwback occurs when price breaks resistance and then pulls back to the breakout, which becomes support. As with SPY, the short-term trend is down after last week’s support break. Short-term resistance is set at 300 and a breakout here would reverse the short-term downtrend. Those looking for a return to relative strength can watch the QQQ:SPY ratio for a break above the February highs.
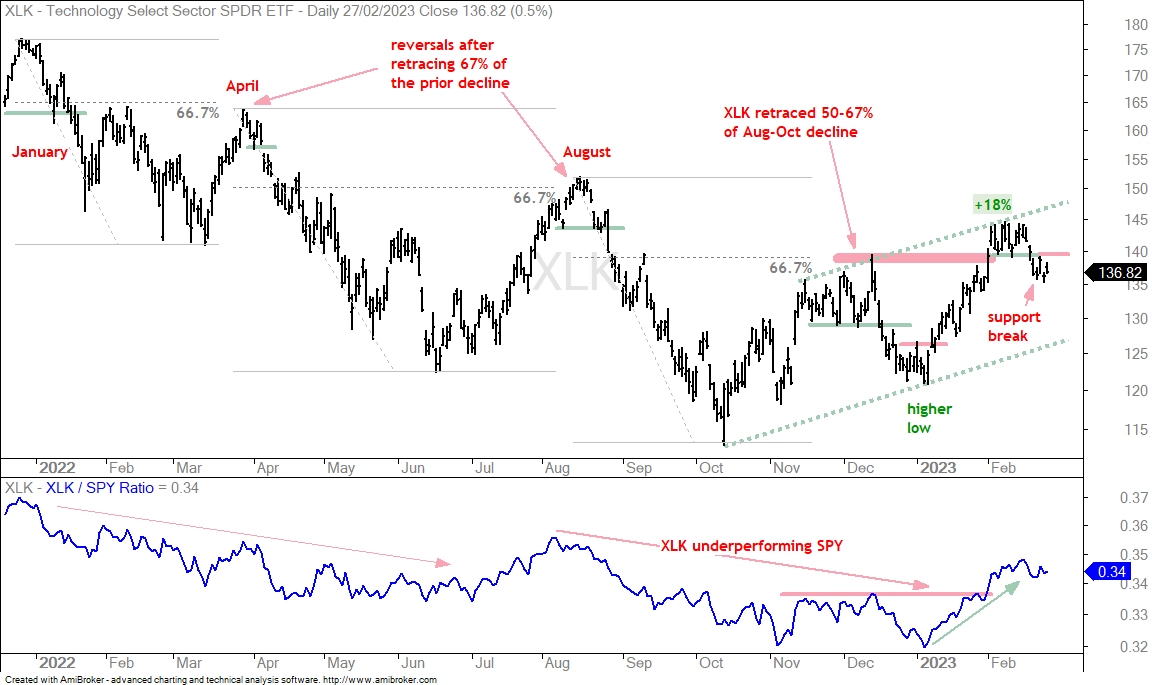
The next chart shows the Technology SPDR (XLK) with a short-term support break last week. The swing within its rising channel is now down with resistance marked at 139.
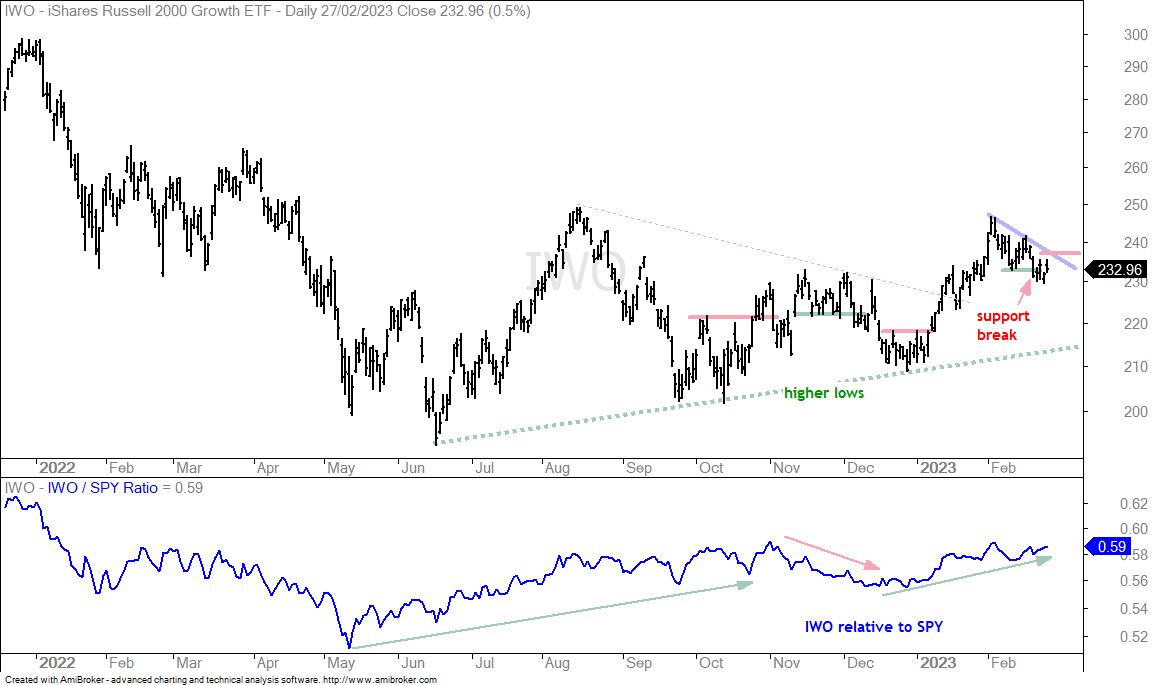
The next chart shows the Russell 2000 Growth ETF (IWO), which is 21.6% Healthcare and 20.15% Technology. The ETF sports a series of higher lows since June and this means there is some sort of uptrend working. IWO broke short-term resistance in early January and surged above 240. The ETF then broke short-term support last week and remains in a short-term downtrend. This February decline could be a pullback after the January surge. A breakout at 237 would reverse this short-term downtrend.
Cybersecurity ETF Shows Relative strength (CIBR)
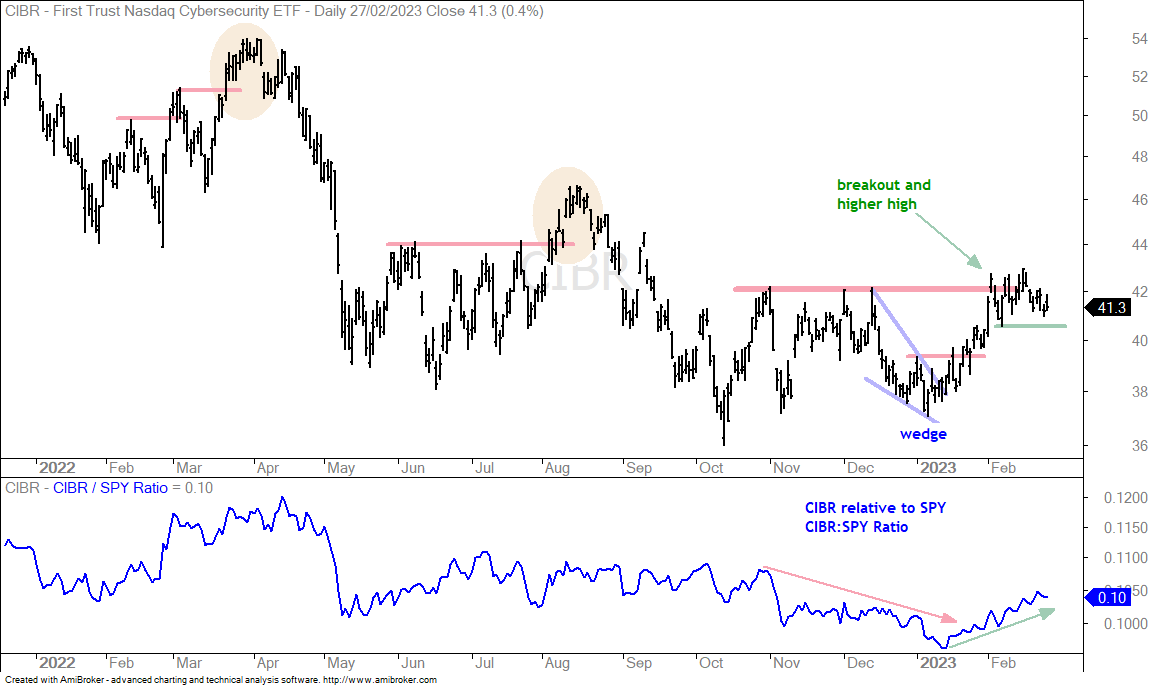
Tech-related ETFs are positively correlated, which means they move in the same direction. Short-term breakouts in QQQ and XLK would be positive for tech-related ETFs. These include FDN, IPAY, FINX, SKYY, CIBR, IGV and SOXX. The tech related ETFs are down between 2.82% (CIBR) and 12.75% (FINX) over the last 16 days (since SPY peaked). With the smallest decline of the group, the Cybersecurity ETF (CIBR) is holding up the best and showing relative strength in February. The chart below shows CIBR breaking resistance to forge a higher high. The ETF then consolidated around the breakout level (42) the last few weeks. Notice that CIBR did not break the early February low (green line). The other tech-related ETFs, in contrast, broke short-term support last week. CIBR is basically consolidating after the January surge and a consolidation after a sharp advance is a bullish continuation pattern. CIBR may, however, need some help at the sector level so I would watch for a breakout in XLK.
Agribusiness ETF with Downswing in Narrowing Range
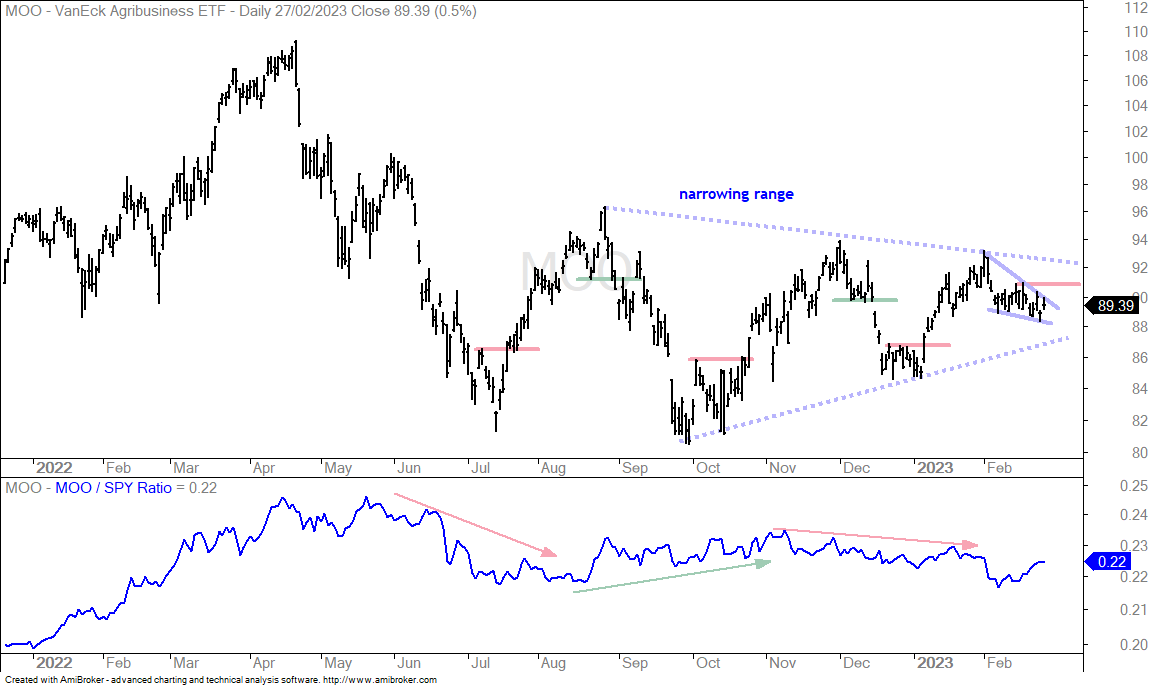
Agribusiness ETF (MOO) has been going nowhere since summer with a series of swings between 80 and 95. The swings became shorter over the last few months as the range narrowed (blue dashed lines). As with many ETFs here in February, MOO is currently in the midst of a downswing. MOO surged with the rest of the market in January and fell in February. I am marking resistance at 91 and a breakout here would be bullish.
XLE Becomes Oversold Near Support
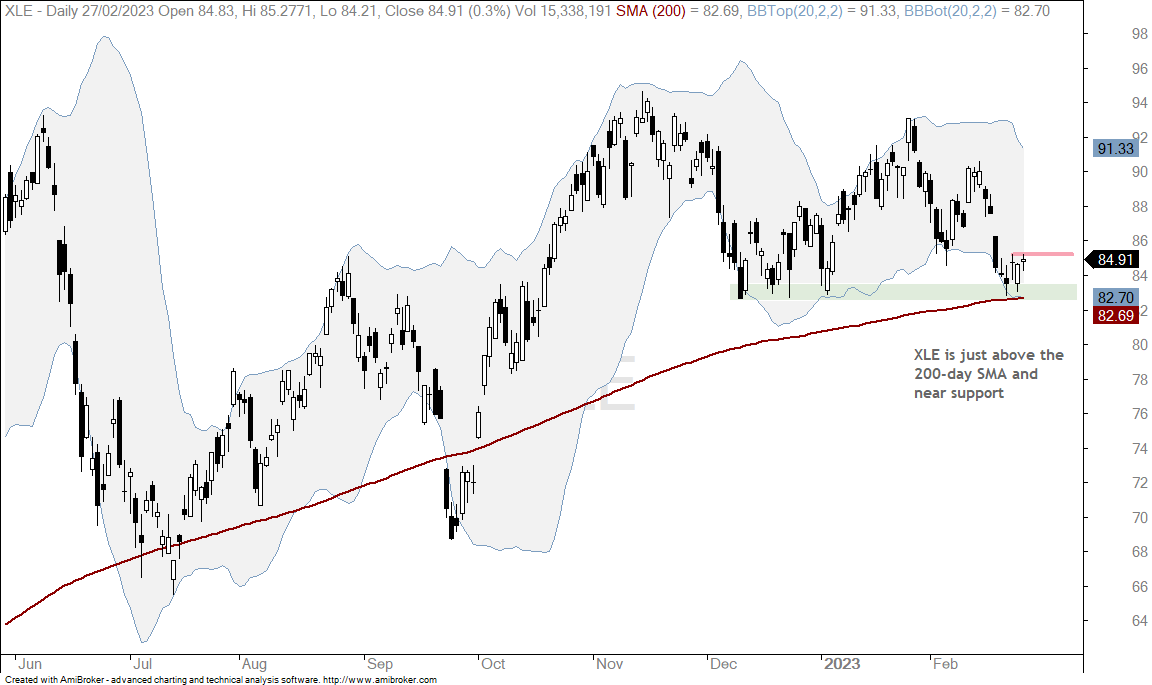
There are many ways to define the trend and identify short-term conditions. The 200-day SMA is a classic trend indicator: uptrend when above and downtrend when below. Bollinger Bands (20,2) can be used to identify overbought conditions when prices dip below the lower band. The chart below shows XLE just above the 200-day and still in an uptrend. In addition, price is near support from the December lows (green shading) and XLE dipped below the lower Bollinger Band last week. XLE is thus oversold and at support, which are conditions that could give way to a bounce. The red line marks short-term resistance and a breakout here would be short-term bullish.
IBB Breaks Support, but XBI Holds
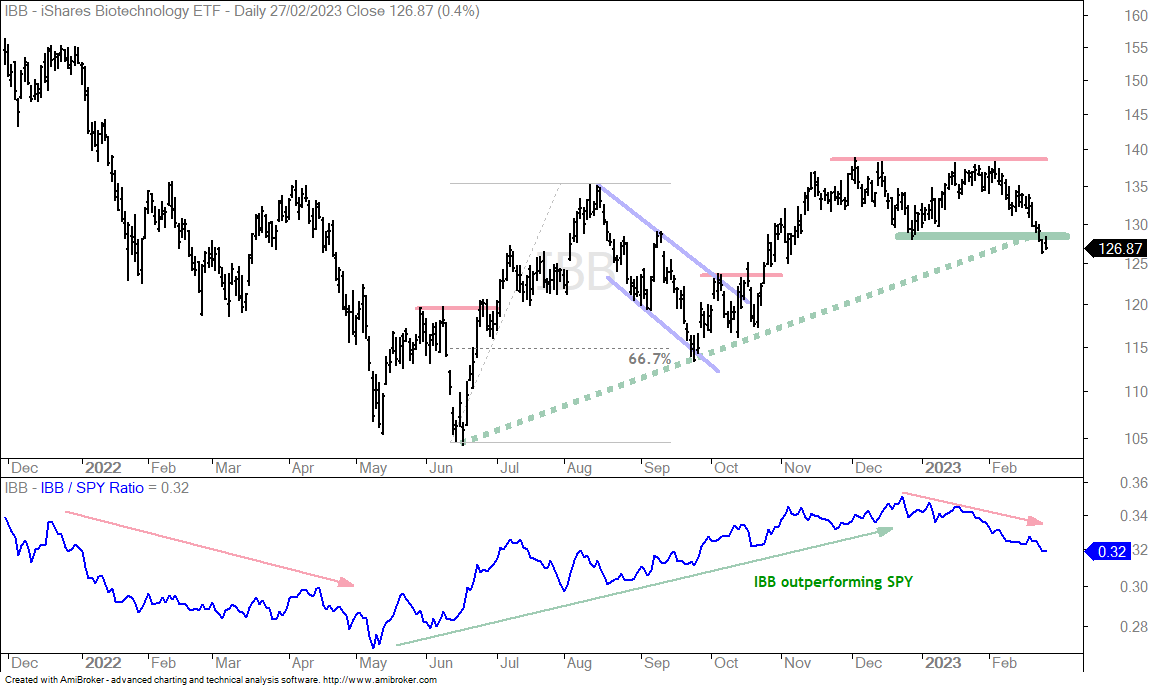
The Biotech ETF (IBB) is the weakest of the two biotech ETFs. The chart shows IBB bouncing in the first half of January, but stalling at the December highs (red line) and breaking the December low last week. A small double top formed and the support break forges a lower low (downtrend).
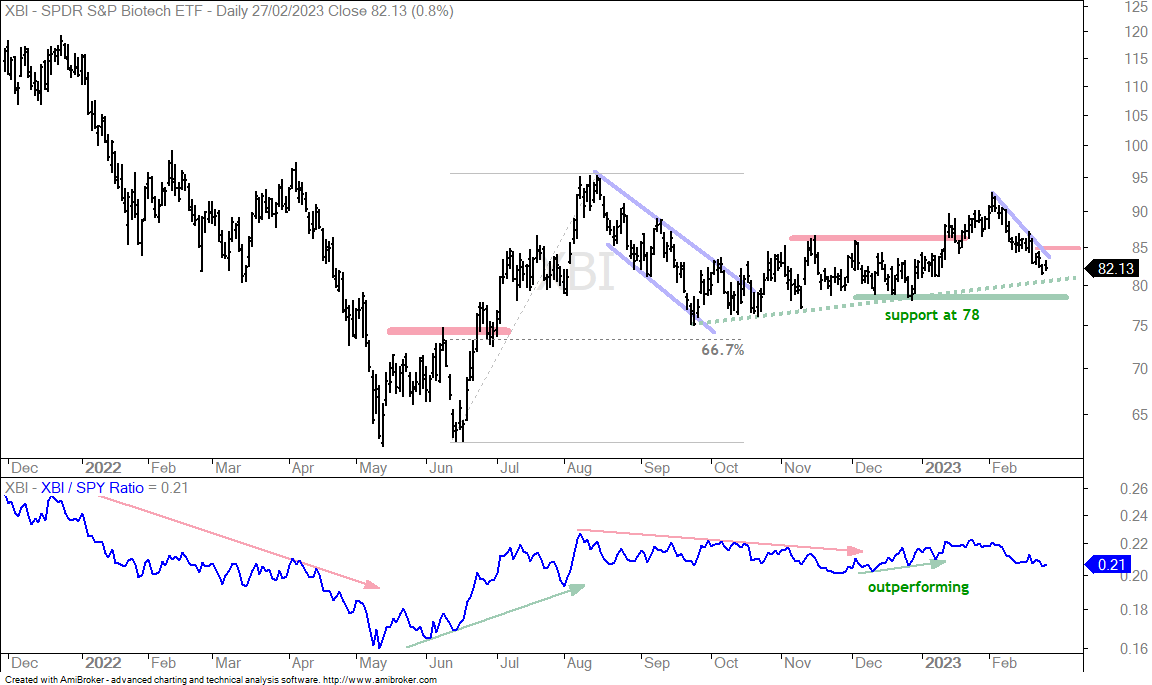
The next chart shows the Biotech SPDR (XBI) with an uptrend working since October (green dashed line) and a pullback there in February. XBI remains above the December low and this is why it is stronger than IBB. The short-term trend is still down though and a breakout at 85 is needed for a reversal.
Copper and Base Metals Fail to Hold Breakouts
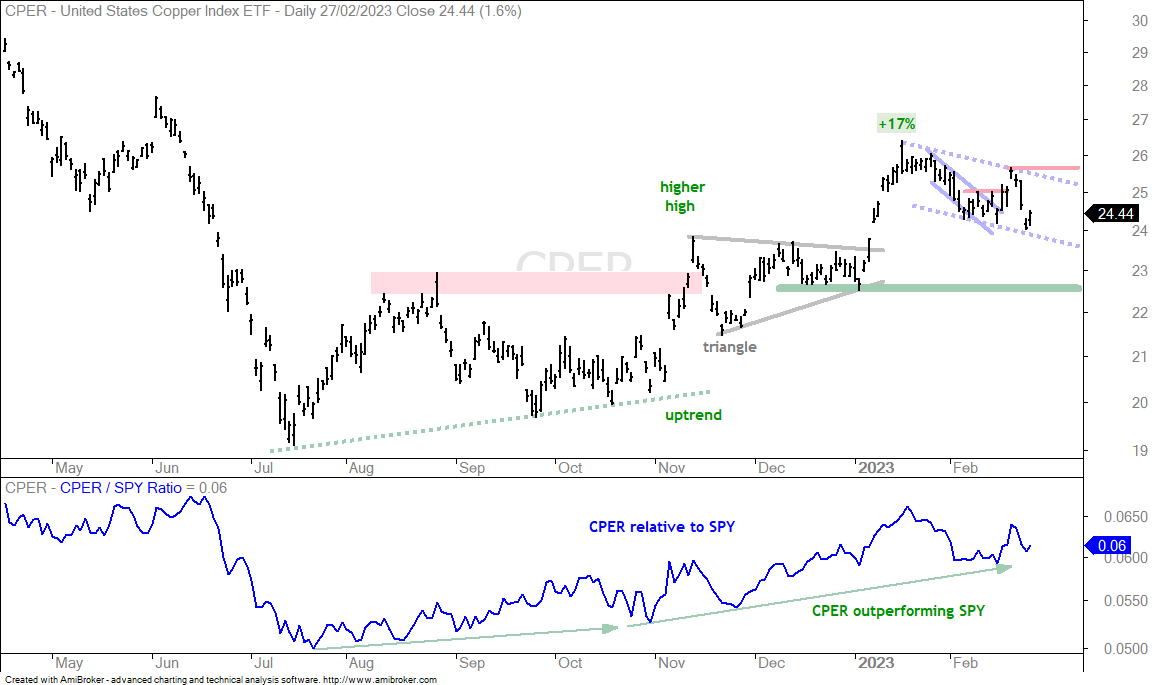
I featured the Copper ETF (CPER) on February 14th with a short correction after the 17% advance. CPER was again featured last week as it broke out on February 20th (blue solid lines). This breakout failed to hold as the ETF fell back sharply. The overall trend remains up and CPER is still leading since November. As such, I view the pullback as a correction within a bigger uptrend. The dashed blue lines define this pullback with last week’s high marking resistance. A breakout here is needed to signal an end to the correction and a resumption of the bigger uptrend.
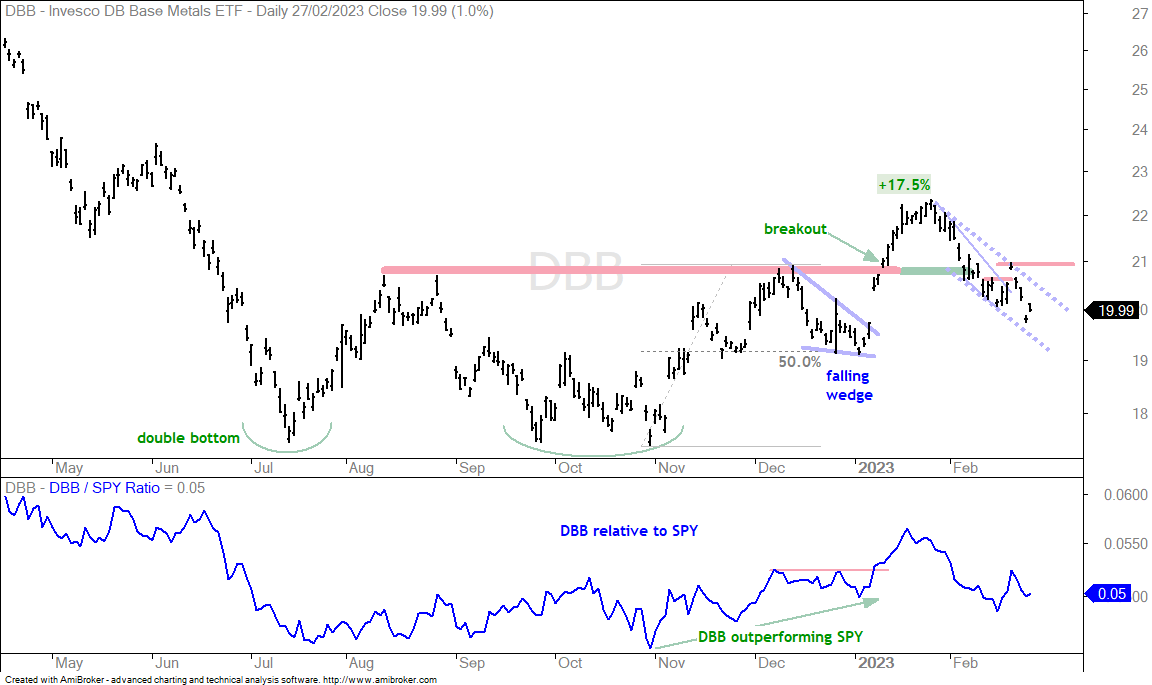
The next chart shows the DB Base Metals ETF (DBB) with a double bottom and a breakout in mid January. The ETF fell back below the breakout zone with a falling wedge into last week and broke out with a surge last Tuesday (21-Feb). This breakout failed as DBB fell sharply the next three days. The dashed blue lines define the current downswing and a break above 21 is needed for a reversal.
Platinum and Gold Fall as Dollar Rises
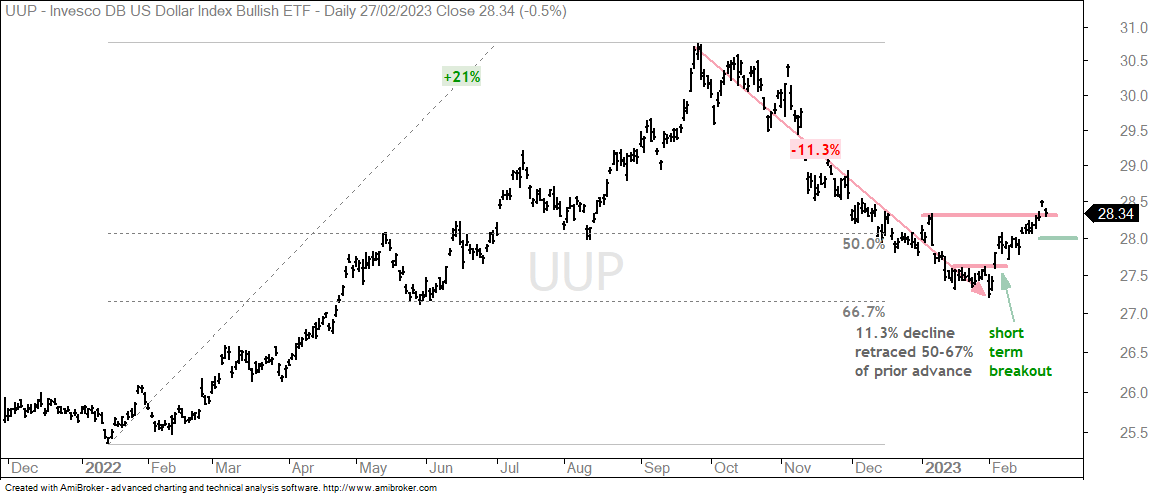
The Dollar Bullish ETF (UUP) surged in February and strength stems from the rise in the 10-yr Treasury Yield. Treasury yields and the Dollar are positively correlated. UUP broke short-term resistance on February 3rd and exceeded its January high last week. This strong move is reversing the downtrend that was in place from late September to January (-11.3%). Short-term, UUP is quite extended and could consolidate or pullback. I am marking short-term support at 28 for now.
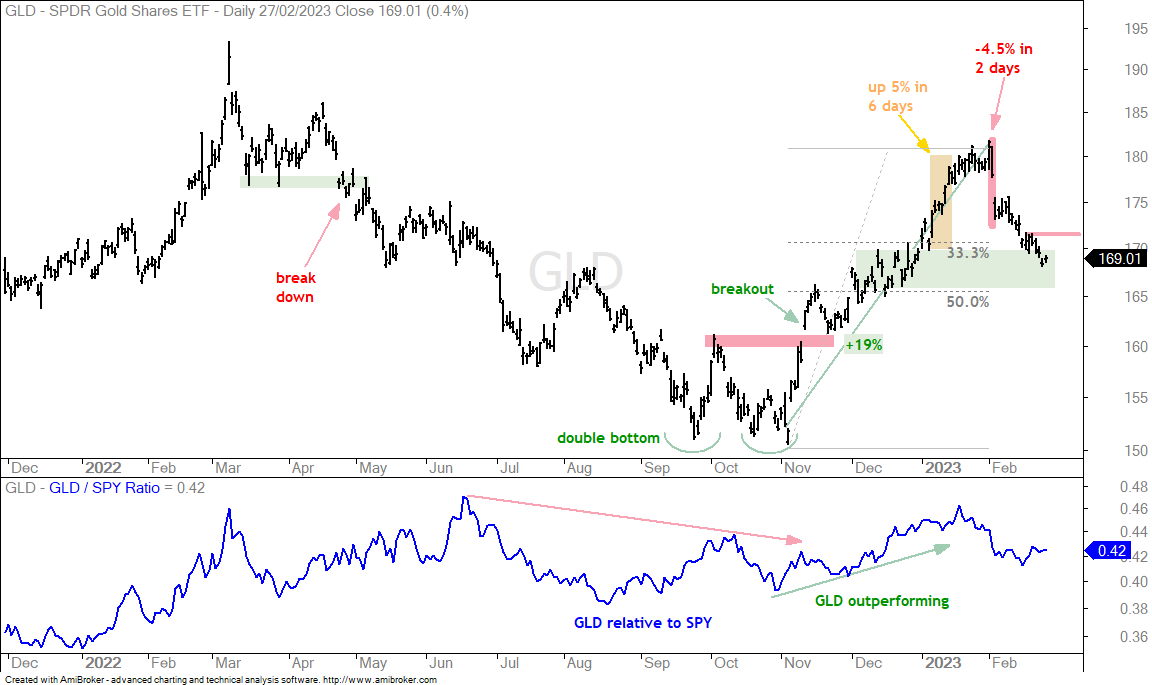
Strength in the Dollar weighed on the Gold SPDR (GLD) as it fell hard in February. The current decline retraced 33-50 percent of the prior advance and GLD is short-term oversold after a 7% decline the last 17 days. The retracement zone represents a potential reversal zone and GLD could bounce from here. Short-term resistance is set at 171.5 and a breakout here is needed to reverse the current downswing. A lot depends on the 10-yr Treasury Yield and the Dollar.
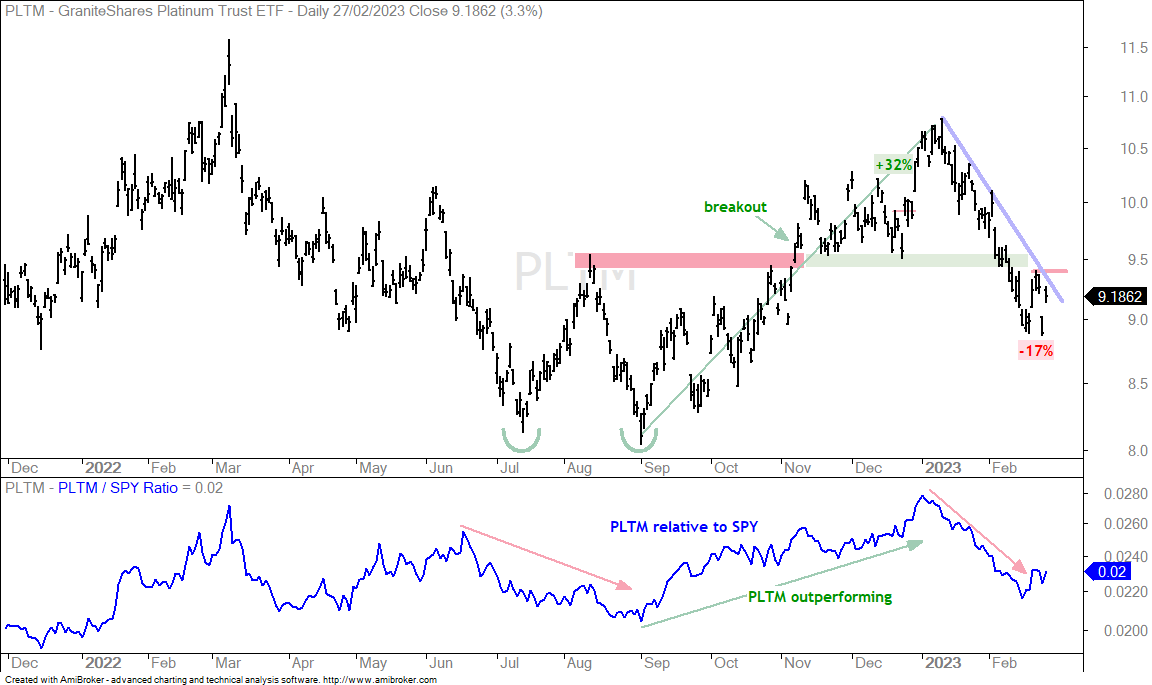
The Platinum ETF (PLTM) went from a market leader in mid January to a laggard at the end of February. PLTM broke support with a double digit decline the last eight weeks and remains in a short-term downtrend. There was a pop and drop last week and this means we have a short-term resistance level to watch for a breakout (9.4).