Rotation Trader S&P 500 and Nasdaq 100 Stocks
Indicators, Universe and Methods

Rotation trading strategies capture the power of momentum by rotating into the strongest stocks and out of stocks that are losing momentum. This report explains the two Rotation Trader strategies (RO-Trader), which trade using weekly signals. These strategies use the same indicators and methods, but trade different universes. One trades stocks in the Nasdaq 100, while the other trades stocks in the S&P 500 (without financials). We cover the required conditions, trend indicators, momentum rank, rotation thresholds and exit signals. This report concludes with an overview of the signal pages and the ranking tables used to trade these strategies.
The usual disclaimers apply for the strategies and the analysis on TrendInvestorPro. Past performance does not guarantee future performance. You and you alone are responsible for your investment and trading decisions. Do your own due diligence.
Rotation Trader vs Rotation Investor
The Rotation Trader strategies are more active and short-term than the Rotation Investor strategies. For example, Rotation Trader uses 60 and 120 periods for its trend indicators, while Rotation Investor uses 200 days. Rotation Trader uses a momentum offset (20 days), but Rotation Investor uses the most recent momentum values. Rotation Trader has shorter holding times, more trades and the average Profit/Loss Percent is smaller. Both strategies trade once per week, but Rotation Trader is for more active traders because it generates more signals.
Rotation Trader Highlights
- Weekly Trading (once per week)
- Market beating returns with lower drawdowns
- Trend Filters to ensure stock is uptrend on two timeframes
- Momentum rank to rotate into leading stocks
- Market filter to preserve capital during bear markets
Market timing model to trade only during bull markets
Dual-Momentum
Momentum has provided a persistent edge in the US equity markets for decades. Stocks that are currently in uptrends are more likely to extend their uptrends and stocks that are outperforming now are more likely to outperform in the future. This strategy capitalizes on momentum by using two types: absolute momentum and relative momentum. First, we filter to find stocks that are in strong uptrends (absolute momentum). Second, we rank performance to select stocks that are outperforming the other index constituents. When used with a market timing filter, this dual-momentum approach outperforms buy-and-hold with significantly lower drawdowns.
RO-Trader-SPX
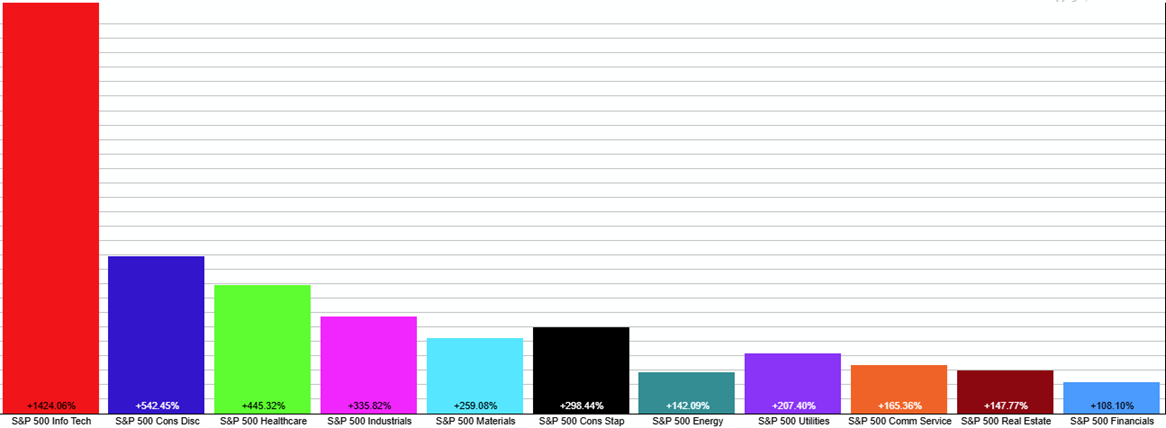
Rotation Trader SPX (RO-Trader-SPX) trades stocks in the S&P 500, but excludes the finance sector because it is a long-term laggard. With over 70 stocks, finance stocks account for around 15% of the component stocks in the S&P 500. As a group, this sector is a persistent underperformer. In fact, it is by far the weakest of the 11 sectors over the last 20+ years. The PerfChart below shows 20 year performance for the 11 sector indexes. Notice that the S&P 500 Financials Index ($SPF) shows the smallest gain (short blue bar on the far right). Info Tech ($SPT) shows the largest gain (tall red bar on far left).
RO-Trader-NDX
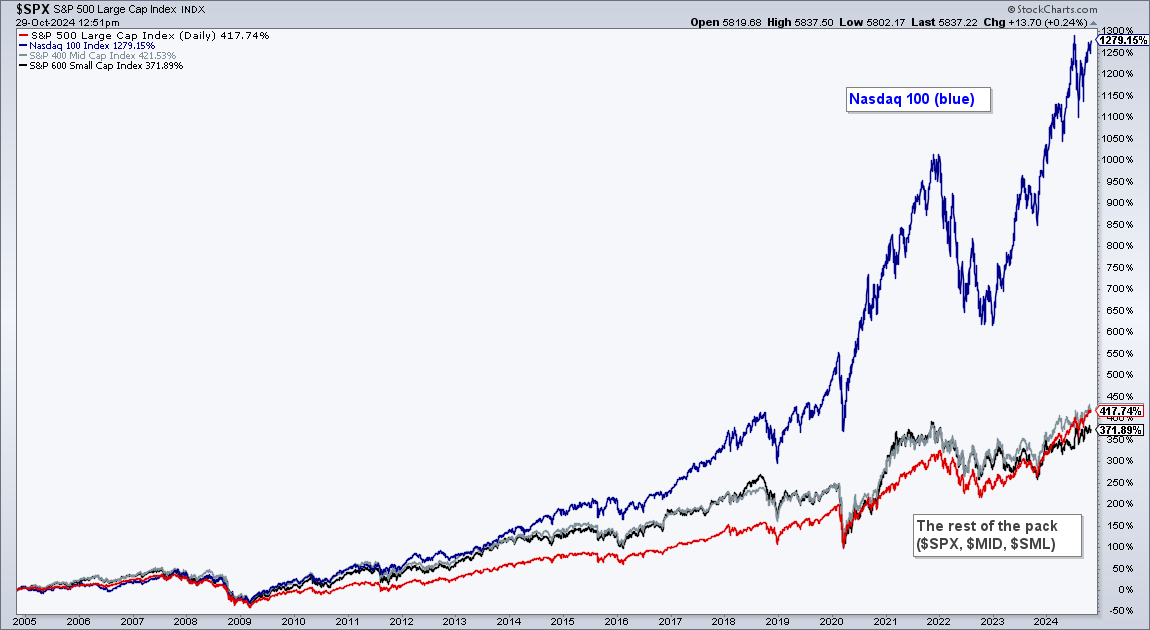
Rotation Trader NDX (RO-Trader-NDX) trades stocks in the Nasdaq 100 to capitalize on growth and Beta. Launched in January 1985, the Nasdaq 100 represents the 100 largest non-financial companies in the Nasdaq. You read right. The creators purposely excluded the finance sector – and the rest is history. As the chart below shows, the Nasdaq 100 is by far the best performing major index ETF over the last 20 years. NDX is up more than twice as much as the S&P 500, S&P MidCap 400 and S&P SmallCap 600. The Nasdaq 100 is the place to capture long-term growth and outperformance.
Strategy Mechanics
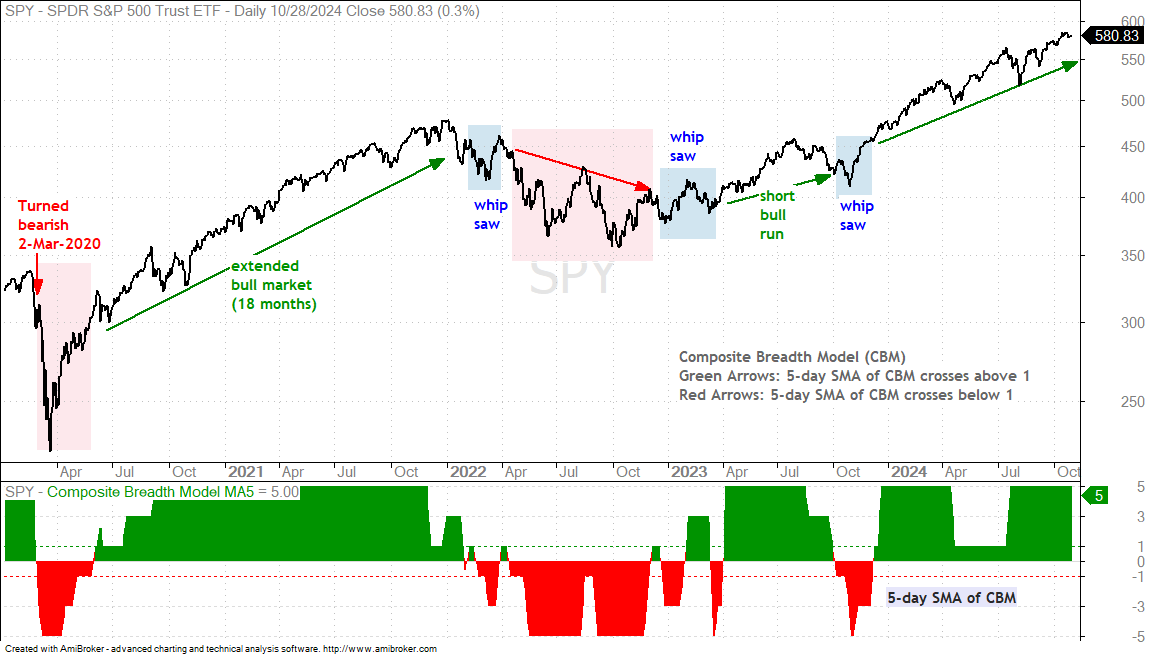
This is a long only strategy that trades in bull markets. We use a 14 indicator Composite Breadth Model (CBM) to define bull and bear markets. The CBM includes breadth indicators from the S&P 500 and S&P 1500. This means it covers Nasdaq stocks, NYSE stocks, large-caps, mid-caps and small-caps. The strategy moves to cash during bear markets. This market filter limits drawdowns and preserves capital during bear markets.
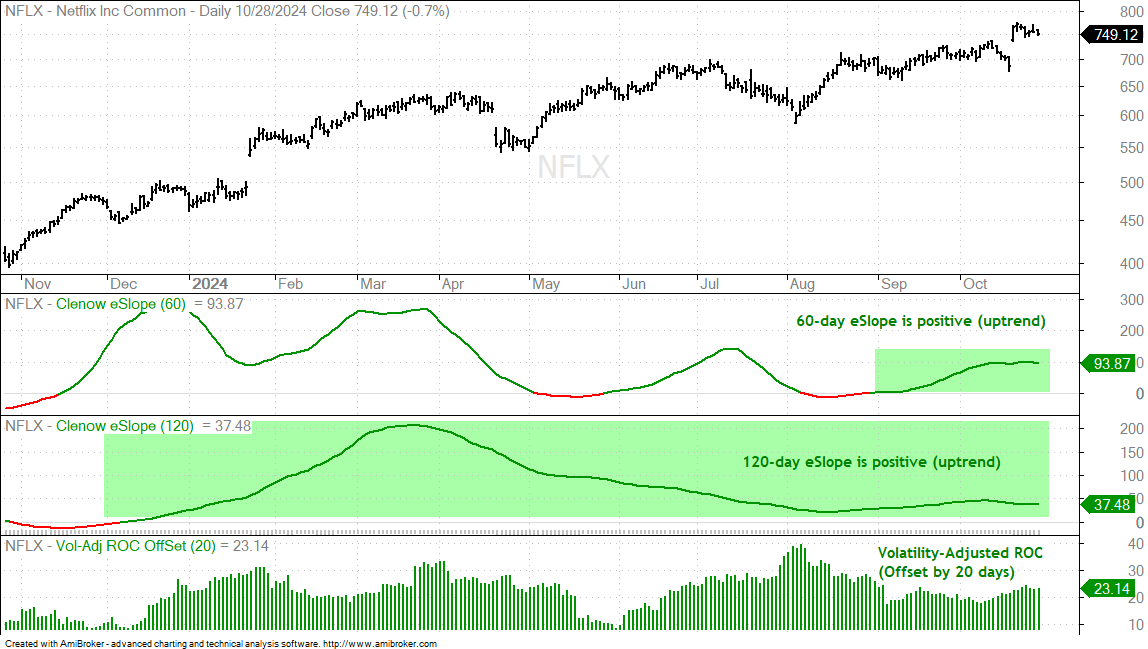
For the trend indicators, we are using the Exponential Slopes for two timeframes, 60 days and 120 days. These indicators quantify trend strength and filter for stocks in uptrends (absolute momentum). A stock is in an uptrend with both of its eSlope indicators are positive. Just as important, they also filter out stocks that are in downtrends. The chart below shows Netflix with the two eSlope indicators.
The momentum indicator measures the volatility-adjusted rate-of-change (ROC). Instead of using pure momentum, we divide the Rate-of-Change by a volatility indicator to level the playing field. This means we are selecting stocks with the strongest momentum relative to their volatility. Risk (volatility) is being adequately rewarded (momentum). We use the prior month’s value to reduce the chance of buying overbought stocks and increase the chance of buying on a pullback.
There are two volatility filters. One excludes stocks with excessively high volatility (extreme risk), such as meme stocks like Gamestop (GME). The other filters out stocks with unusually low volatility because they are often takeover candidates. Stocks that receive a takeover bid often trade in tight ranges with extremely low volatility.
Once stocks meet the conditions above, this strategy buys the top ten stocks and sells a position when the stock drops out of the top twenty. This is the “rotation” aspect. The replacement is the stock with the highest ranking and a stock that is not already in the portfolio.
Initial positions are 1/10th of the portfolio (equal weight) and there is no rebalancing because this defeats the purpose of a momentum-rotation portfolio. Rebalancing involves selling a portion of the winners and redistributing the proceeds. The aim is to ride the winners, not to reduce exposure to the winners.
The rotation feature triggers sell signals in stocks that experience a decrease in relative momentum. These stocks are often still in uptrends, but relative momentum is waning. Exit signals, therefore, are not always based on a trend change or significant decline. This rotational aspect reduces the average loss. The strategy then rotates into stocks showing an increase in relative momentum.
Systematic Trading
Systematic trading is a long-term endeavor, not a brief undertaking. There will be ups, downs, periods of outperformance and periods of underperformance. We cannot judge performance using days, weeks or even a few months. Long-term endeavors require a minimum of six months before passing judgement. Past performance does not guarantee future performance, but this dual-momentum strategy should keep its edge as long as the momentum edge persists in the US equity markets.
Signal Tables: Entries, Exits and Closed Positions
This section shows the signal tables that are posted at the end of every week (usually Saturday morning). This example covers the Rotation Trader SPX signals, but the process is exactly the same for the Rotation Trader NDX signals.
We start with a summary table showing current positions and new entry/exit signals. The top 20 stocks for the current week and prior week are on the right (blue/yellow shading). These side-by-side tables make it easy to see when a stock falls out of the top 20 from one week to the next.
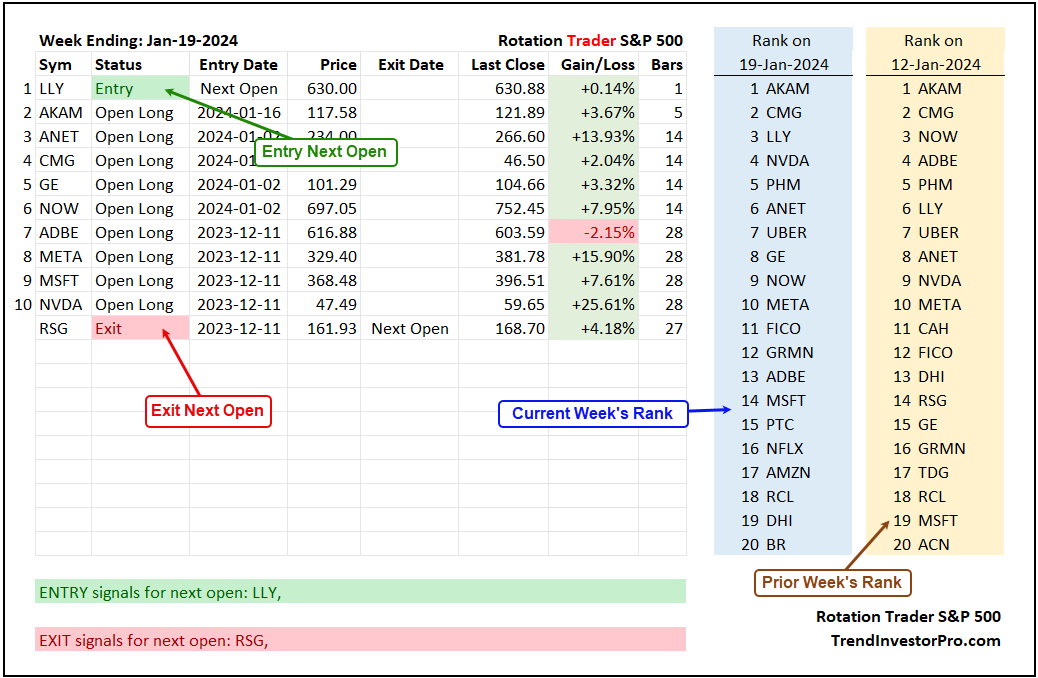
The current ENTRY/EXIT signals also appear below this table. In the example above, there is an ENTRY signal for LLY and an EXIT signal for RSG. Not all weeks have ENTRY and EXIT signals. Sometimes the portfolio stays the same. EXIT signals trigger for three reasons: the momentum rank falls out of the top 20, a trend indicator turns negative or the Composite Breadth Model signals a bear market.
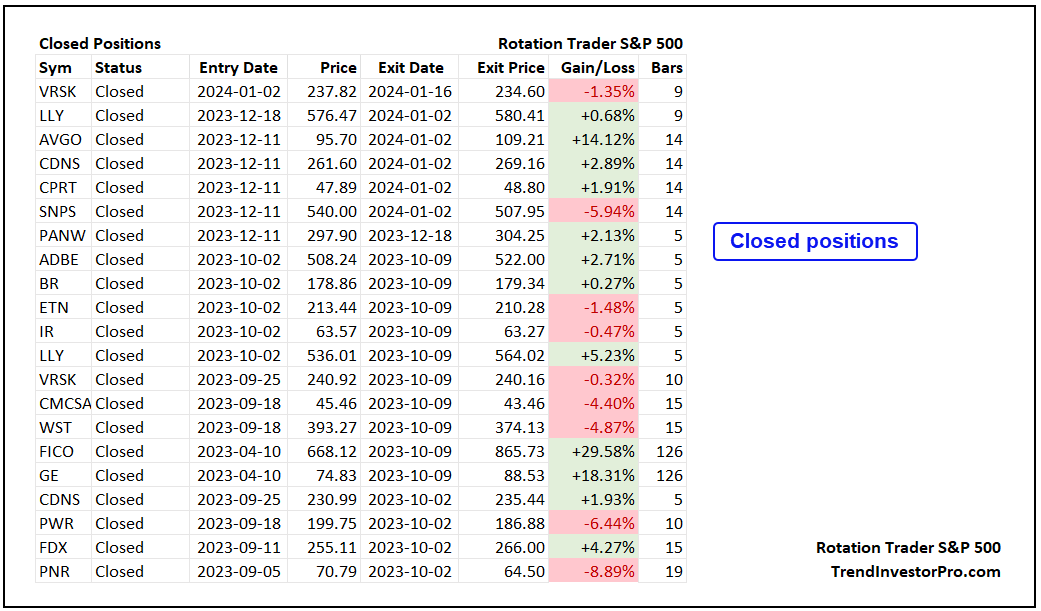
The next table shows the last 20 closed positions. This table includes the entry date, the exit date, the percentage gain/loss and bars held. Bars represent trading days (no weekends or holidays). 20 bars is the equivalent of four weeks and 126 bars is around six months. Notice that FICO and GE were held for six months.
Condition and Rank Tables
The sample table below shows the conditions and rankings for the top 20 S&P 500 stocks (w/o financials) on January 19th.
- Market CBM: current signal for Composite Breadth Model (bull or bear market)
- GicsID: industry group code based on the S&P Gics Standard (here)
- Min&Max Volatility: Pass = stocks meeting the min and max volatility thresholds
- (Min filters out takeover candidates (low vol). Max filters out excessive risk (high vol))
- eSlope Uptrends: Pass = stocks in uptrends on both timeframes
- (60 and 120 day Exponential Slopes values are positive)
- Conditions: Pass = stocks that passed all conditions (eligible for ranking)
- ROC-OffSet20: the value for volatility-adjusted ROC 20 days ago
Click a column heading to sort. For a two-column sort, press-hold the shift key and click two column headings. Use the search box to isolate a term (i.e. XLK or a GicsID).
(Sample) Rotation Trader S&P 500 - (close: Fri 19-Jan-2024)
| Market (CBM) | Rank | Sym | Sector | GicsID | FullName | Min&Max Volatility | eSlope Uptrends | Conditions | ROC-OffSet20 | Signal | Chart Link |
|---|---|---|---|---|---|---|---|---|---|---|---|
| Bull | 1 | AKAM | XLK | 45102030 | Akamai Tech | Pass | Pass | Pass | 53.13 | - | AKAM |
| Bull | 2 | CMG | XLY | 25301040 | Chipotle Mexican Grill | Pass | Pass | Pass | 39.18 | - | CMG |
| Bull | 3 | LLY | XLV | 35202010 | Eli Lilly and Co | Pass | Pass | Pass | 35.68 | - | LLY |
| Bull | 4 | NVDA | XLK | 45301020 | NVIDIA | Pass | Pass | Pass | 33.53 | - | NVDA |
| Bull | 5 | PHM | XLY | 25201030 | Pultegroup | Pass | Pass | Pass | 33.28 | - | PHM |
| Bull | 6 | ANET | XLK | 45201020 | Arista Networks | Pass | Pass | Pass | 33.06 | - | ANET |
| Bull | 7 | UBER | XLI | 20304040 | Uber Tech | Pass | Pass | Pass | 32.81 | - | UBER |
| Bull | 8 | GE | XLI | 20101010 | General Electric Co | Pass | Pass | Pass | 32.14 | - | GE |
| Bull | 9 | NOW | XLK | 45103020 | ServiceNow | Pass | Pass | Pass | 31.50 | - | NOW |
| Bull | 10 | META | XLC | 50203010 | Meta Platforms A | Pass | Pass | Pass | 31.28 | - | META |
| Bull | 11 | FICO | XLK | 45103010 | Fair Isaac | Pass | Pass | Pass | 30.40 | - | FICO |
| Bull | 12 | GRMN | XLY | 25201010 | Garmin Ltd | Pass | Pass | Pass | 29.52 | - | GRMN |
| Bull | 13 | ADBE | XLK | 45103010 | Adobe | Pass | Pass | Pass | 29.02 | - | ADBE |
| Bull | 14 | MSFT | XLK | 45103020 | Microsoft | Pass | Pass | Pass | 28.98 | - | MSFT |
| Bull | 15 | PTC | XLK | 45103010 | PTC | Pass | Pass | Pass | 28.77 | - | PTC |
| Bull | 16 | NFLX | XLC | 50202010 | Netflix | Pass | Pass | Pass | 28.64 | - | NFLX |
| Bull | 17 | AMZN | XLY | 25503030 | Amazon.com | Pass | Pass | Pass | 28.64 | - | AMZN |
| Bull | 18 | RCL | XLY | 25301020 | Royal Caribbean Cruises Ltd | Pass | Pass | Pass | 27.70 | - | RCL |
| Bull | 19 | DHI | XLY | 25201030 | DR Horton | Pass | Pass | Pass | 27.38 | - | DHI |
| Bull | 20 | BR | XLI | 20202030 | Broadridge Financial Solutio | Pass | Pass | Pass | 27.01 | - | BR |
The usual disclaimers apply for the strategies and the analysis on TrendInvestorPro. Past performance does not guarantee future performance. You and you alone are responsible for your investment and trading decisions. Do your own due diligence.
Thanks for tuning in and have a great day!