High-beta and risk-on ETFs are leading the market here in 2023 with big surges the last five weeks. Many triggered bullish trend signals, but they are also short-term overbought and ripe for a rest. Conversely, low-beta and risk-off ETFs corrected over the last five to ten weeks and have bullish setups working on the charts. Elsewhere, there were some shakeups in the intermarket arena as the 10-yr Treasury Yield and Dollar surged. These surges weighed on precious and industrial metals. Further strength in the 10-yr Treasury Yield would be positive for the Dollar and this could keep the pressure on metals.
About the ETF Trends, Patterns and Setups Report
This report contains discretionary chart analysis based on my interpretation of the price charts. This is different from the fully systematic approach in the Trend Composite strategy series. In this ETF Trends, Patterns and Setups report, I am looking for leading uptrends and tradable setups within these uptrends. While I use indicators to help define the trend and identify oversold conditions within uptrends, the assessments are mostly based on price action and the price chart (higher highs, higher lows, patterns in play). Sometimes the chart assessment can be at odds with the indicators.
Report Schedule
Tuesday – 7 Feb: Market/ETF Report and ETF Trend/Rank Table
Wednesday – 8 Feb: Market/ETF Video and ETF Trend/Rank Table Update
Thursday – 9 Feb: All Weather Bull-Bear ETF Strategy Update and Strategy Table Review
I am working on signal tables and a page to track performance for three strategies currently running at TrendInvestorPro (see list below). I also plan on creating a single page to track the recent signals for easier tracking. These should be up and running by the end of the month. You can find the current signal tables on the main analysis page and here are links to the strategy articles.
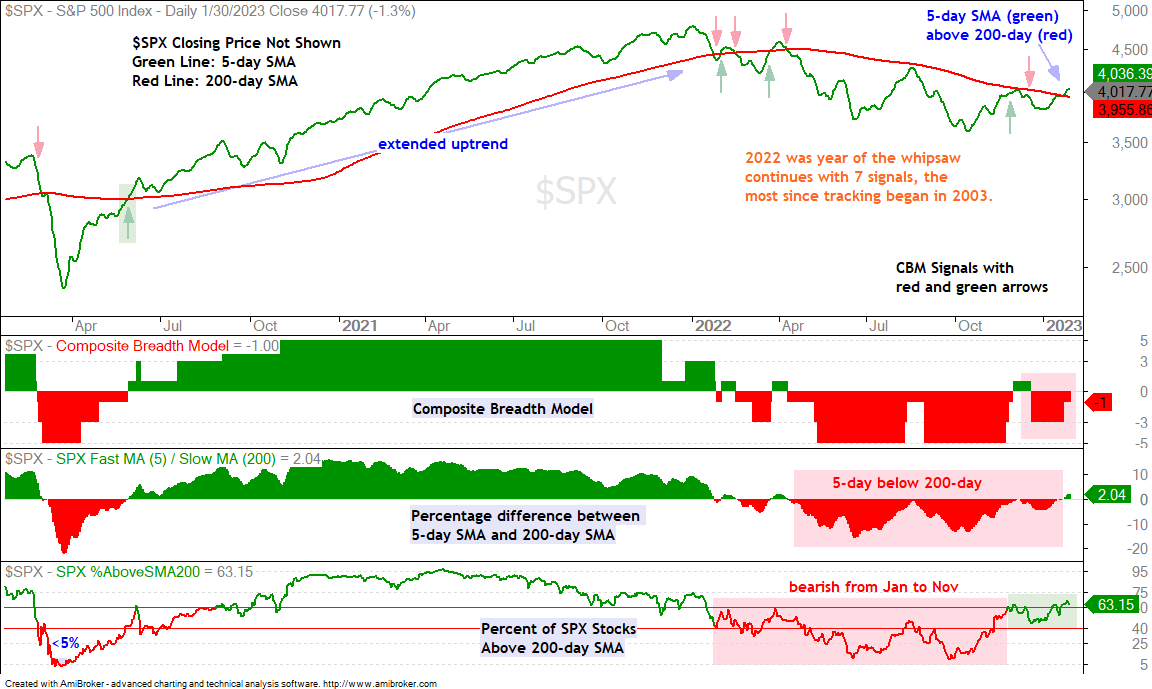
The Composite Breadth Model turned positive with a move to +3 on January 31st. The 5-day SMA for the S&P 500 is above the 200-day SMA and around 69% of S&P 500 stocks are above their 200-day SMAs, which is the highest level since January 2022.
SPY Forges Higher High
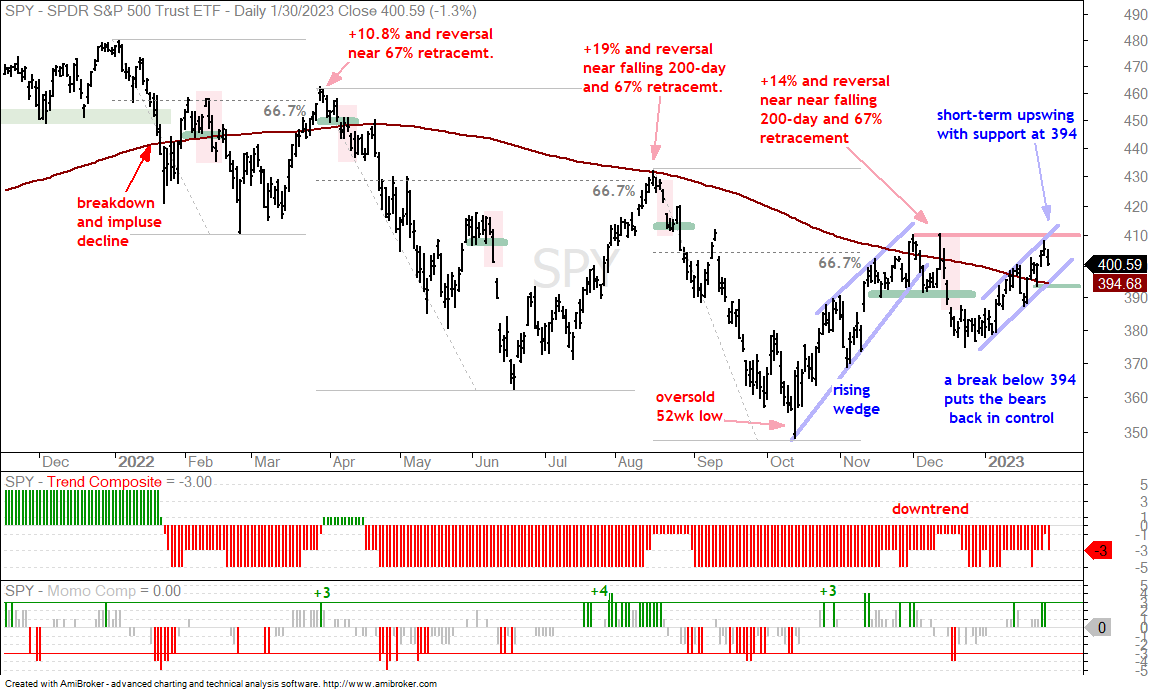
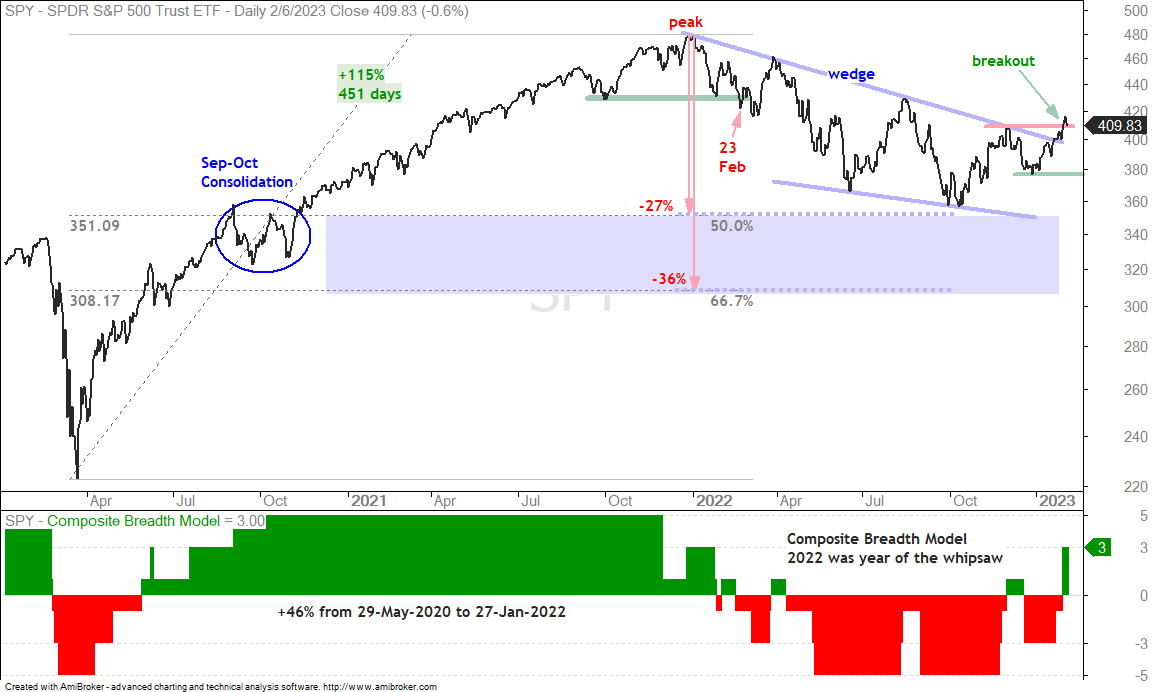
SPY is in an uptrend with a higher low in December and a higher high in early February. This uptrend coincides with the Trend Composite turning positive four days ago. On a closing basis, SPY is up around 15% from the October low and 9% from the December low. The ETF is short-term overbought and this could lead to a consolidation or pullback. The 390-400 area is the first support zone to watch for a bounce. I will mark key support at 375 for now.
QQQ Confirms Double Bottom
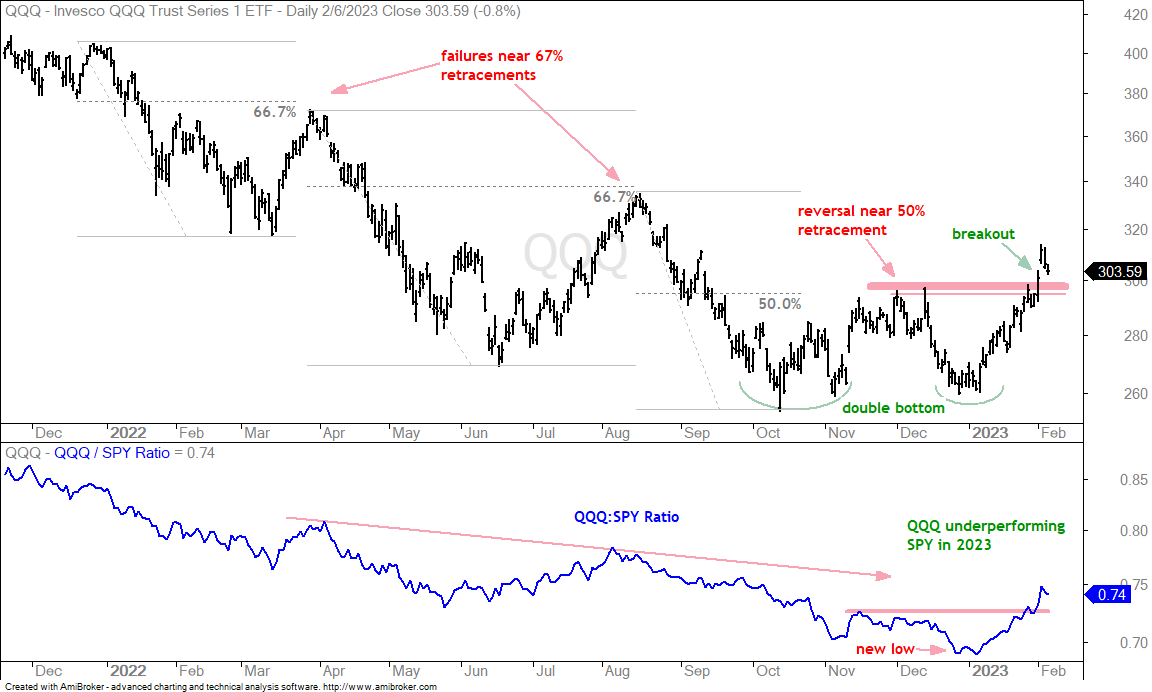
QQQ confirmed its double bottom with a break above the intermittent high last week. There are two lows around 260 and a resistance zone in the 295-300 area. QQQ broke out with a big surge and this breakout forges a higher high (uptrend). QQQ is up around 17% since late December and also quite extended short-term. This increases the chances for a short-term pullback or consolidation.
IWM Breaks Resistance
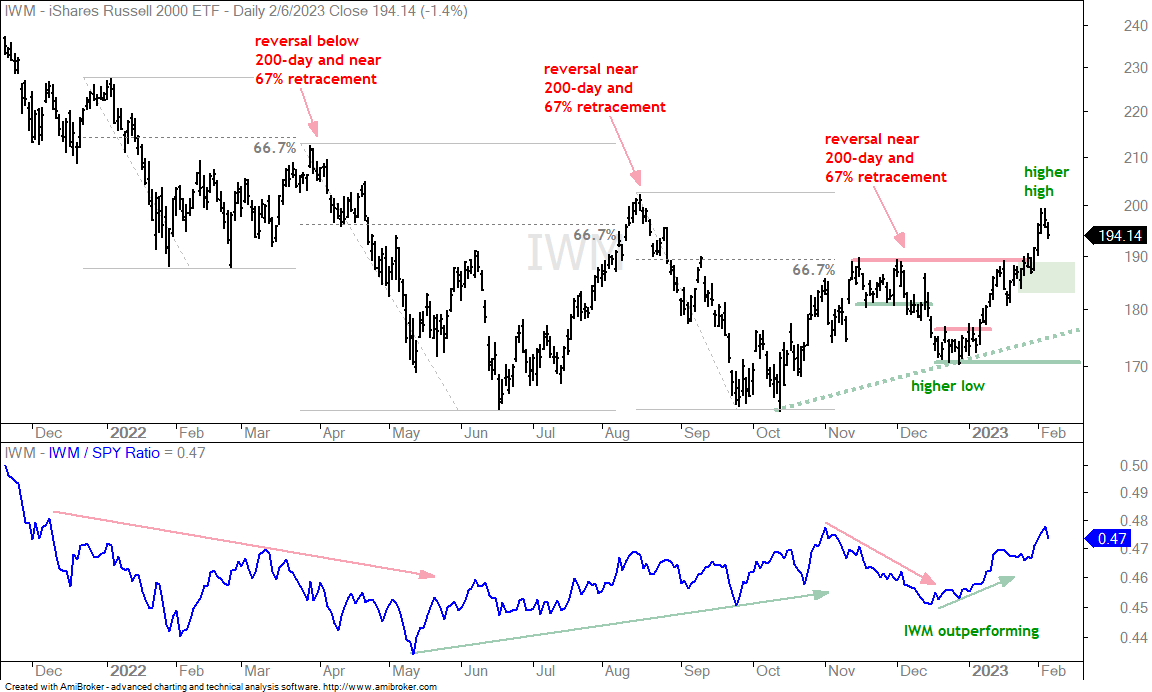
The Russell 2000 ETF (IWM) also formed a higher low from October to December and broke resistance to forge a higher high. The ETF is up some 14% since mid December and short-term overbought. Should we see a throwback, the breakout zone turns into the first support zone to watch. A throwback is a pullback to the breakout zone that offers a second chance to partake in the breakout. The green shading marks a support zone in the 183-190 area.
TLT Looks Toppy as Yields Surge
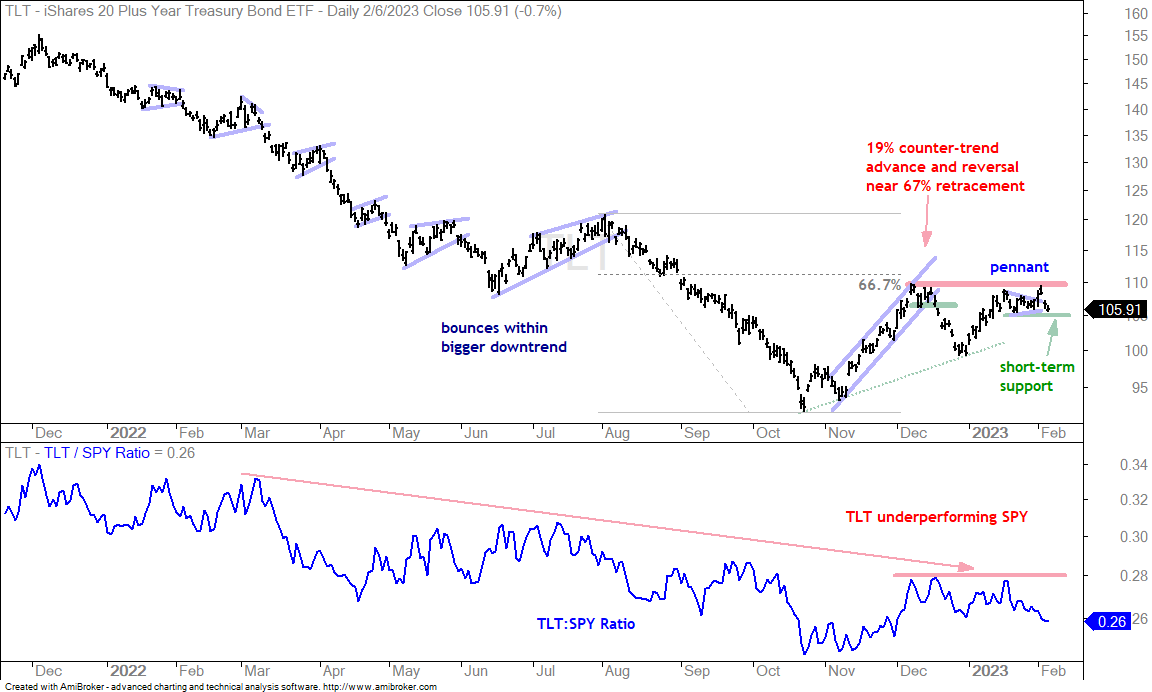
The 20+ Yr Treasury Bond ETF (TLT) surged with the stock market the first 11 days of January and then stalled with a pennant. Pennants are short-term consolidations and their trading bias is based on the prior move, which was up. TLT broke out of the pennant on February 1st (Wednesday), but this breakout did not hold as TLT fell sharply the last two days. The long-term trend remains down because TLT did not break the December high. I marked short-term support at 105 and a break here would reverse the short-term upswing.
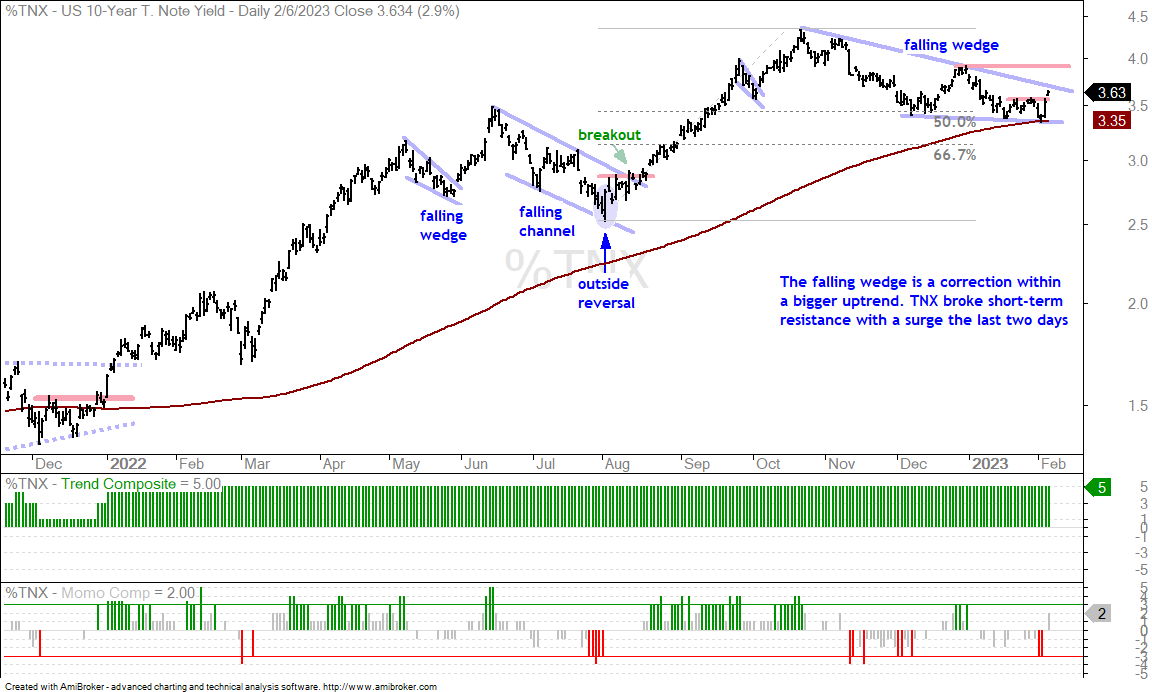
The next chart shows the 10-yr Treasury Yield with a falling wedge that returned to the rising 200-day SMA and retraced just over half of the prior advance. The pattern and the retracement amount are typical for corrections within bigger uptrends. A break above 3.9% would end the correction and target a move above 4.5%. Short-term, the swing within the wedge was down in January and TNX broke resistance with a surge the last two days. This short-term breakout is the early signal that increases the odds of a bigger wedge breakout.
Dollar Surges along with 10yr Yield
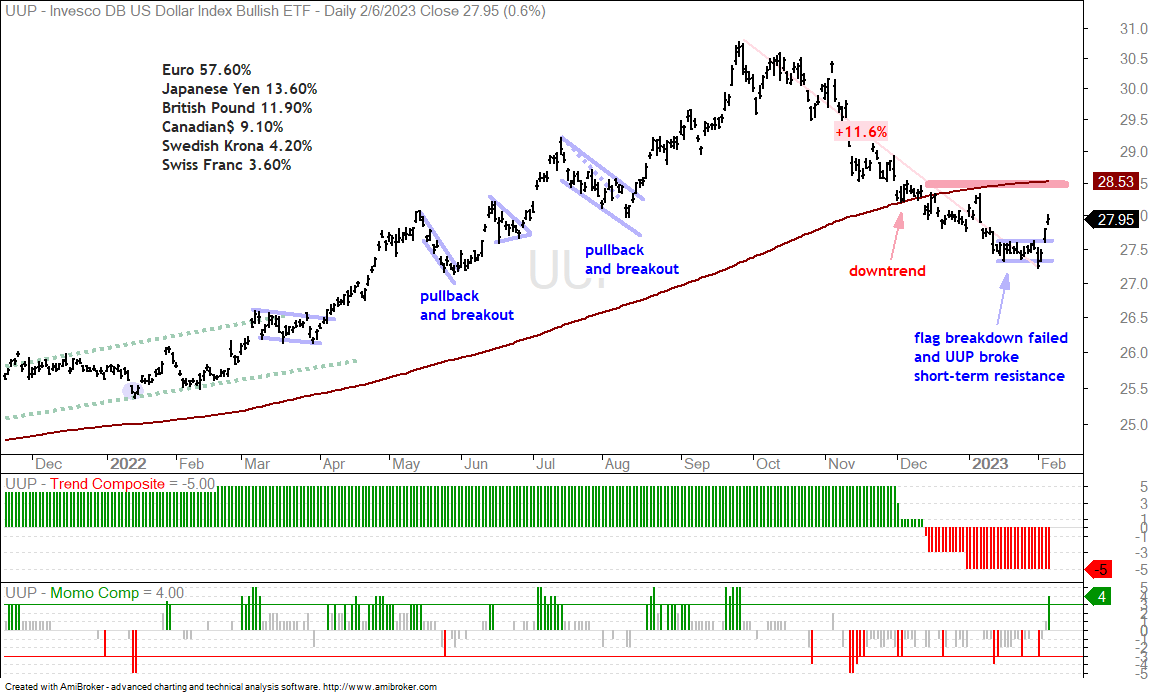
The Dollar Bullish ETF (UUP) surged 2.57% the last three days and broke short-term resistance in the process. This breakout reverses the immediate downtrend, but UUP remains below the 200-day SMA and the January high. Further strength above 28.53 is needed to put the long-term uptrend back in play.
Gold and Precious Metals Follow Dollar Lower
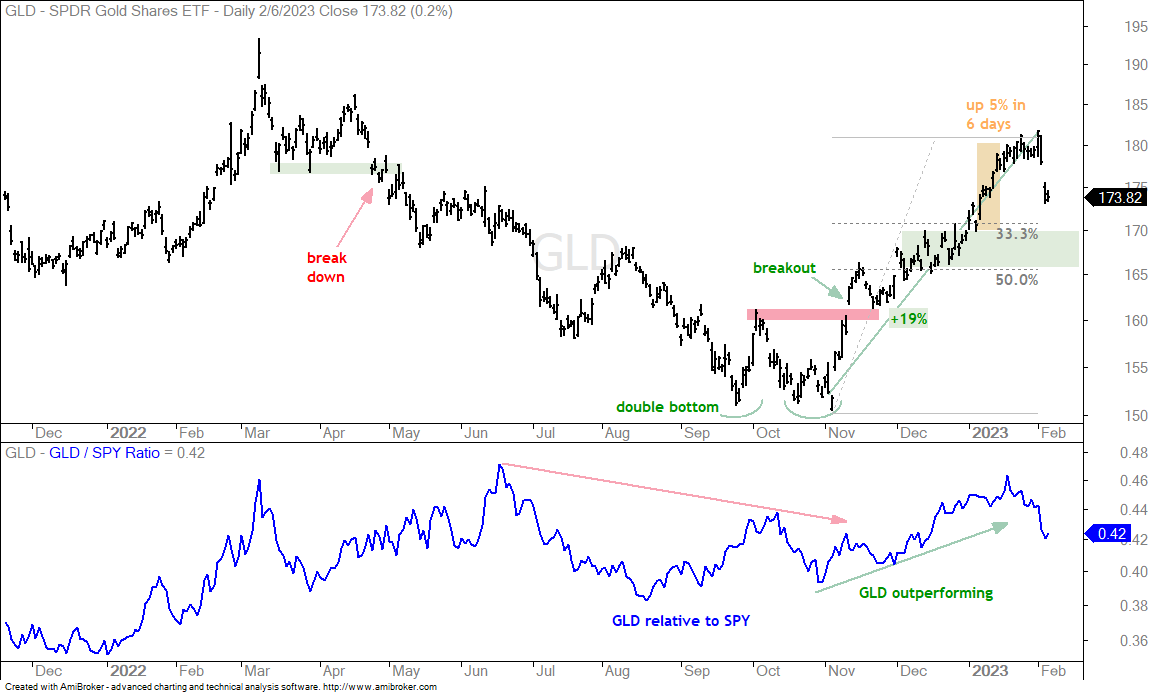
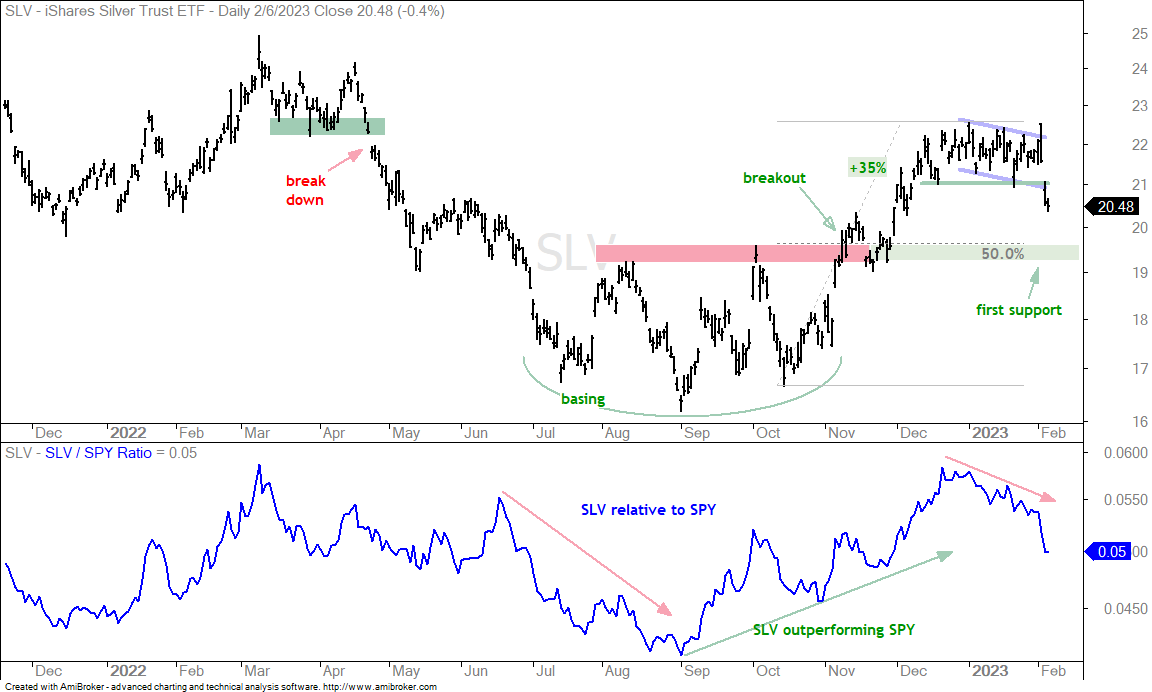
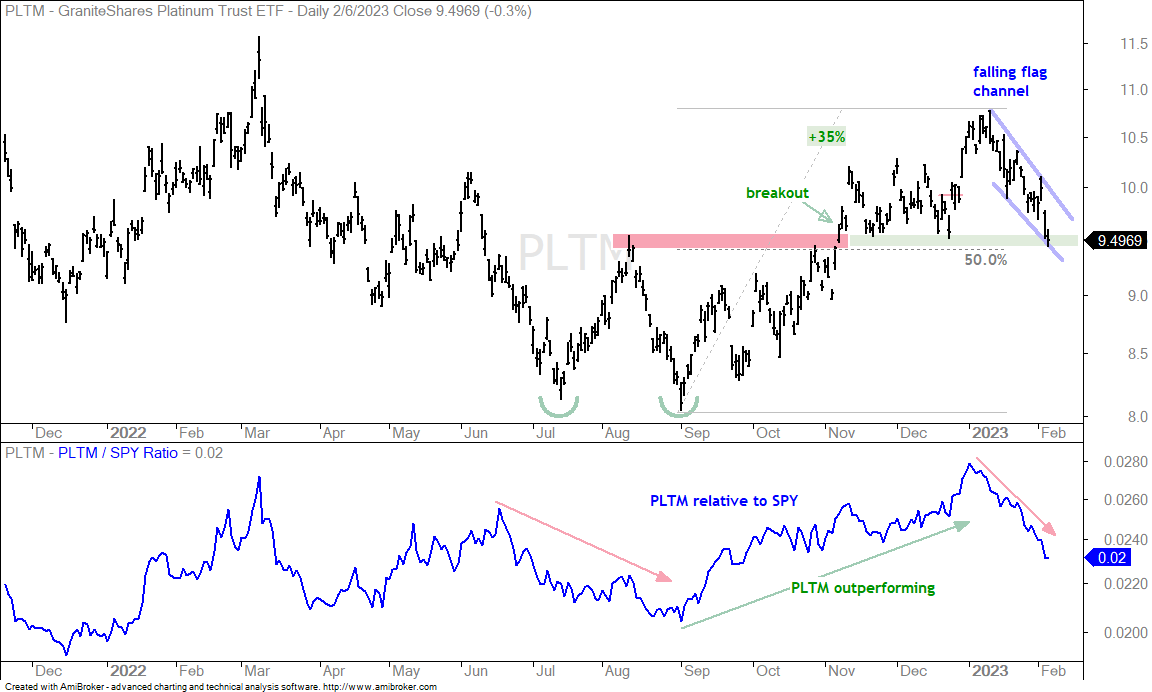
The Gold SPDR (GLD), Silver ETF (SLV) and Platinum ETF (PLTM) fell sharply the last three days, 4.3%, 7.2% and 3.49%, respectively. These three are highly correlated with gold in the driver’s seat. Silver fell much more than gold because it is really just a leveraged version of the yellow metal.
The first chart shows GLD surging 5% in 6 days and then pushing above 180 twice. GLD was overbought above 180 and vulnerable to a pullback or correction, which we got. I am marking first support using the 33-50 percent retracements and the December consolidation (green shading). Chart-wise, this is the first area to watch for firmness and a bounce.
The next chart shows SLV breaking support at 21. Broken resistance and the 50% retracement mark first support in the 19.3-19.5 area.
The next chart shows PLTM with a 35% surge into early January and an 11% decline into early February. This decline retraced half of the prior advance and returned to support in the 9.5 area. A falling flag or channel also formed. A move above 10 would break channel resistance and reverse the short-term decline.
High-Beta Risk-On ETFs Lead, but Become Overbought
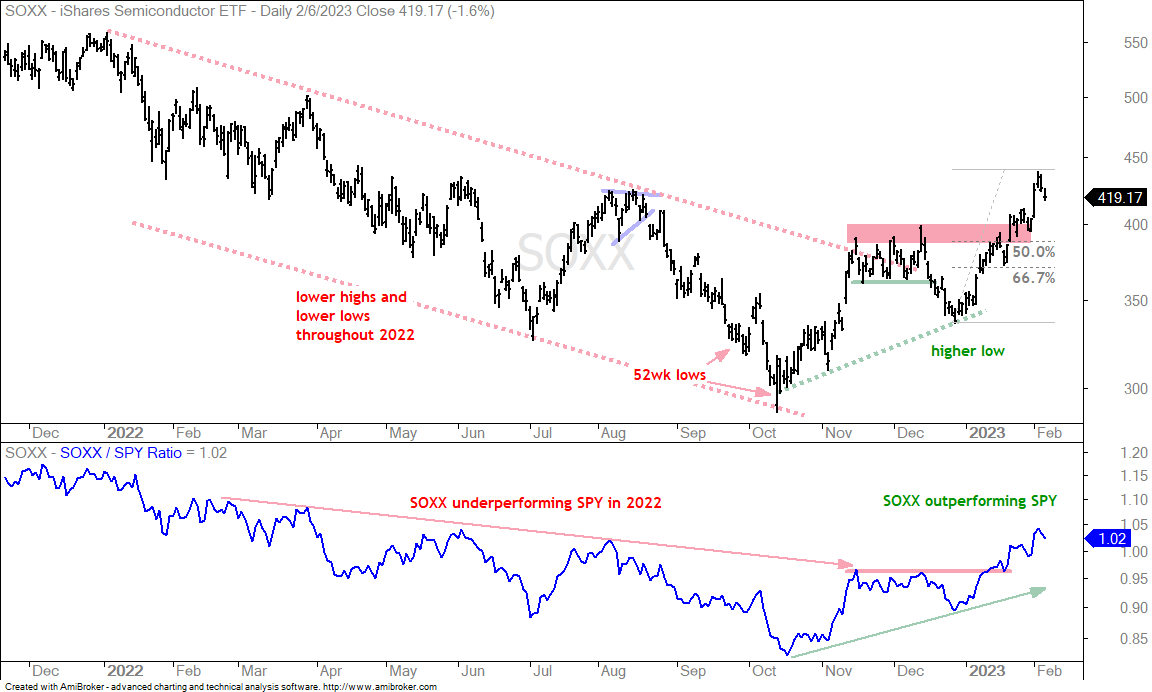
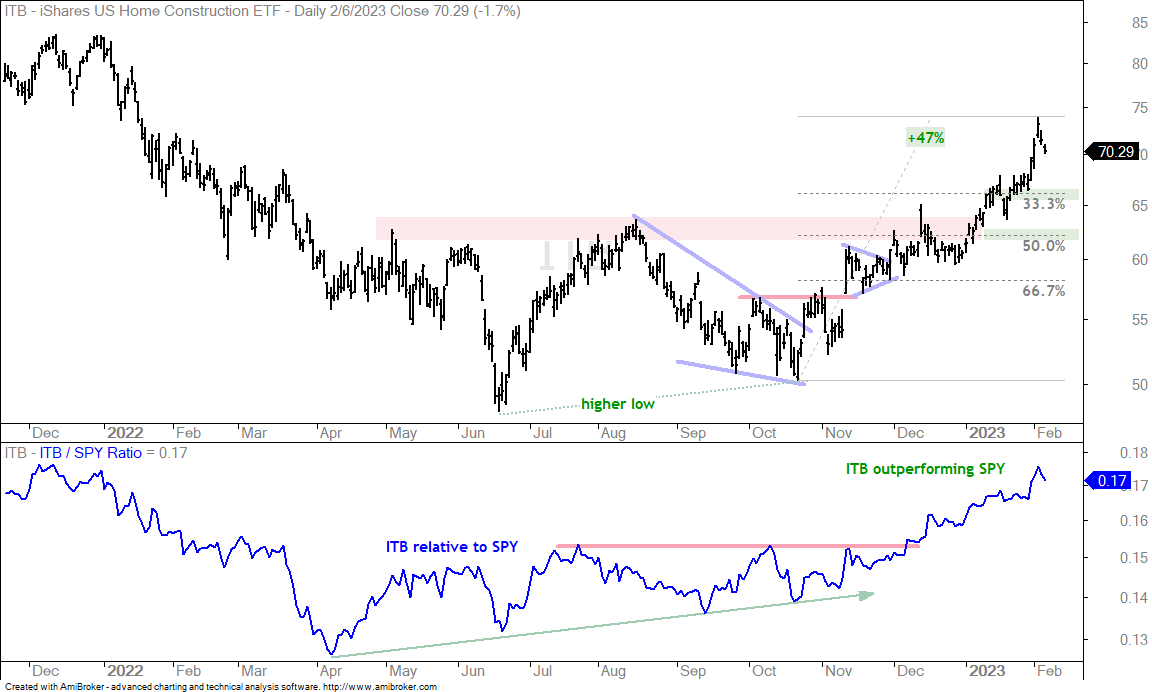
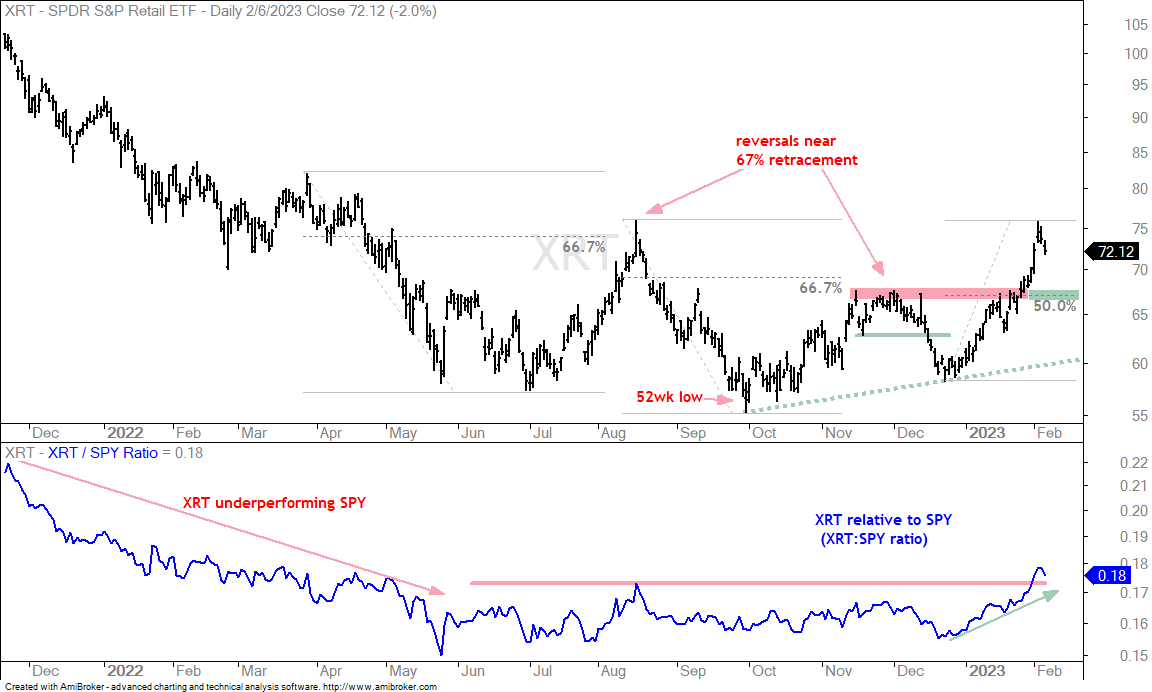
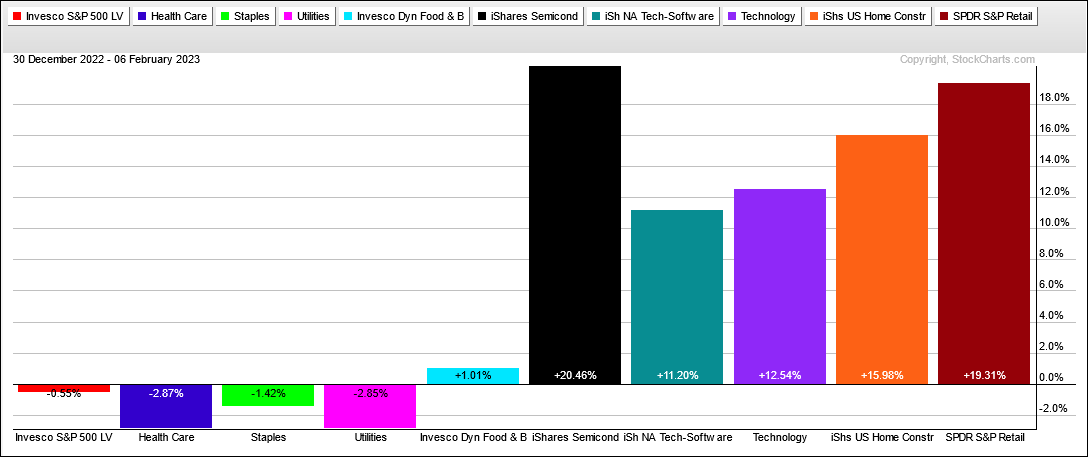
Money moved into high-beta and risk-on ETFs with a vengeance in 2023. This rotation was in stark contrast to 2022, a year that favored low-beta and risk-off ETFs. The move into risk-on ETFs pushed the Composite Breadth Model into positive territory and we are in a bull market until proven otherwise. There is just one issue: The leading ETFs in 2023 are short-term overbought and ripe for a rest. Year-to-date, the Semiconductor ETF (SOXX) is up 20.5%, the Retail SPDR (XRT) is up 19.31%, the Home Construction ETF (ITB) is up 16%, the Technology SPDR (XLK) is up 12.5% and the Russell 2000 ETF (IWM) is up 11.34%.
Before looking at some charts, note that it is common for a new uptrend to start with a big surge and short-term overbought conditions. Also note uptrends are not straight up and there will be pullbacks or consolidations along the way. We may, however, need to be patient. It is these pullbacks and consolidations that provide the opportunities to partake in said uptrend. I am using broken resistance levels and retracements to guesstimate future support levels should we see a pullback. The first chart shows SOXX with a broken resistance zone in the 390-400 area. Broken resistance turns first support and a “throwback” to this area could provide the setup for a bounce. The 390 area also marks a 50% retracement of the December-February surge.
Admittedly, predicting future support zones is largely guess work. The only think we really know right now is that these ETFs are short-term overbought and ripe for a rest. In an ideal world, we would see a falling flag or wedge retrace 33-50 percent of the prior advance for a tradable setup. The next chart shows ITB with first support in the 66 area (33 percent retracement) and second support in the 62 area (50 percent retracement).
The next chart shows XRT with broken resistance turning into first support in the 67 area. This area also marks a 50% retracement of the December-February advance.
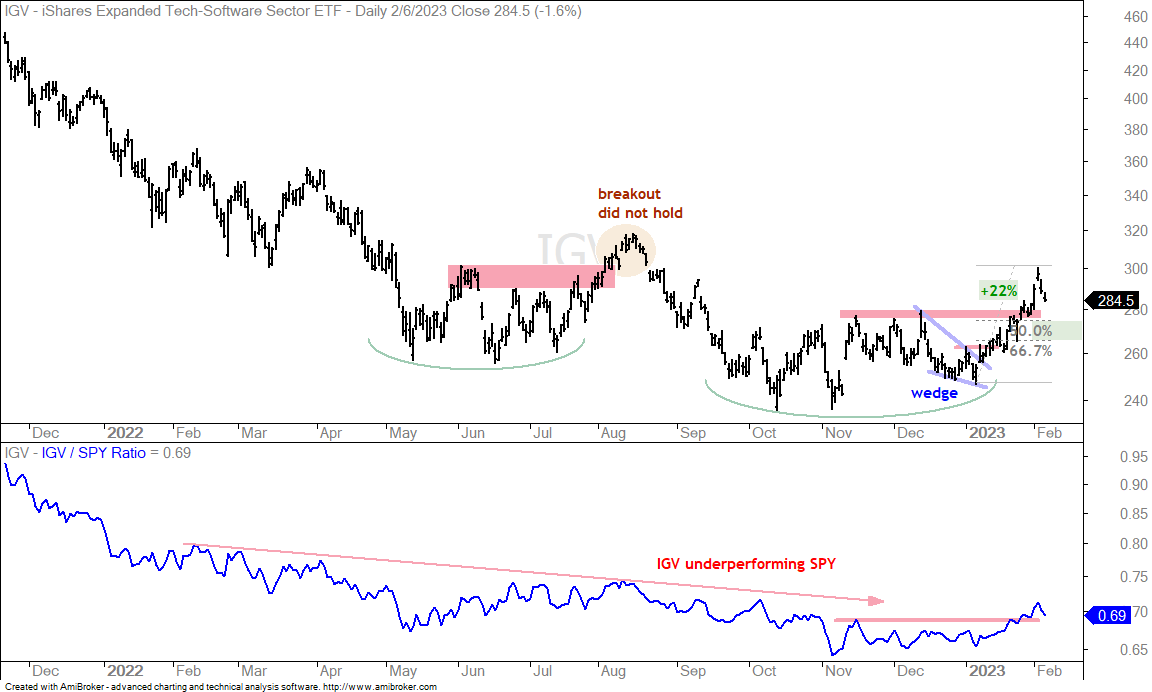
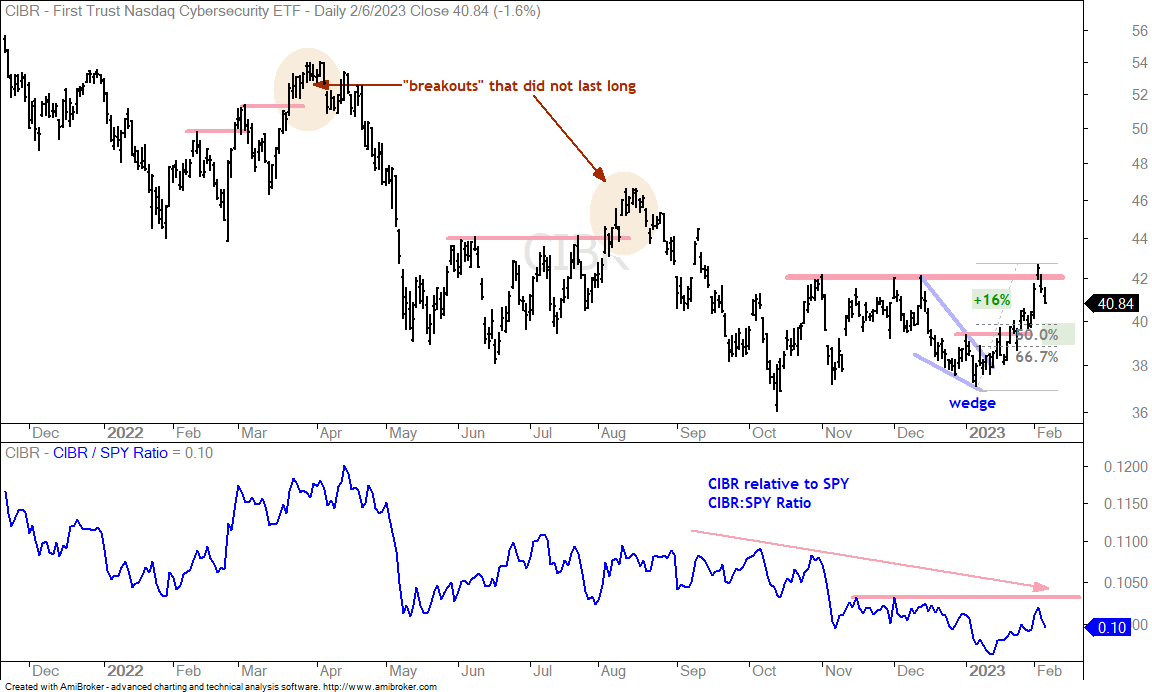
Software and Cybersecurity Break Out and Drop
The Software ETF (IGV) and the Cybersecurity ETF (CIBR) broke above resistance zones and forged higher highs. Admittedly, I am concerned that a rise in the 10-yr Treasury Yield could throw cold water on the high-beta trade. These two are also short-term overbought after big advances from early January to early February. The first chart shows IGV with a 22% surge and breakout. The green shading marks the 50-67 percent retracement zone and this is the first area to watch for support on a pullback.
The next chart shows CIBR with a brief break above the resistance zone at 42 and a sharp pullback the last two days. The green shading marks the 50-67 percent retracement zone for first support. The indicator window shows CIBR still lagging SPY overall.
Low-Beta Risk-Off ETFs Setting Up Bullish
The low-beta and risk-off ETFs are mirror images of the high-beta and risk-on ETFs this year. SOXX, IGV, XLK, ITB and XRT are up between 11 and 20.5 percent this year. Meanwhile, the S&P 500 Low Volatility ETF (SPLV), Healthcare SPDR (XLV), Consumer Staples SPDR (XLP) and Utilities SPDR (XLU) are down between .5 and 3 percent. The Food & Beverage ETF (PBJ) sports a 1% gain.
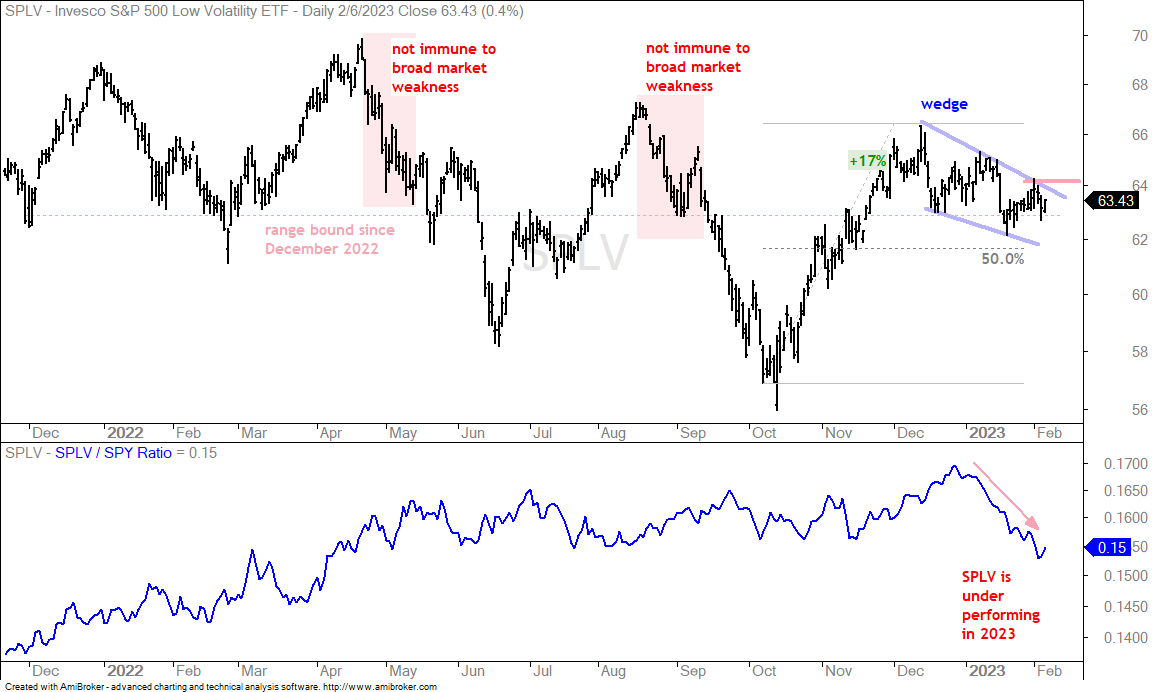
My basic chart strategy is to look for tradable pullbacks after advances or within uptrends and the low-beta risk-on ETFs remain with bullish setups. The first chart shows SPLV with a 17% advance and a falling wedge that retraced a little less than half of this advance. A break above the early February high would reverse the short-term downtrend and signal a continuation of the prior advance.
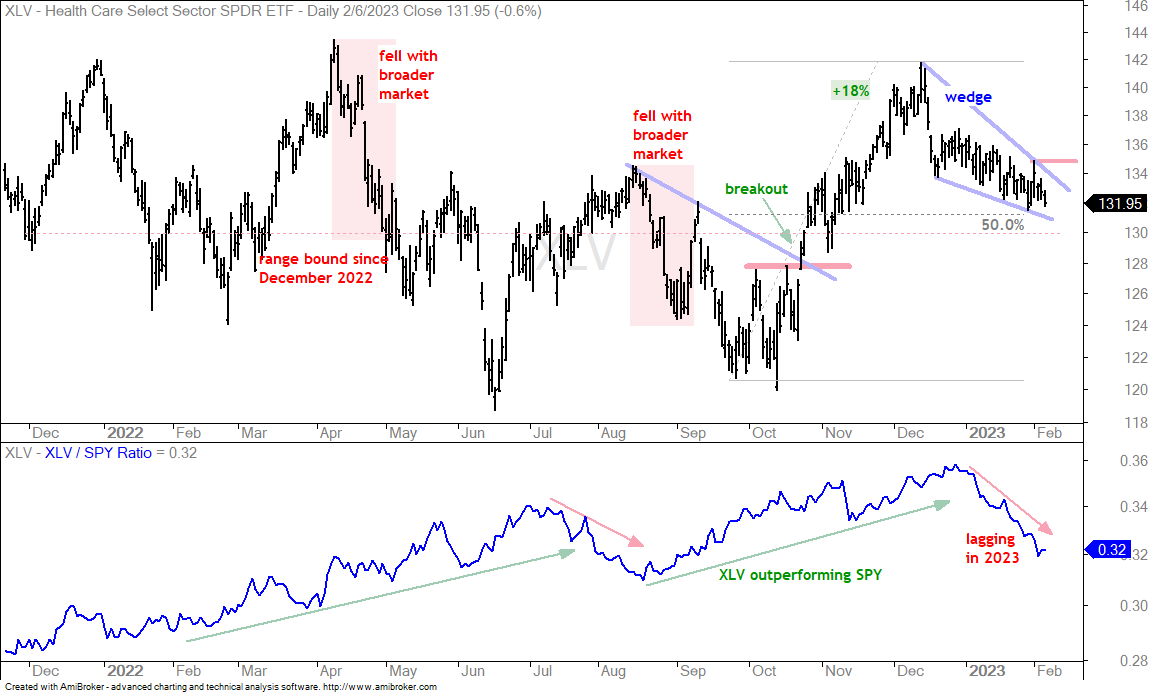
The next chart shows XLV with a pop last Wednesday and a drop the next four days. This keeps the falling wedge in play and a break above 135 is needed to reverse the short-term downtrend.
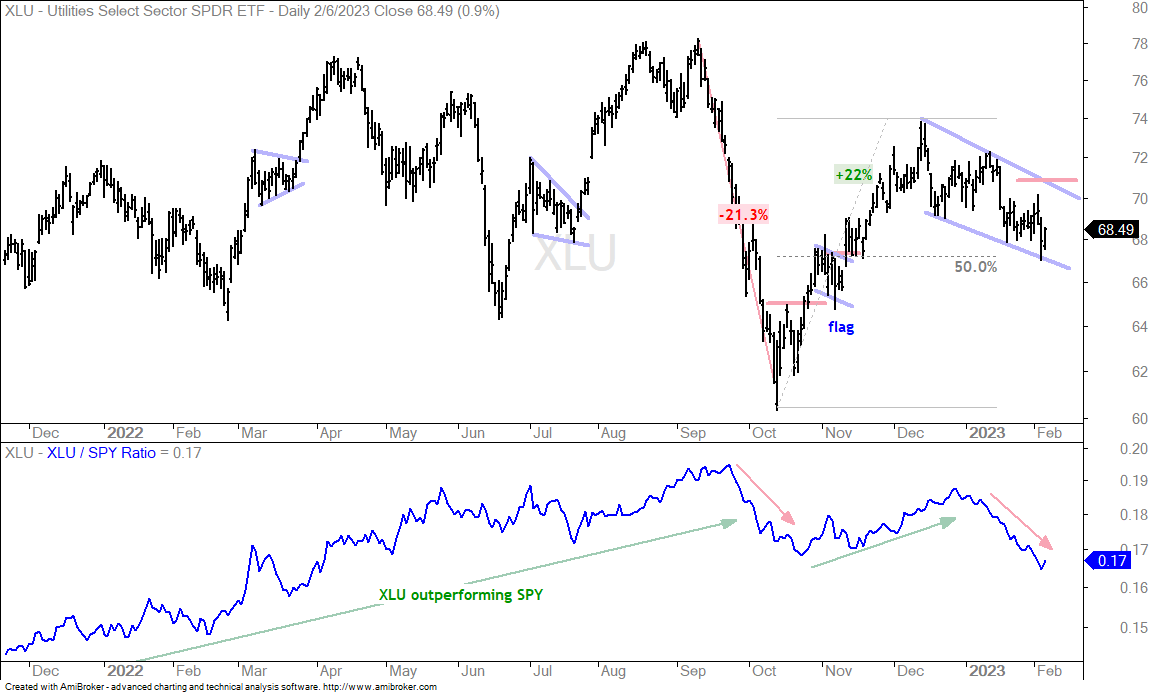
The next chart shows XLU with a falling wedge and a 50% retracement. A break above 71 would reverse the short-term downtrend.
The next chart shows XLV with a pop last Wednesday and a drop the next four days. This keeps the falling wedge in play and a break above 135 is needed to reverse the short-term downtrend.
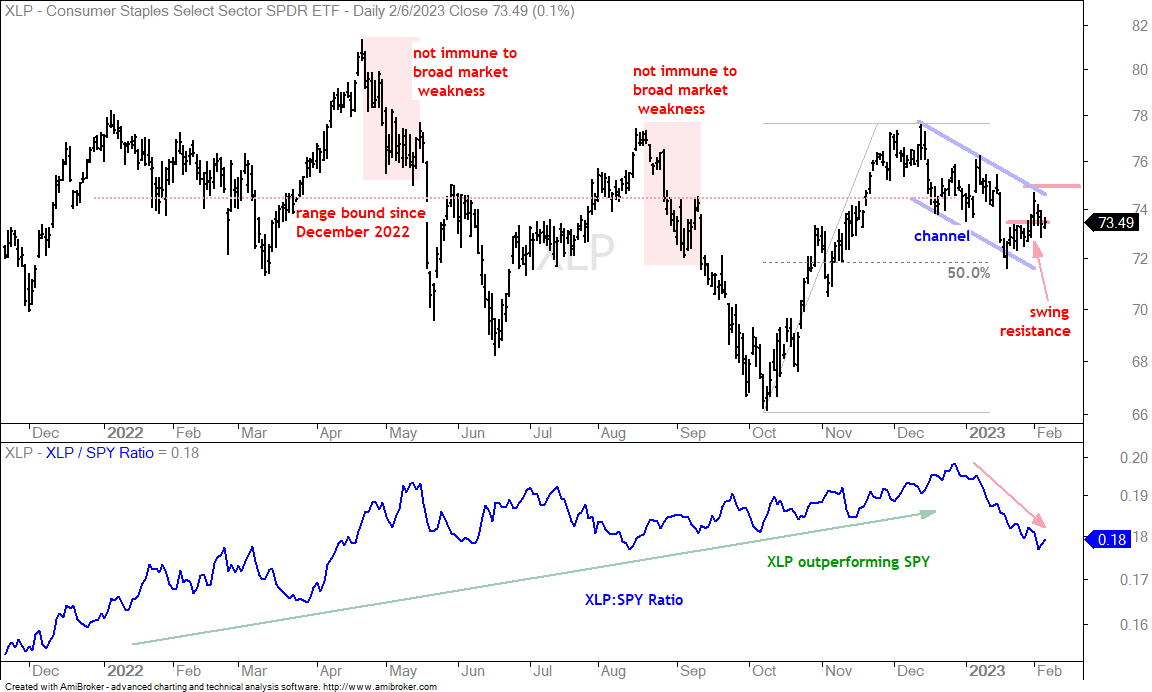
The next chart shows XLP with a short-term breakout last week (swing resistance). The falling channel remains the larger pattern and a break above 75 would be bullish.
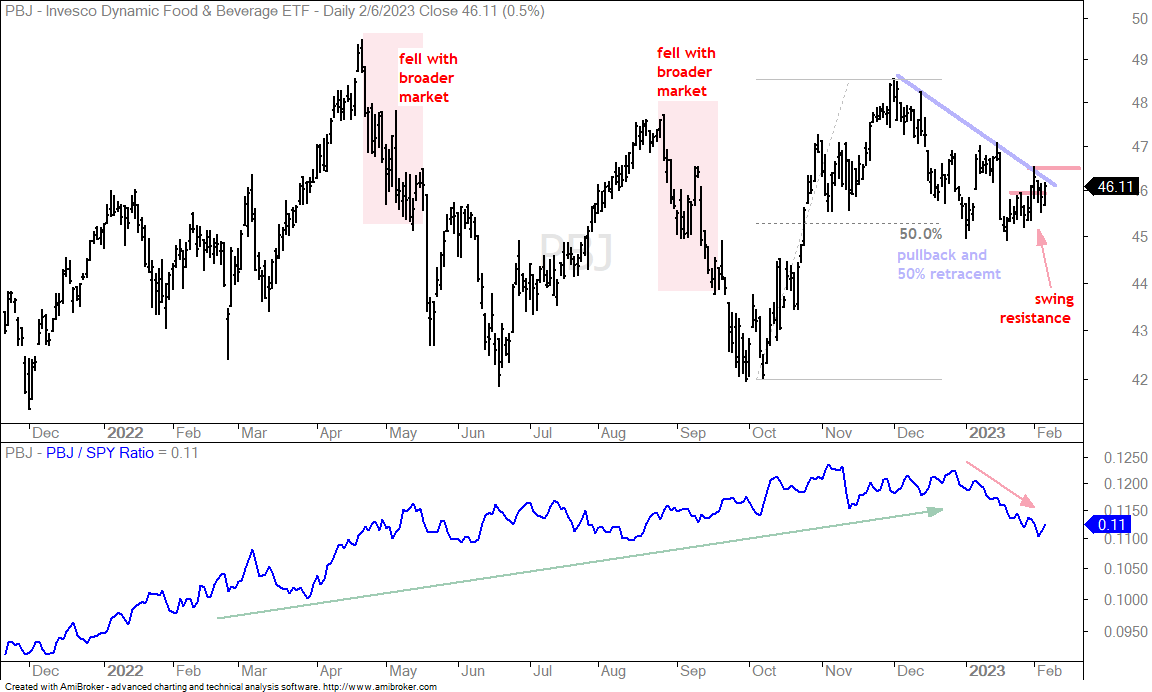
The next chart shows the Food & Beverage ETF (PBJ) retracing 50% of the October-December surge and finding support around 45 twice. The ETF broke swing resistance last week and a follow through break above 46.5 would reverse the short-term downtrend.
Insurance, Defense and Water are the Price Leaders
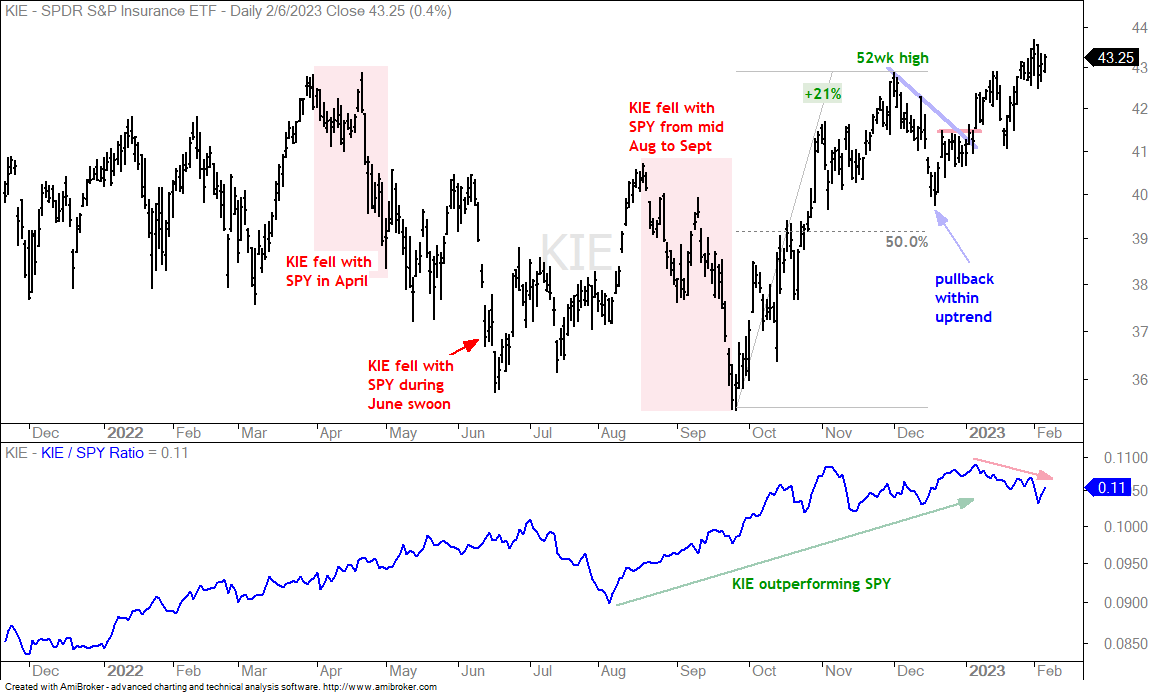
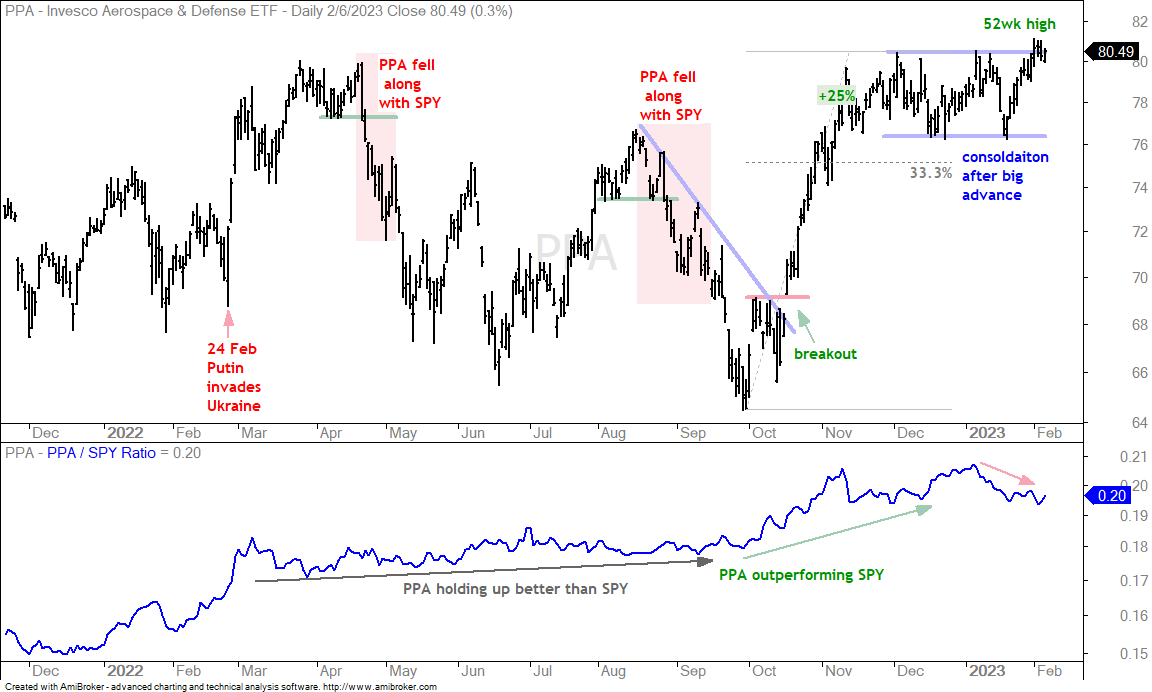
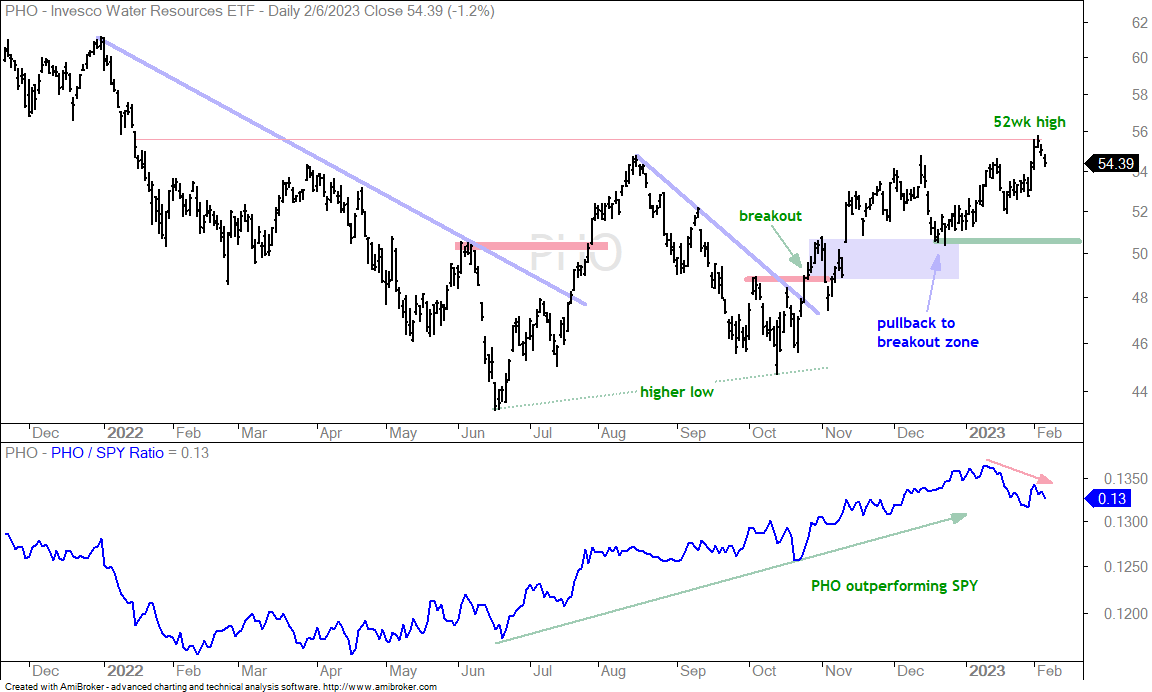
The Insurance ETF (KIE), Aerospace & Defense ETF (PPA) and Water Resources ETF (PHO) are the price leaders because they recorded 52-week highs in February. A momentum leader is an ETF that goes up more than the broader market (percentage terms). These ETFs are underperforming in 2023 because SPY is up more in percentage terms. A price leader is one that records a higher high or 52-week high when the others are still well short. SPY and many others are still well below their August highs and nowhere close to 52-week highs. KIE, PPA and PHO, in contrast, are above their August highs and recently hit 52-week highs. I do not see any setups on these three charts. Just leading price trends because of the 52-week highs.
XLE: Discretionary versus Systematic
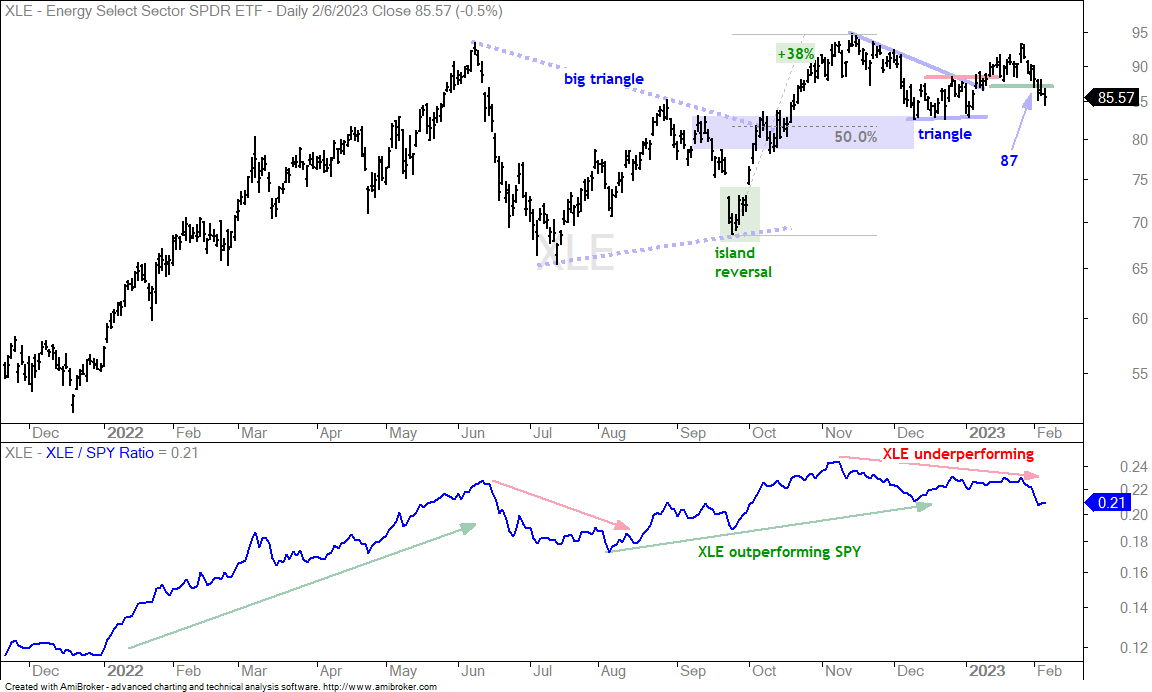
The Energy SPDR (XLE) highlights the difference between discretionary chart analysis and systematic trading. Chart analysis means we look for trends, patterns, setups and breakouts. As with economists, you can ask ten chartists their opinion and get eleven opinions. For XLE, I see a triangle, a triangle breakout and a failure to hold that breakout because XLE broke 87, which was my line in the sand. The indicator window sows the price-relative with a lower high from November to January as XLE lags SPY. The trend is not down on this chart and I am not turning bearish on XLE. The triangle breakout simply failed to hold.
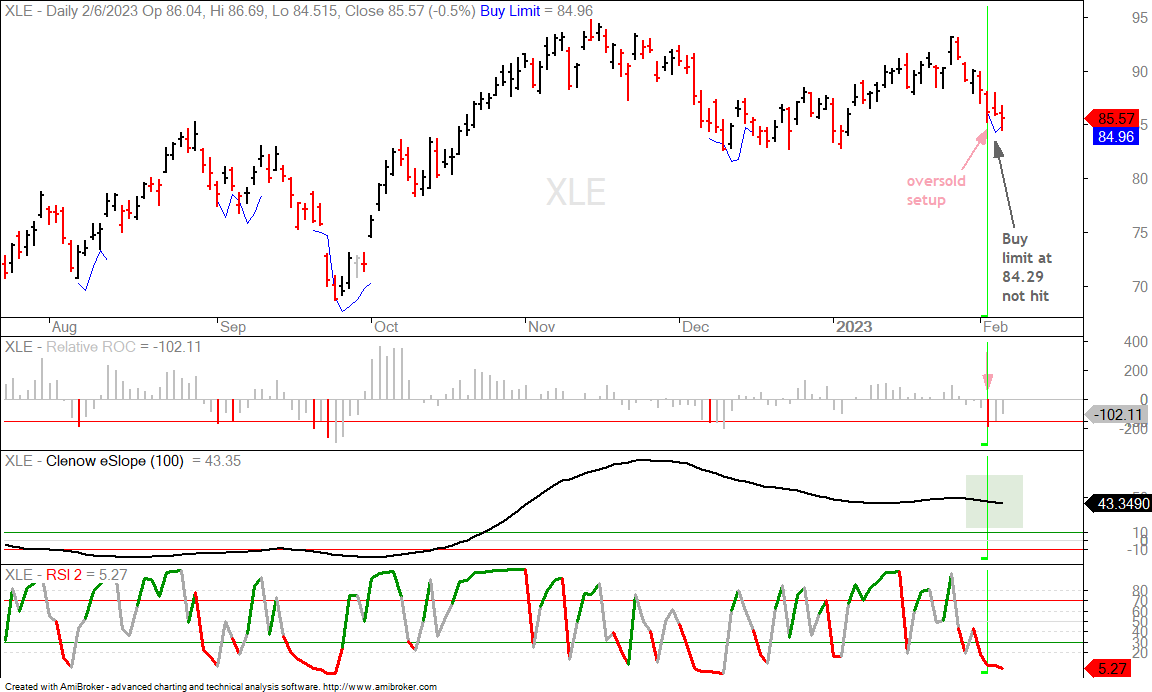
A systematic approach would show that the overall trend is up and XLE is short-term oversold after an 8% decline in seven days. This is a pullback within an uptrend and XLE is oversold. In fact, per the ETF mean-reversion strategy, the eSlope (100) was above 10 for an uptrend and Relative ROC dipped below -150 to become oversold (red arrows). The Buy Limit for the next day was 84.29, but XLE did not hit this level and the entry did not trigger. 65% of setups do not hit their Buy Limits. Systematically, it is back to waiting for another dip below -150 for an oversold setup.
In a separate, but related note, I am getting to where I must choose between discretionary chart analysis and a systematic approach. I think you know which way I am heading…