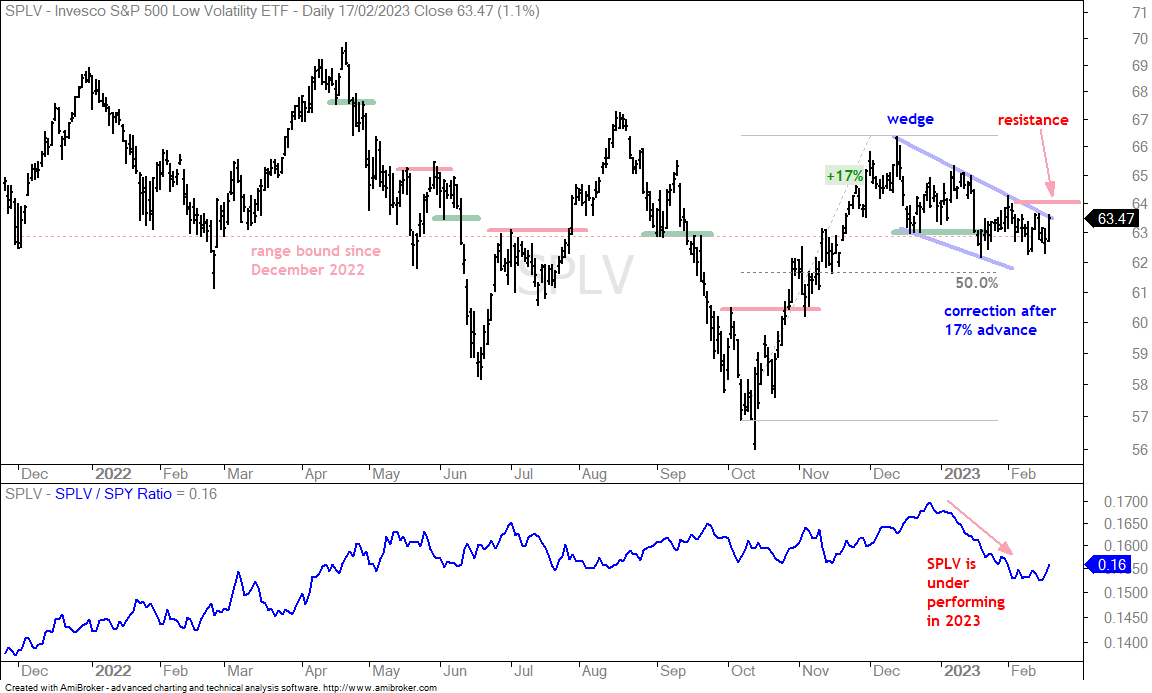
Stocks surged in January and then moved into pullback mode this month. As such, many ETFs formed falling flags, falling wedges or other short-term corrective patterns over the last three weeks. This includes the big three: SPY, QQQ and IWM. The market is in corrective mode as long as the big three are in short-term downtrends. I am also watching short-term support on four offensive sectors for clues that the pullback may be broadening. We do not know how long these pullbacks will last or how far they will extend. The Composite Breadth Model is bullish and the S&P 500 5-day SMA is above the 200-day SMA. This means the weight of the evidence is bullish for stocks. As such, these pullbacks are considered corrections within a larger bullish environment. Short-term breakouts, however, are needed to reverse these short-term downtrends and signal an end to the pullbacks. Today’s commentary will focus on these pullbacks. Friday’s report covered the bonds, the Dollar, gold, oil, breadth, the Composite Breadth Model and more.
About the ETF Trends, Patterns and Setups Report
This report contains discretionary chart analysis based on my interpretation of the price charts. This is different from the fully systematic approach in the Trend Composite strategy series. In this ETF Trends, Patterns and Setups report, I am looking for leading uptrends and tradable setups within these uptrends. While I use indicators to help define the trend and identify oversold conditions within uptrends, the assessments are mostly based on price action and the price chart (higher highs, higher lows, patterns in play). Sometimes the chart assessment can be at odds with the indicators.
Report Schedule
Tuesday – 21 Feb: Market/ETF Report
Wednesday – 22 Feb: Market/ETF Video
Friday – 24 Feb: Updates for the Systematic Strategies
Systematic Strategies and Tables
Here are the three active strategies and their respective tables.
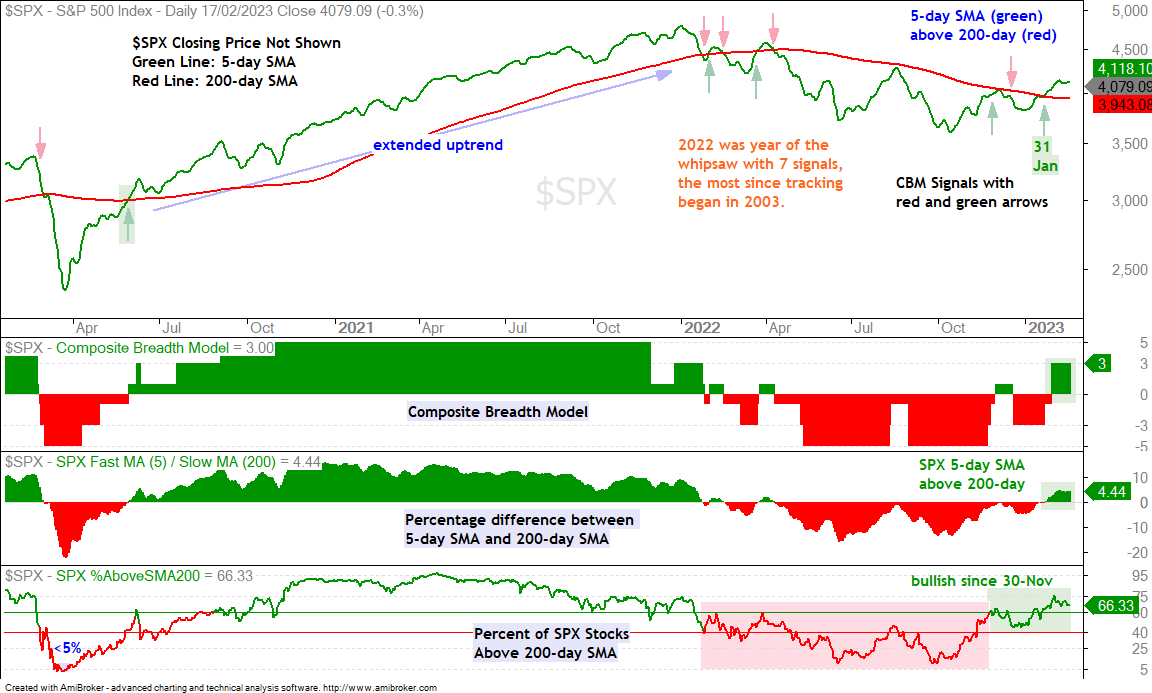
The Composite Breadth Model turned positive with a move to +3 on January 31st and the weight of the evidence is bullish for stocks. The 5-day SMA for the S&P 500 is above the 200-day SMA and around 66% of S&P 500 stocks are above their 200-day SMAs. This indicator surged to 76% on February 2nd and fell back over the last few weeks as fewer stocks held above this long-term moving average. This is not a bearish signal per se, but it shows that upside participation is waning and this could lead to a pullback.
I am watching both the CBM and the 5/200 cross for the next signal. The Composite Breadth Model is my main instrument for broad market timing and long-term performance is good. Past performance, however, does not guarantee rough patches or periods of underperformance. The 5/200 day SMA cross for the S&P 500 is part of the Composite Breadth Model. Friday’s report showed that the 5/200 cross performed better than the CBM in 2022, but not as good as the CBM when going back 20 years. Market swings have been quite large since January 2022 with six swings greater than 10% over the last 14 months. I would like to catch the next swing a little earlier. Both the CBM and 5/200 cross are bullish right now. Going forward, I will take the next signal from the first indicator to turn bearish.
SPY with Long-term Uptrend and Short-term Downtrend
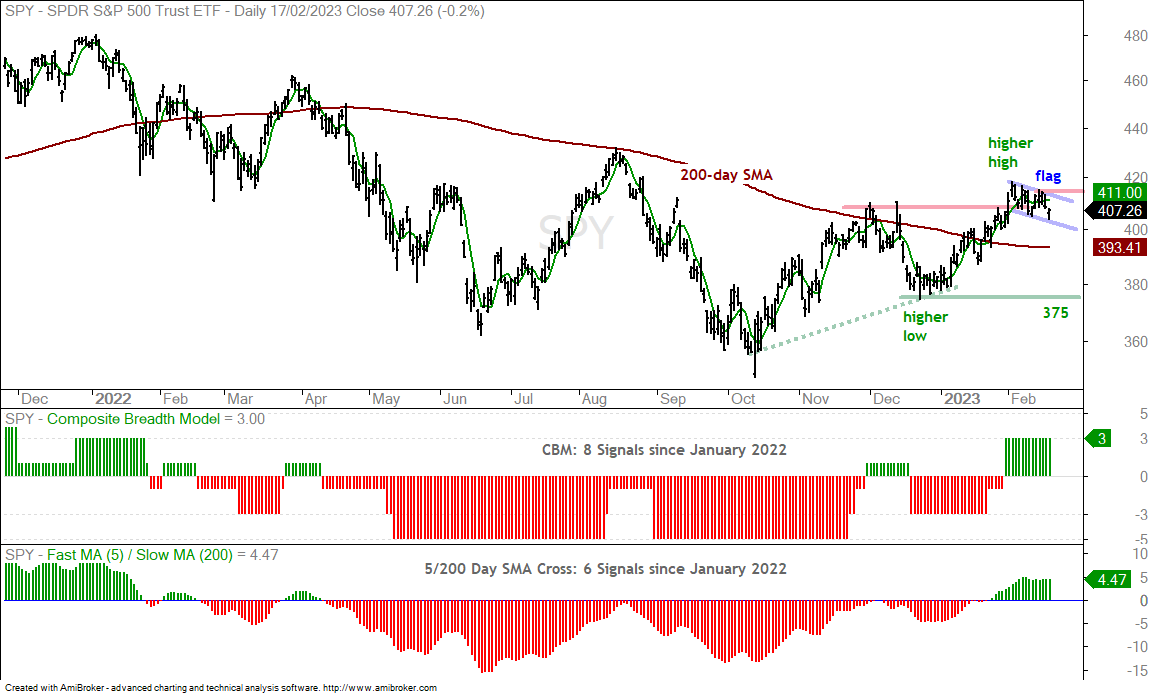
SPY has a higher low and higher high working from December to February (long-term uptrend). The short-term trend is down as the ETF fell in February with a falling flag taking shape. Flags are typically short-term continuation patterns that are dependent on the direction of the prior move for their bias. The prior move for SPY was up and this flag has a bullish bias. However, the short-term trend is down as long as the flag falls. A break above 415 is needed to reverse this short-term downtrend. Until such a reversal, this pullback could extend and we could see a test of the 200-day SMA.
QQQ with Short-term Pop and Drop
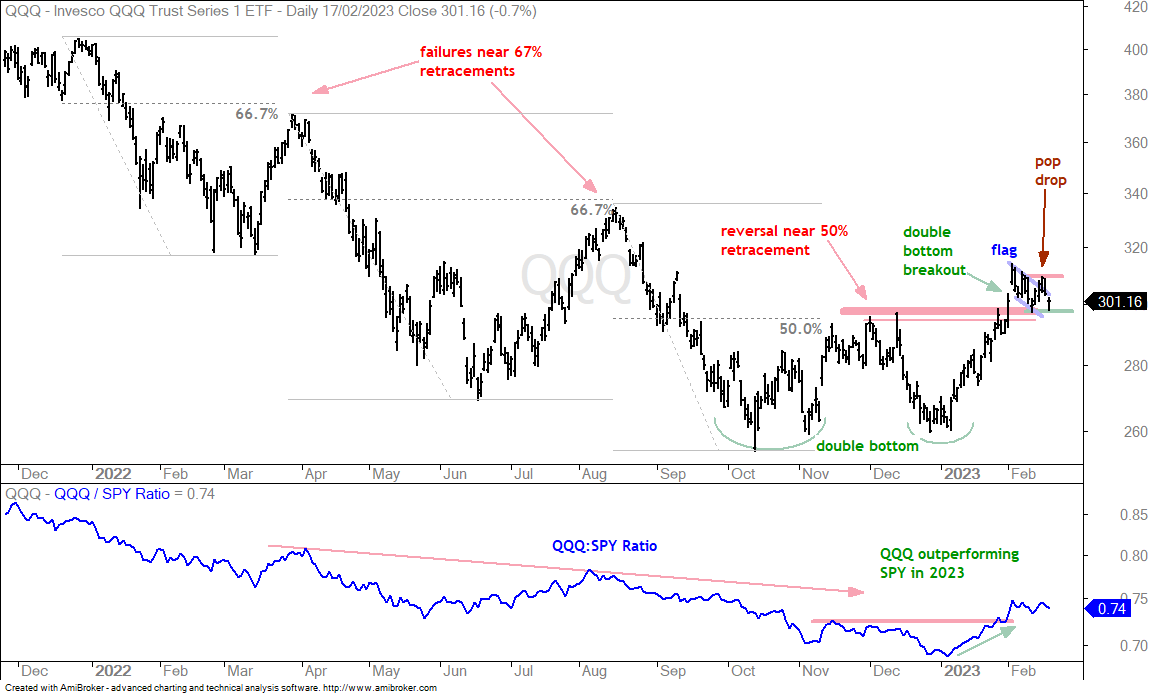
The Nasdaq 100 ETF (QQQ) has a double bottom breakout working. Double bottoms are bullish reversal patterns and the breakout signals a higher high (uptrend). QQQ was quite overbought after the surge from 260 to 312 (+20% in 5 weeks). The ETF formed a falling flag to work off this overbought condition and attempted a breakout early last week. This attempt failed as the ETF fell back on Thursday-Friday. A short-term breakout at 310 is needed to reverse the short-term downswing.
IWM in Short-term Downtrend
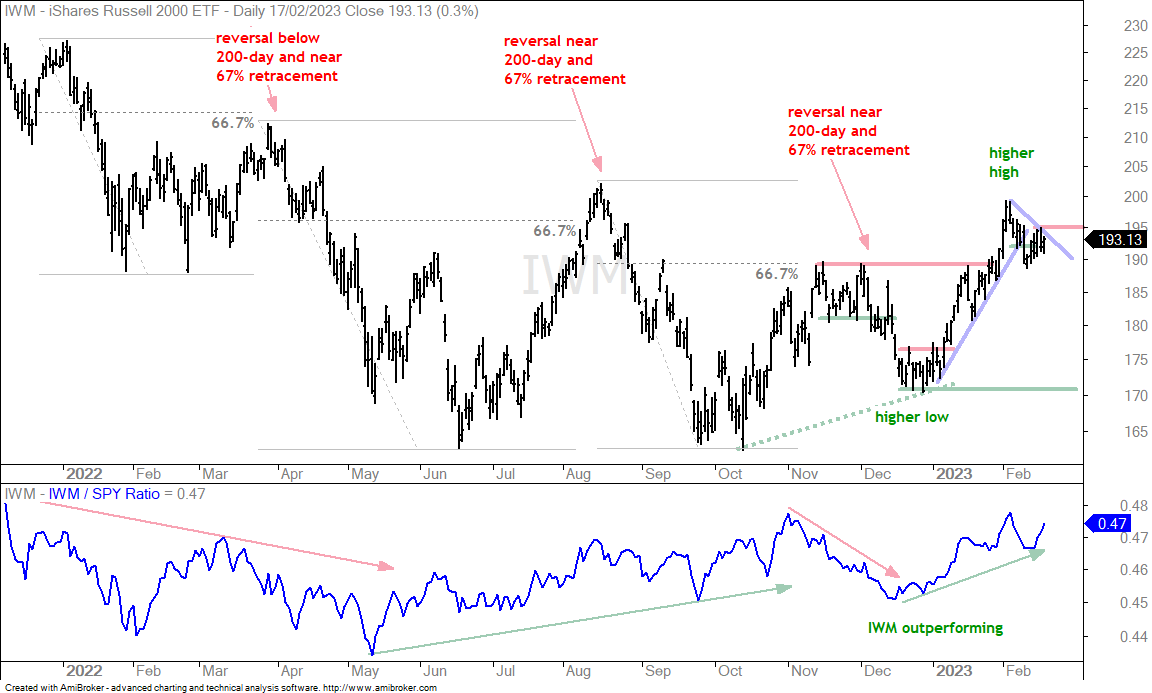
Technically, SPY, QQQ and IWM are in long-term utprends after higher highs and breakouts in late January or early February. Short-term, all three are in downtrends as they pulled back here in February. The next chart shows IWM breaking short-term support with a sharp decline on February 14th and bouncing back above 190 last week. I am marking short-term resistance at 195 and a breakout here is needed to reverse the short-term downtrend. As long as QQQ, SPY and IWM remain below short-term resistance, the short-term trends are down and the market is in pullback mode.
Short-term Support for Key Sectors
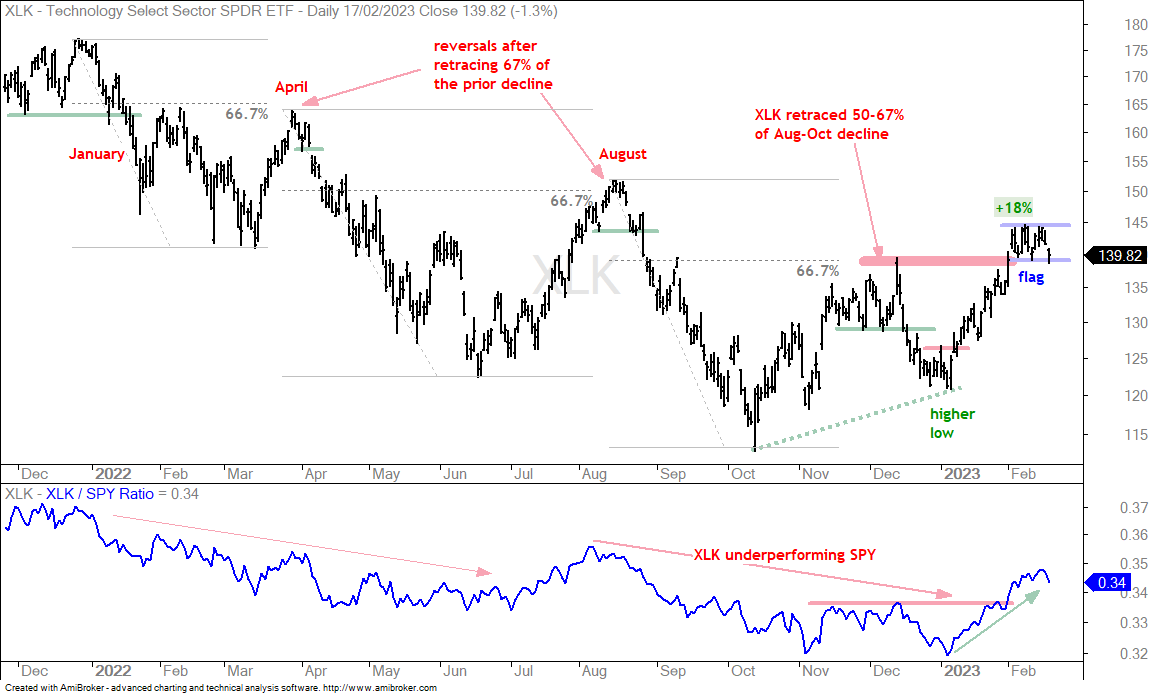
We never know ahead of time if a support break will lead to an extended decline or just a pullback. Because of the bigger swings over the last 14 months, I am more focused on short-term support levels for some of the key offensive sectors. The chart below shows the Technology SPDR (XLK) with short-term support breaks in mid January, early April, late August and mid December. The January break started the 2022 downtrend. The April and August breaks occurred after counter-trend bounces and led to extended declines. The mid December support break did not result in an extended decline as XLK found support well above the October low. Currently, XLK surged 30% and then stalled with a flat flag. The flag lows mark support at 139 and a break here would be short-term bearish. Should XLK hold support and maintain the flag, a breakout at 145 would be bullish.
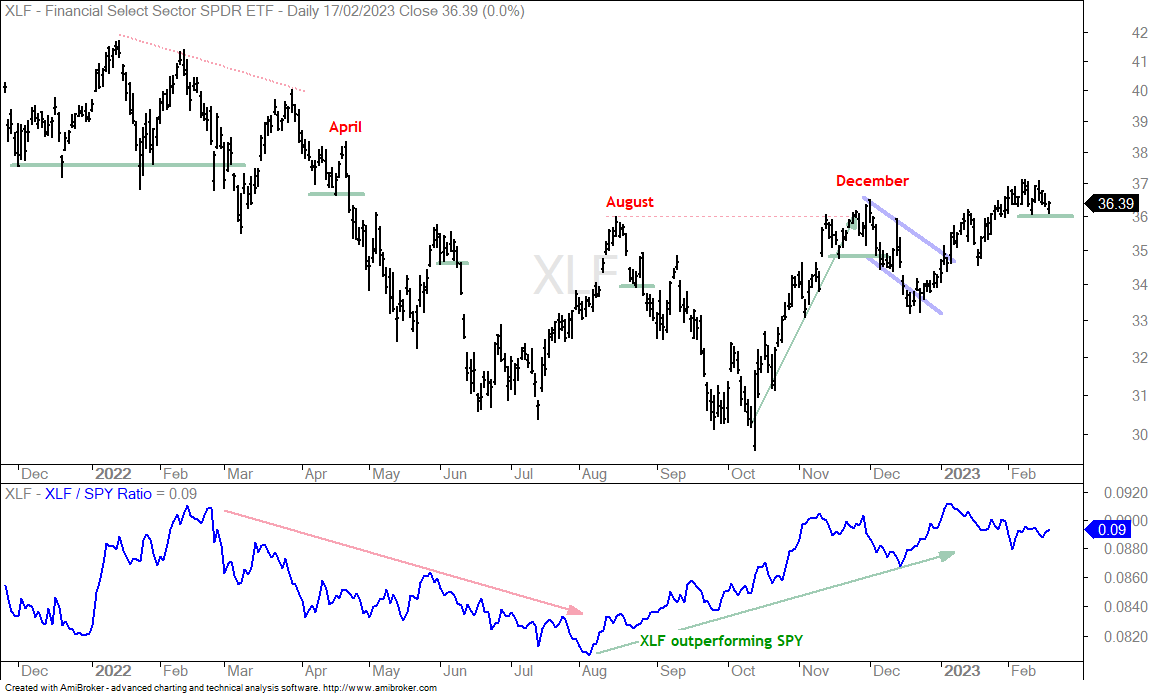
The next chart shows the Finance SPDR (XLF) with support breaks in April and August that led to further weakness. The December support break was not as foreboding because XLF firmed in late December and moved higher the last two months. Support is now set at 36.
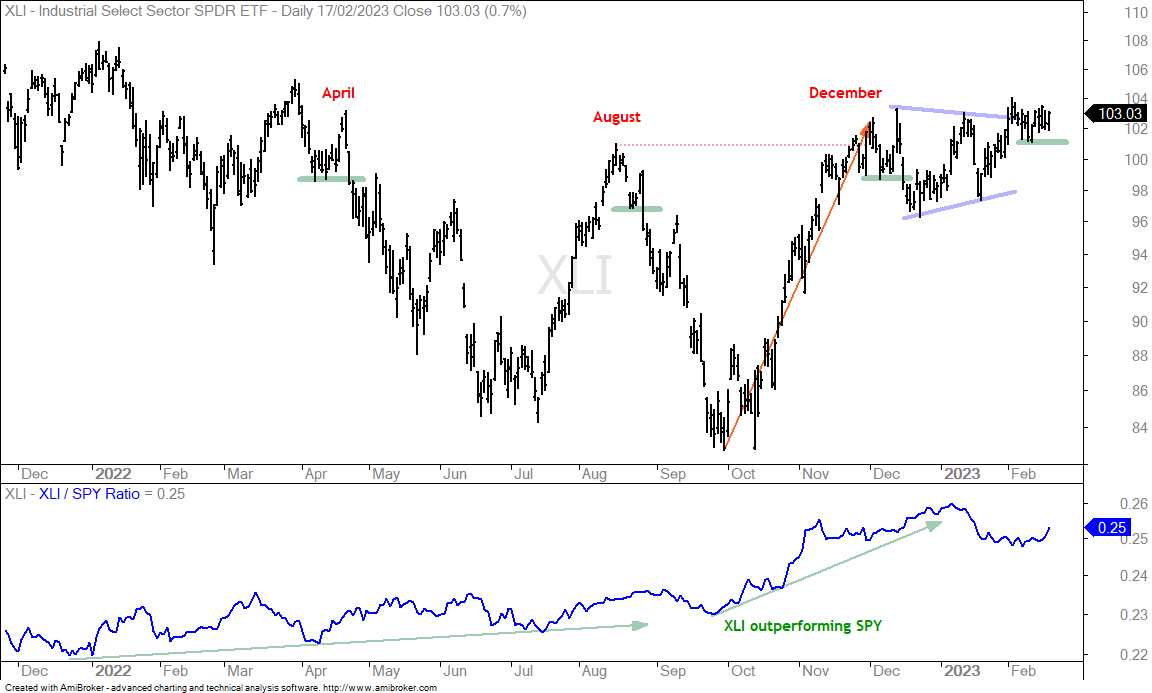
The next chart shows the Industrials SPDR (XLI) with support breaks in April and August that led to further weakness. The December break did not last long as XLI quickly bounced and firmed. Current short-term support is set at 101.
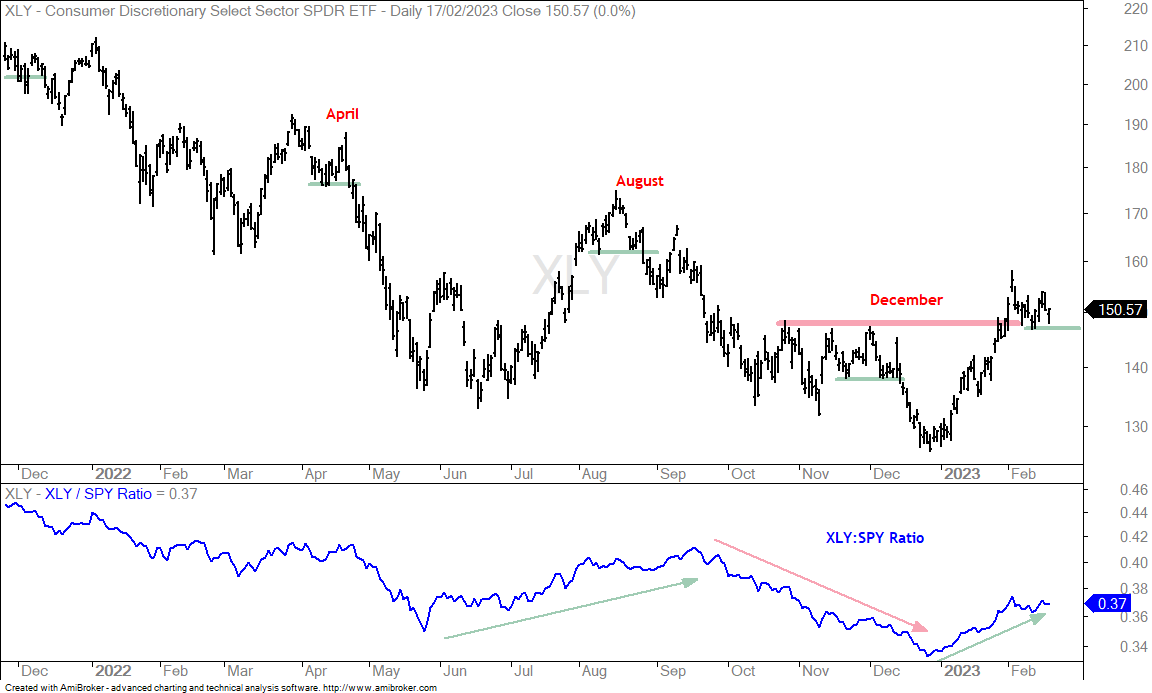
The next chart shows the Consumer Discretionary SPDR (XLY) with support breaks in April, August and December. Each break led to a new low. XLY recently broke resistance with a surge into early February and then tested this breakout with a pullback into mid February. Short-term support is set at 147 and a break here would be short-term bearish. Note that short-term breaks in three of the four sectors would be short-term bearish for the broader market. This would suggest that the pullback was broadening and could extend.
Tech-Based ETFs in Short-term Downtrends
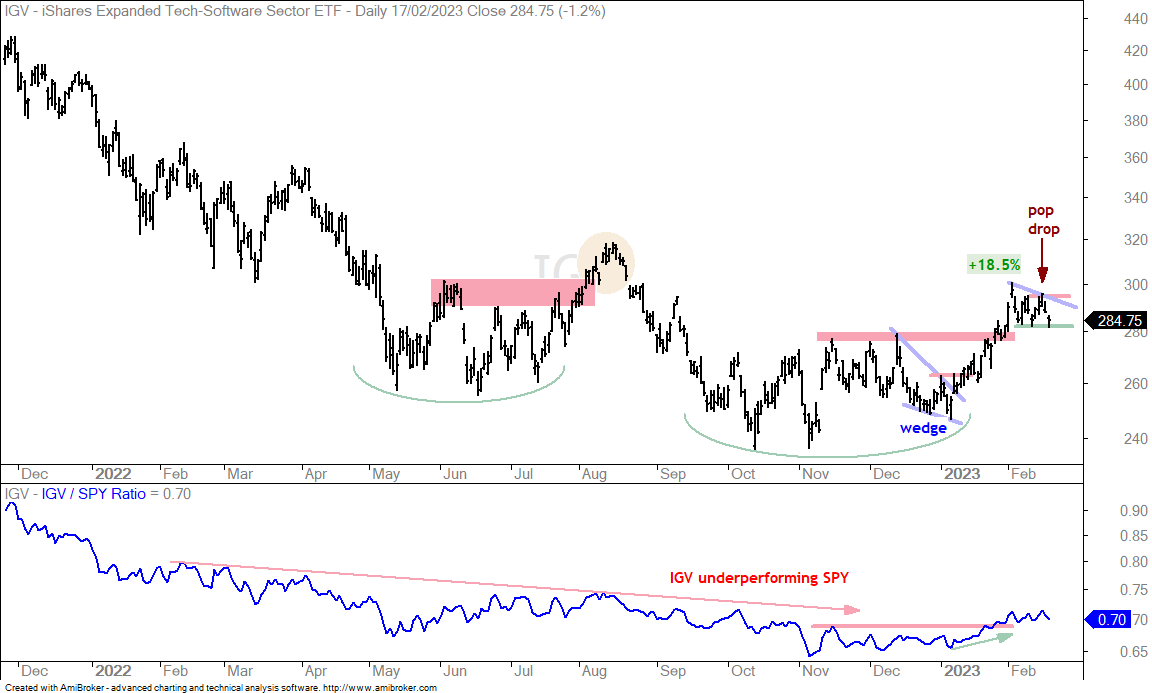
Most stock-based ETFs will be under pressure as long as the big three are in short-term downtrends (SPY, QQQ, IWM). In particular, the tech and high beta ETFs that led the market in January looks vulnerable. These ETFs popped on Monday, Tuesday and Wednesday, but then dropped on Thursday and Friday. This pop-drop sequence forged a reaction high (short-term peak) on Wednesday and this peak marks short-term resistance going forward. The chart below shows the Software ETF (IGV) with the pop-drop peak marking short-term resistance at 296 (red line). Even though IGV has yet to break short-term support at 282, the ETF is in pullback or corrective mode until an upside breakout.
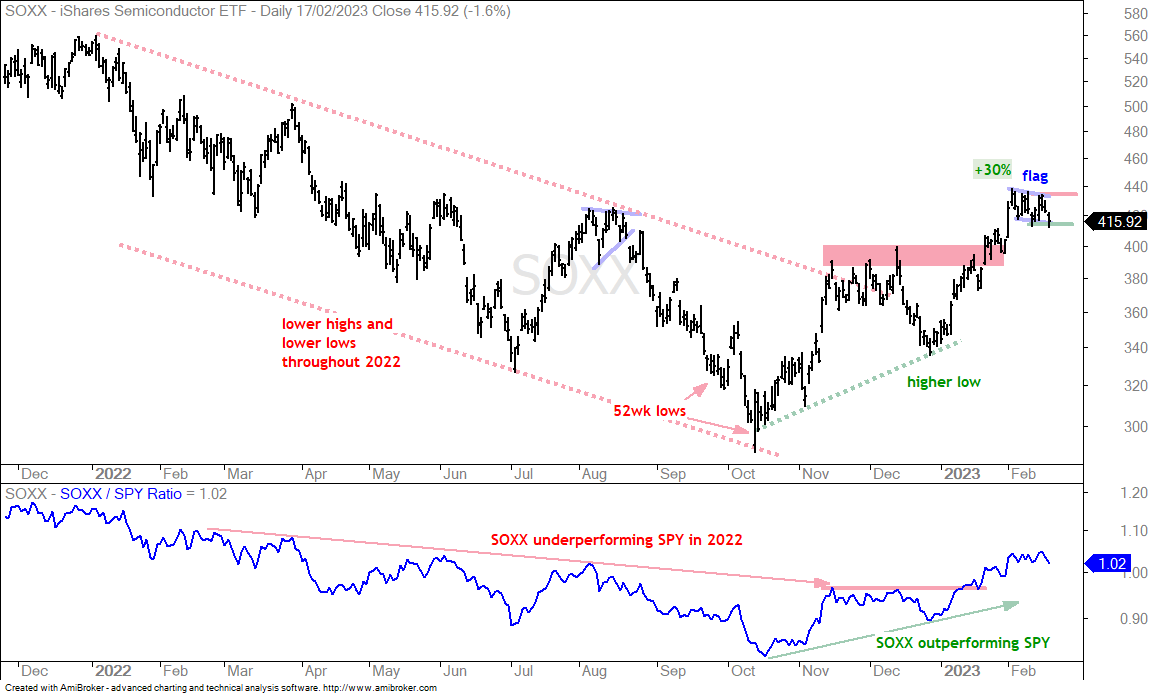
The next chart shows the Semiconductor ETF (SOXX) with a 30% advance and a short falling flag in February. The short-term trend is down as long as the flag falls, which means SOXX is in pullback-correction mode. A move above 434 would break flag resistance and reverse this short-term downtrend. Until then, I will expect the pullback to extend.
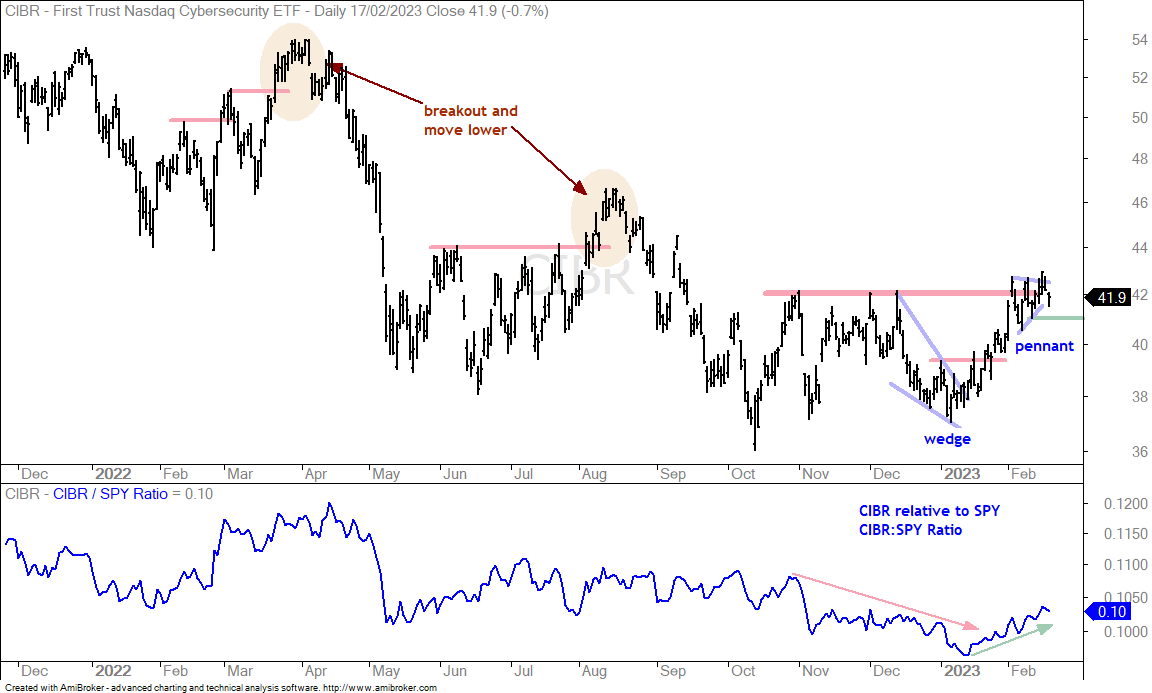
The next chart shows the Cybersecurity ETF (CIBR) with a pennant breakout on Wednesday and a drop on Thursday-Friday. CIBR is one of the strongest tech ETFs because it forged a multi-month high on Wednesday. Nevertheless, CIBR is not an island and will be influenced by the broader market and the tech sector.
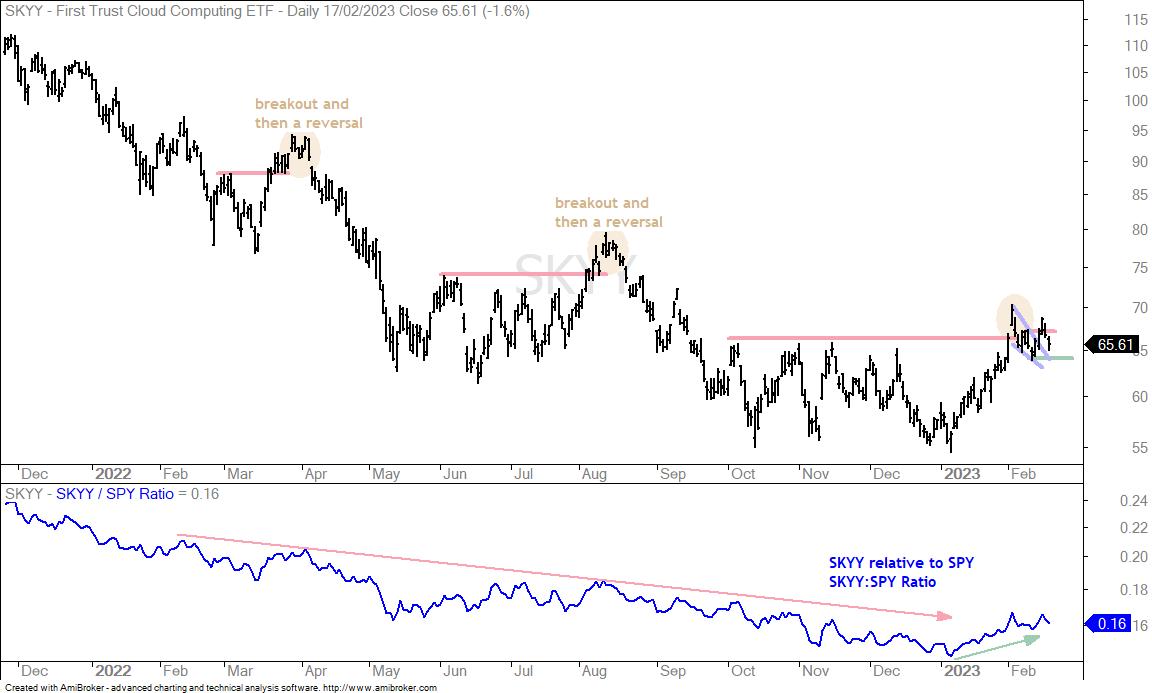
The next chart shows the Cloud Computing ETF (SKYY) with a wedge breakout. This falling wedge is very small and could also be considered a pennant (falling pennant). SKYY fell back after the breakout because of broad market weakness and sector weakness. A break below the February low would put the ETF in correction/pullback mode.
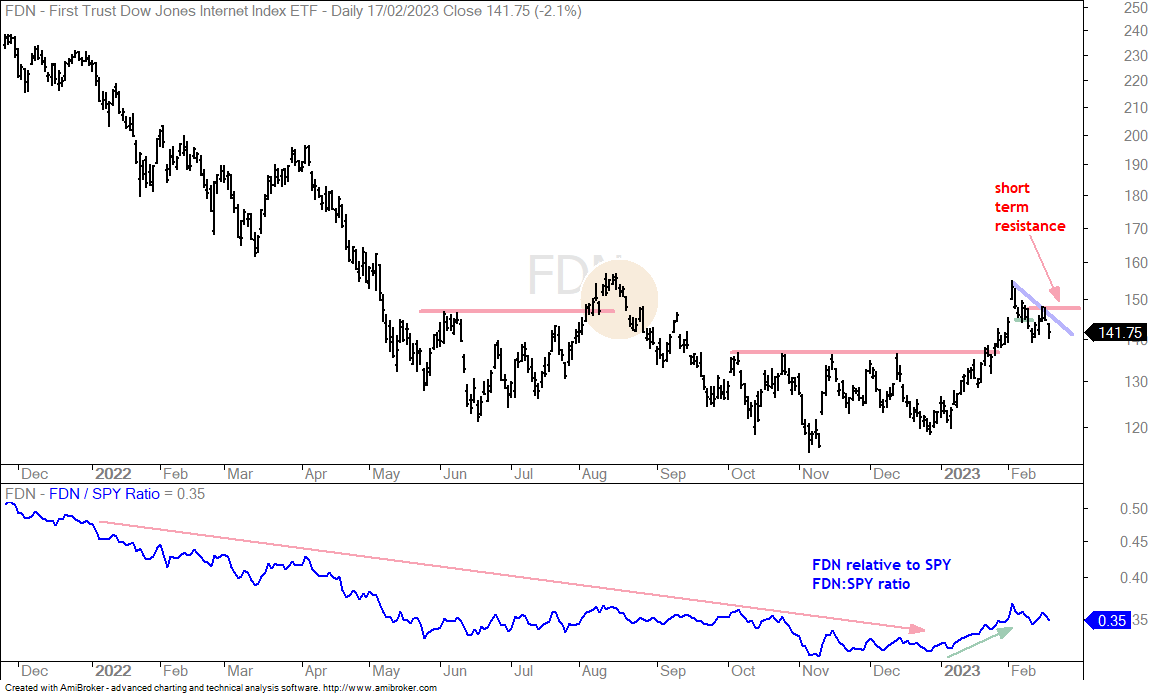
The next chart shows the Internet ETF (FDN) breaking short-term support with a sharp decline on February 9th and 10th. The ETF popped with the rest of the market early last week and also dropped with the rest of the market late last week. The short-term trend is down with resistance marked at 148.
Home Construction Corrects (ITB)
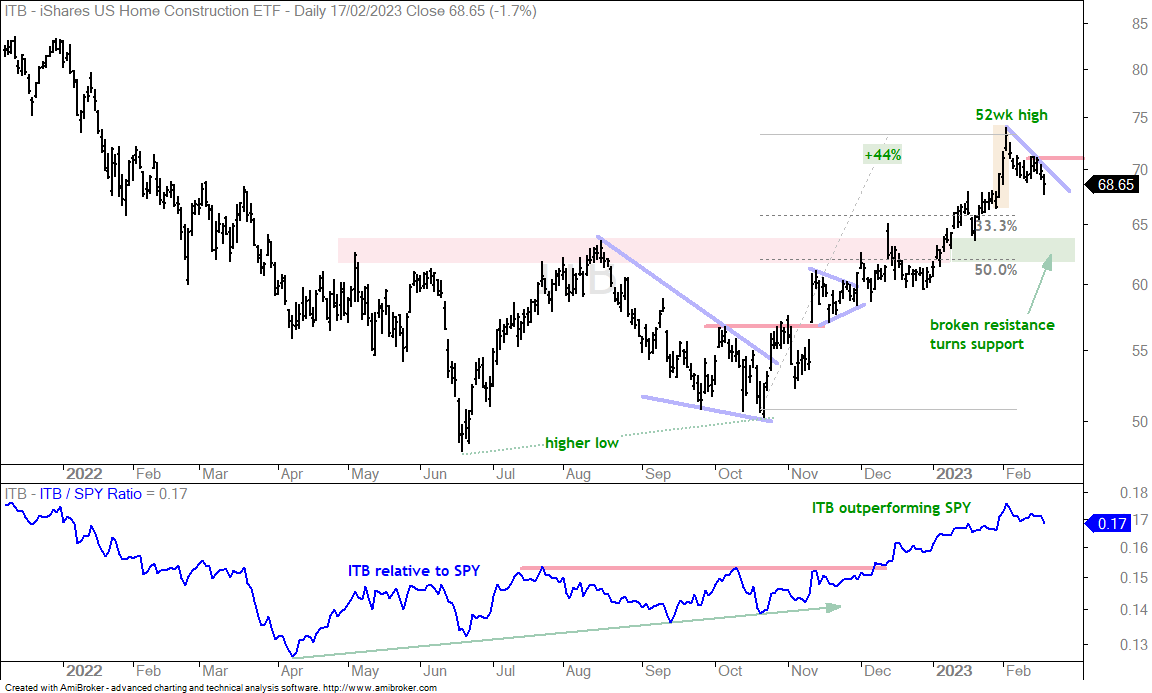
The Home Construction ETF (ITB) led the market charge with a 44% gain from mid October to early February and a 52-week high. As with many ETFs, ITB was very extended in early February and the Rate-of-Change was unsustainable. The yellow shading shows the ETF surging 10% in three days (31 Jan and 1-2 Feb). An acceleration higher after an extended advance is a blowoff top. It is not outright bearish, but it signals serious frothiness that often leads to a pullback. ITB is getting that pullback now with resistance marked at 71. As far as targets, the 62-64 area marks support from broken resistance and there is a possible reversal area based the 33-50 percent retracement zone (green shading).
Regional Bank ETF with Short-term Downswing
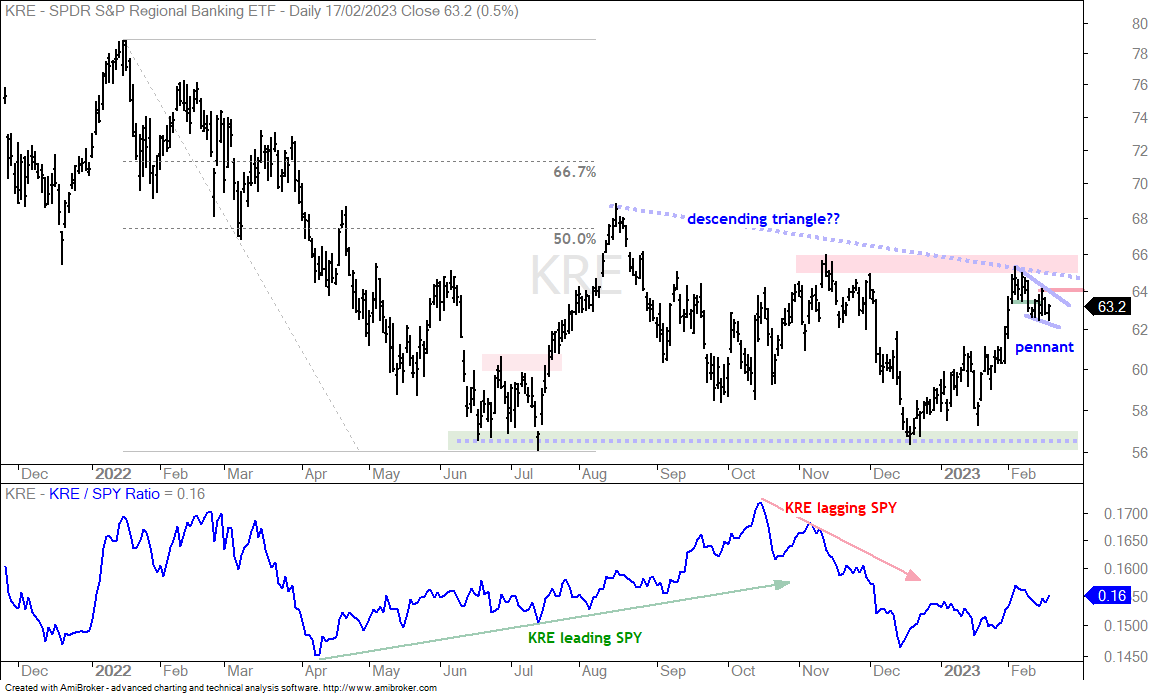
The next chart shows the Regional Bank ETF (KRE) with a large descending triangle taking shape. The ETF fell sharply from January to July and then consolidated into February. The lower highs from August to November to February and relatively equal lows mark a possible descending triangle (dashed lines). This is a long-term bearish continuation pattern and a break at 56 would signal a continuation lower. I am more interested in the swings within the pattern. The swing from mid January to early February was up and KRE broke short-term support (green line) with a sharp decline on February 9th. The short-term trend (swing) is now down. It is possible that a bullish pennant is taking shape, but a break above 64 is needed for a short-term bullish reversal.
Biotech Brothers Remain with Pullbacks
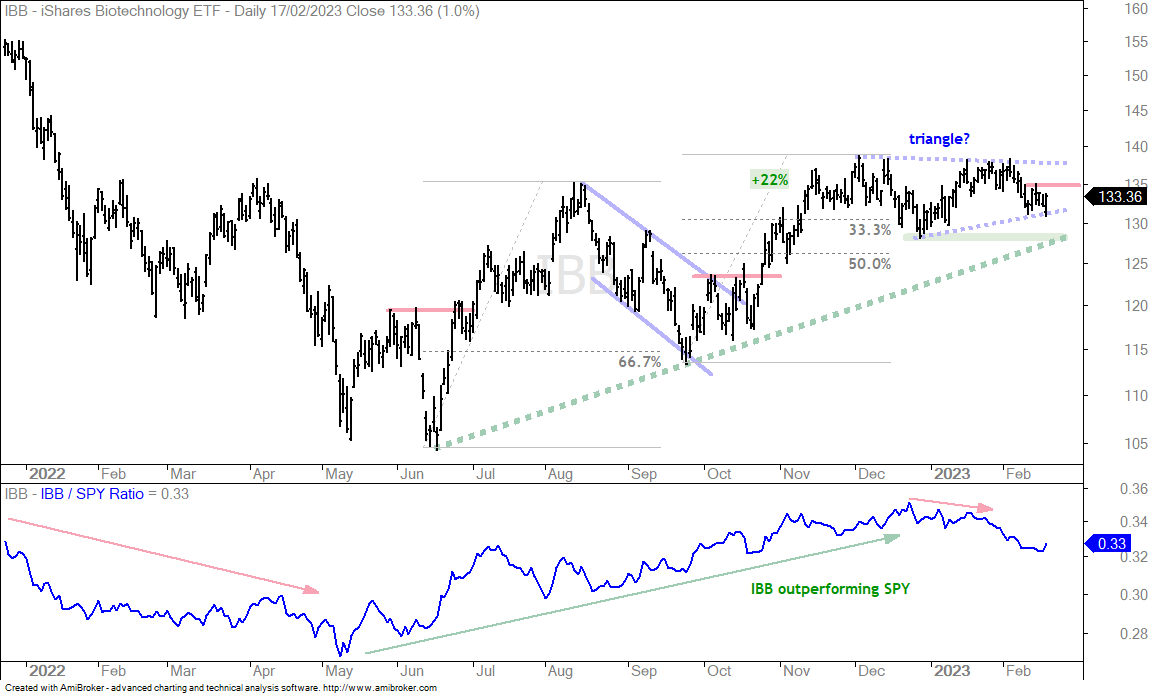
The Biotech ETF (IBB) and Biotech SPDR (XBI) are also in pullback mode here in February. The first chart shows IBB with an uptrend overall and a possible triangle, which is considered a consolidation within an uptrend and a bullish continuation pattern. This triangle is marked “possible” because the lower line remains quite subjective. IBB pulled back in February, but has yet to bounce and form a clear trough (reaction low) upon which to base this line, hence the dotted lines. A breakout at 135 would forge a trough and reverse the downswing within the triangle. This would be the early sign that IBB will challenge triangle resistance.
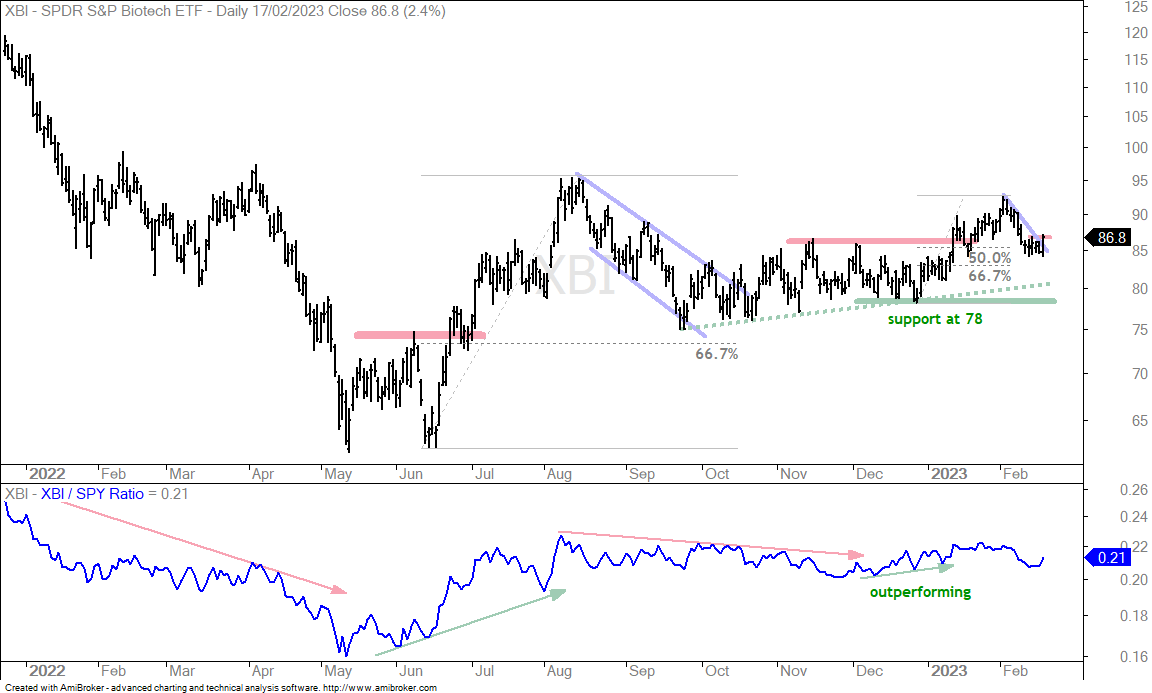
The next chart shows XBI with a breakout in mid January and pullback in February. XBI firmed last week and surged 2.4% on Friday. A short-term breakout could be in the making here. Notice that the February pullback retraced 50-67 percent of the December-January advance. These retracements mark a potential reversal area for pullbacks after an advance.
Energy ETFs Take a Hit
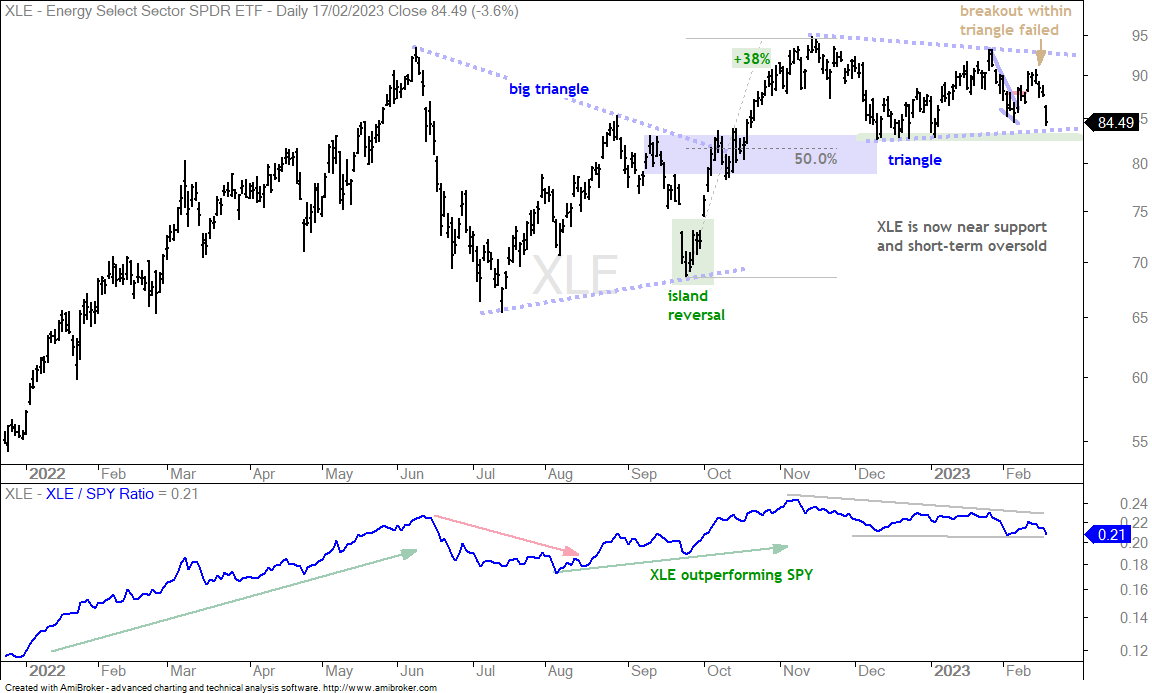
The Energy SPDR (XLE) also formed a triangle after an advance and this pattern is also viewed as a consolidation within an uptrend. The swing within the pattern was down in early February and XLE broke out with a surge on February 7th. This break did not hold as XLE fell back sharply on Friday. The ETF has yet to break support from the December lows and the bigger triangle is still possible. Also note that XLE has a short-term oversold setup on the mean-reversion setups table.
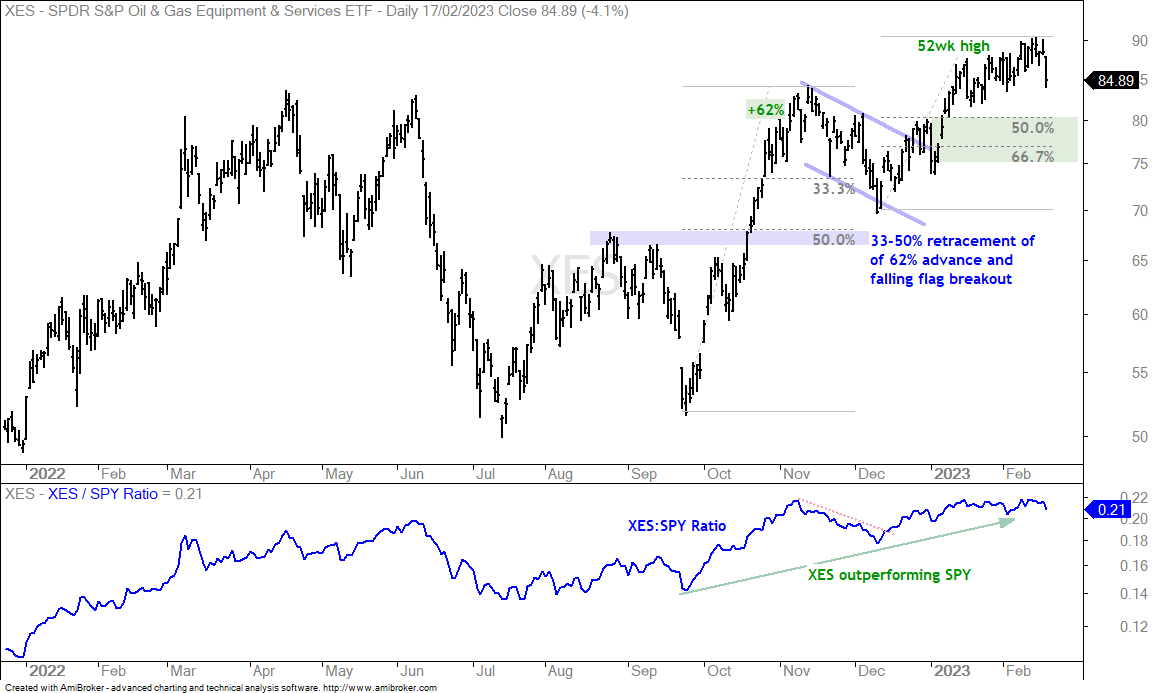
The next chart shows the Oil & Gas Equipment & Services ETF (XES) working its way higher from mid January to mid February and then taking a hit on Friday (-4.1%). This is a big move, but XES has above average volatility and this decline is not enough to affect the overall uptrend. As far as pullbacks, the ETF is not short-term oversold and is not close to a potential reversal zone yet. Using the prior breakout zone and 50-67 percent retracements, I would place the potential reversal zone in the 75-80 area (green shading). Thus, there is no setup on this chart right now.
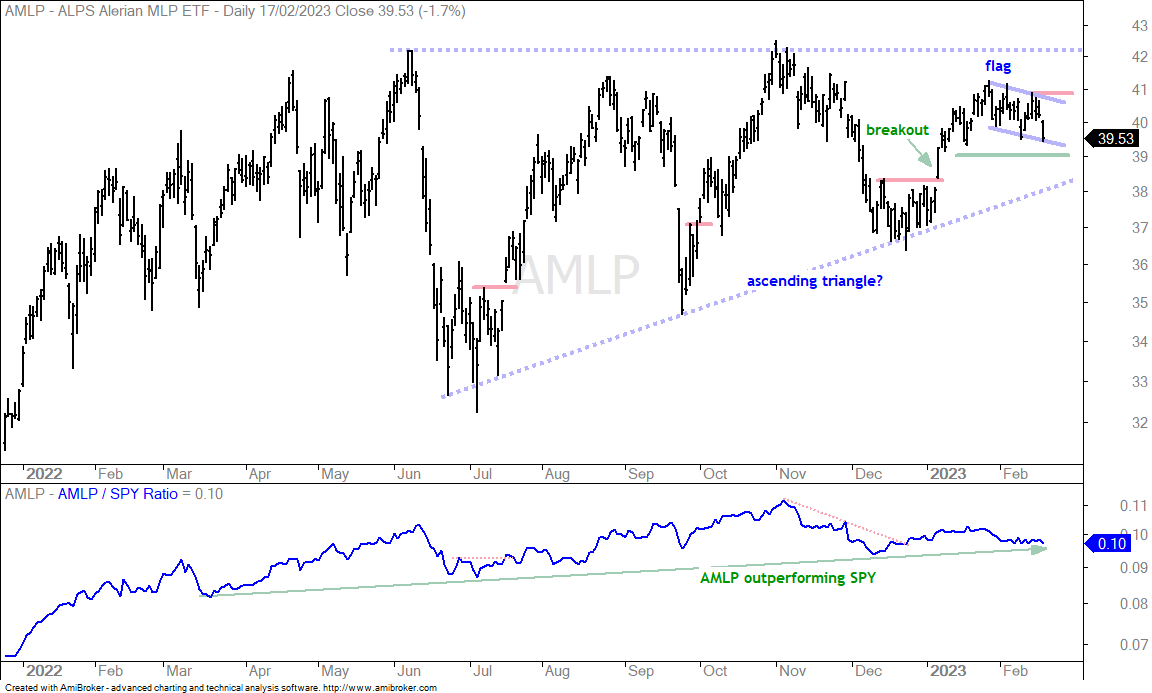
The next chart shows the MLP ETF (AMLP) with a breakout and strong surge into late January. The ETF pulled back with a falling flag in February and a move above 41 would break flag resistance.
Defensive ETFs Still in Pullback Mode
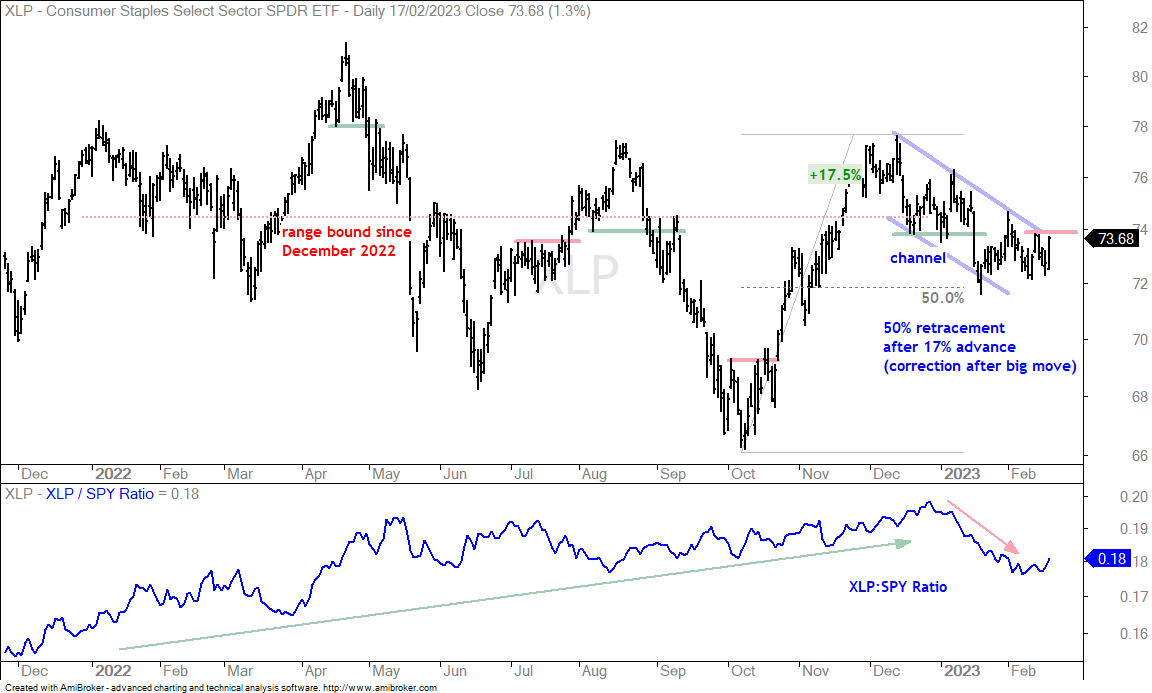
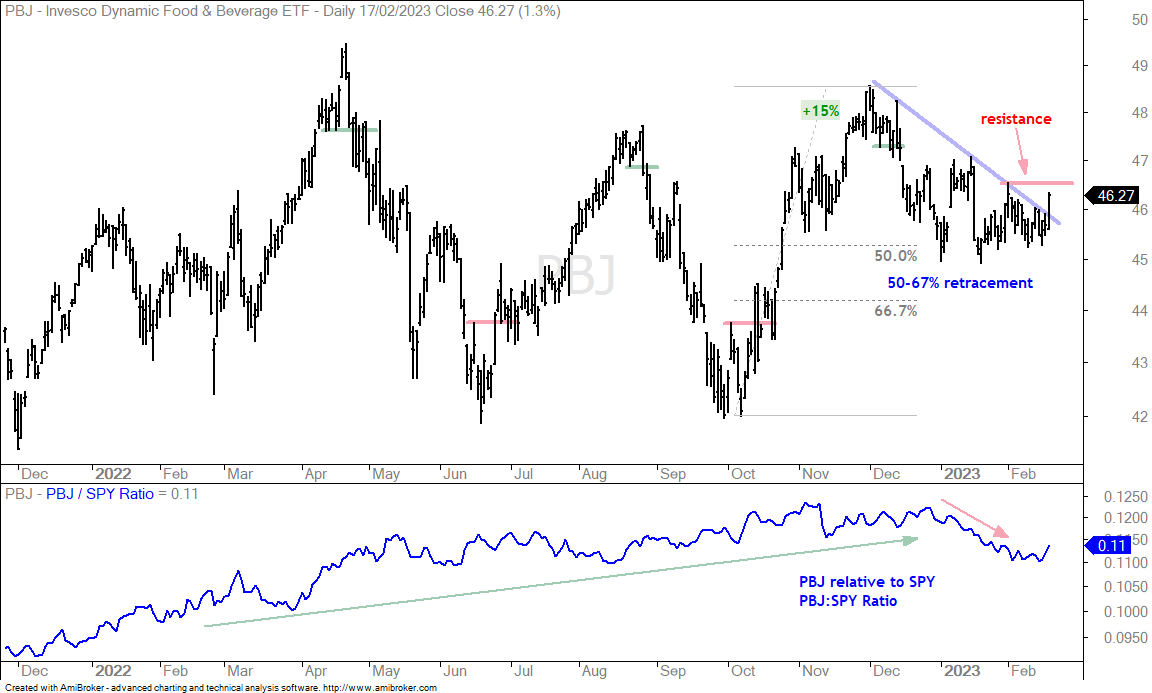
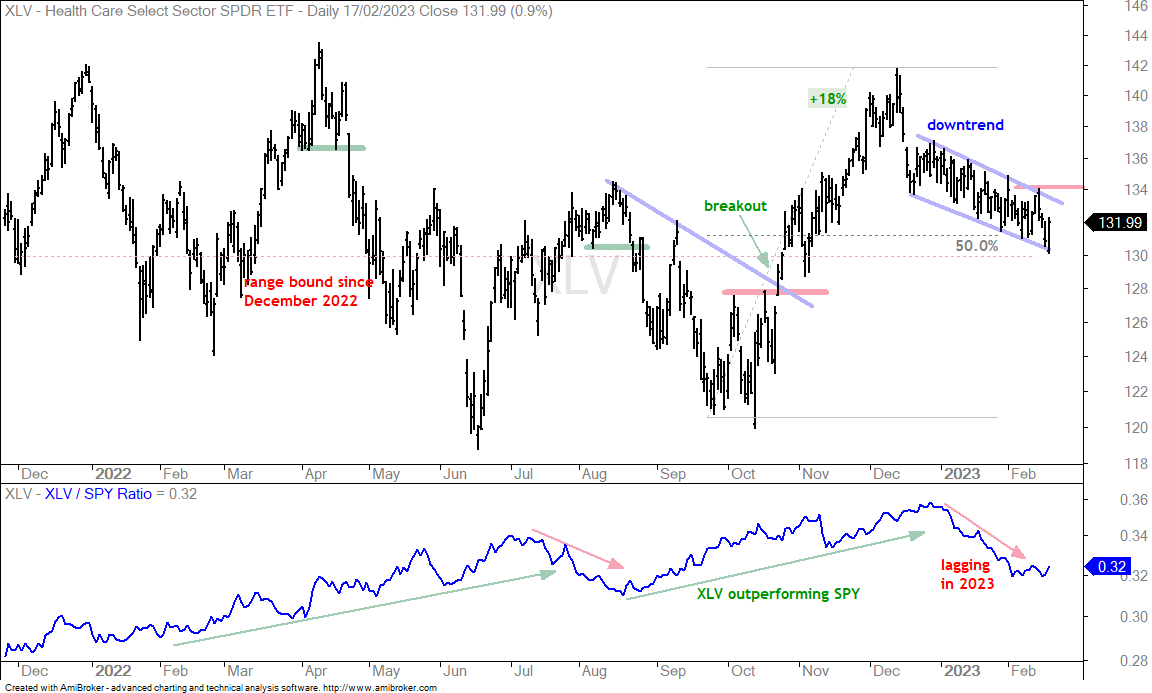
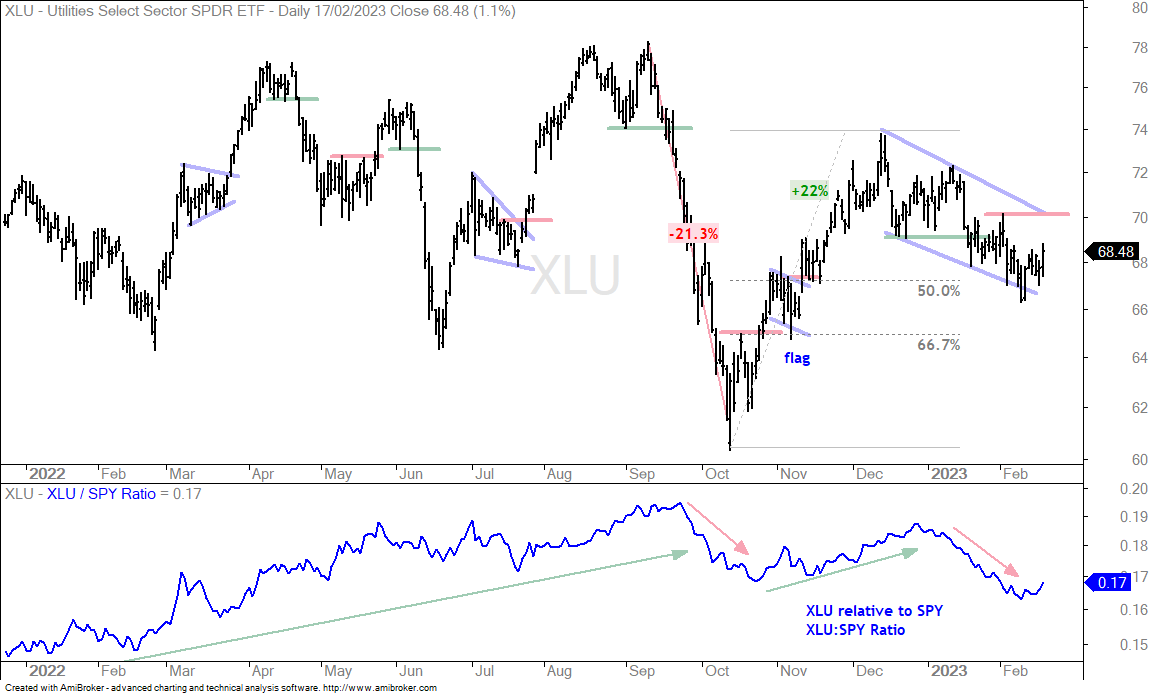
SPY fell 1.62% on Thursday-Friday, but the defensive ETFs advanced as money moved into the less risky part of the stock market. Note that all stocks and stock-based ETFs are at risk during broad market declines. Defensive ETFs sometimes hold up better and outperform the S&P 500 during periods of weakness. The defensive ETFs underperformed in 2023 as money moved into the risk-on part of the stock market, but the declines from December to February look like corrections after sharp advances. These ETFs surged from October to December with double digit advances. The declines into February retraced 50 to 67 percent of these advances and the retracement amounts are typical for pullbacks after big advances. Some ETFs formed falling channels or falling wedges, which are also typical for corrections. The red lines mark resistance and breakouts would reverse the short-term downtrends. Breakouts would also signal a preference for less risky ETFs (risk-off) in the stock market.
The next chart shows the Consumer Staples SPDR (XLP) with a falling channel correction and resistance at 74.
The next chart shows the Food & Beverage ETF (PBJ) retracing 50 to 67 percent and firming in the 45 area. A breakout at 46.5 would be bullish.
The next chart shows the Healthcare SPDR (XLV) with a falling wedge that retraced around half of the 18% advance. A breakout at 134 would be bullish.
The next chart shows the Utilities SPDR (XLU) with a correction that retraced 50-67 percent of the 22 percent advance. A breakout at 70 would be bullish.
Copper Goes for Breakout (plus DBB)
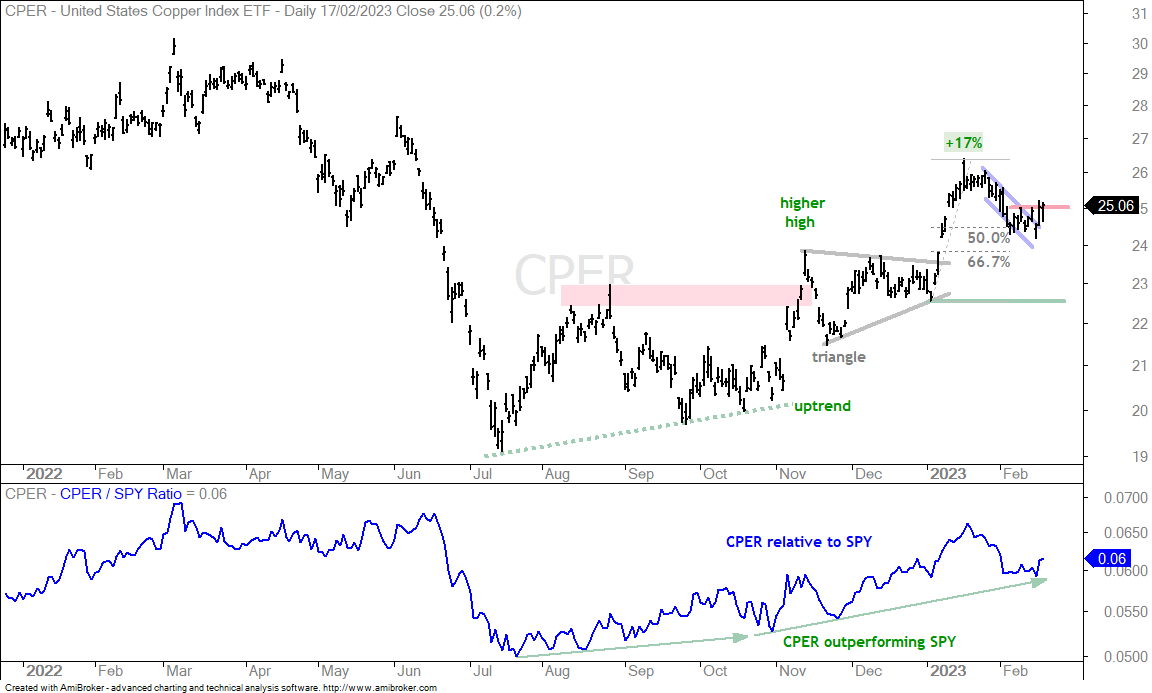
The Copper ETF (CPER) surged on Thursday and held its gains on Friday. With this move, the ETF is reversing the pullback that started in mid January. CPER surged 17% and then retraced around 50% of this surge with the decline to around 24.15. This decline formed a falling flag that is considered a correction after the January surge. The breakout at 25 reverses the short-term downswing and signals a resumption of the bigger uptrend.
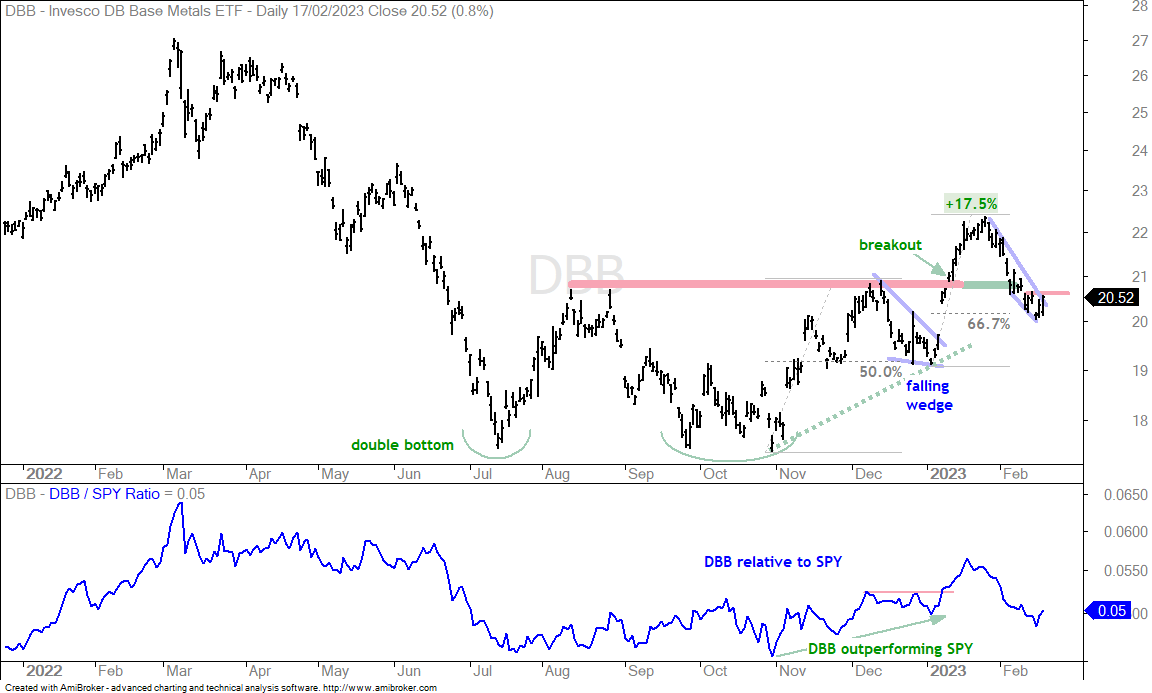
The next chart shows the DB Base Metals ETF (DBB) with a falling wedge that retraced around 2/3 of the prior surge. DBB also popped on Thursday, but remains just shy of a breakout. Short-term resistance is set at 20.65.
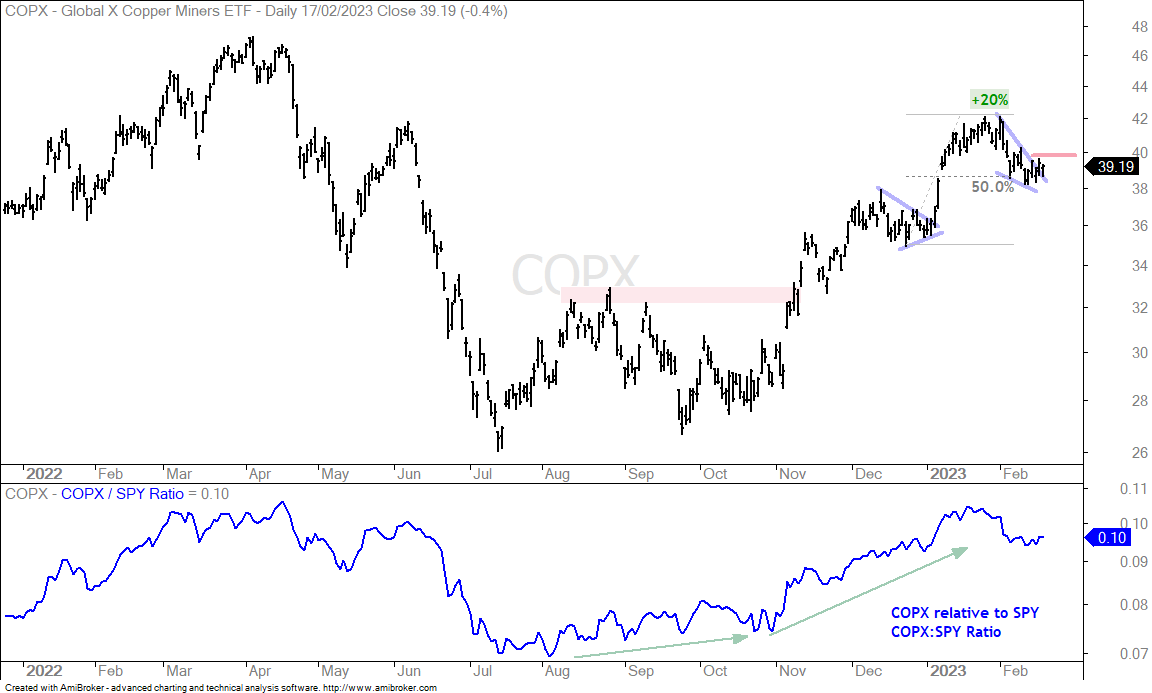
The next chart shows the Copper Miners ETF (COPX) with a falling wedge and short-term resistance set at 40.