Complimentary
Friday Chart Fix – 2024 vs 2025 – Commodities with Crypto – Key Moment for IWM – The Tesla Squeeze
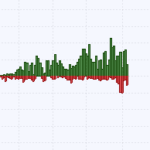
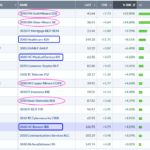
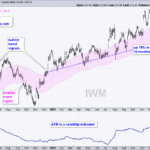
Welcome to your Friday Chart Fix. Today we start with the difference between the 2024 bull market and the 2025 bull run. The S&P Total Market Index ETF hit new highs in July, but 2025 breadth is not what it was in 2024. Small-caps are weighing on the broader market as the Russell 2000 ETF battles its 200-day SMA. Even though QQQ is leading the major index ETFs with a double-digit gain