ETF Trends, Patterns and Setups – QQQ Still Leading IWM, Banks Extends, Copper Related ETFs Hit Support (Premium)

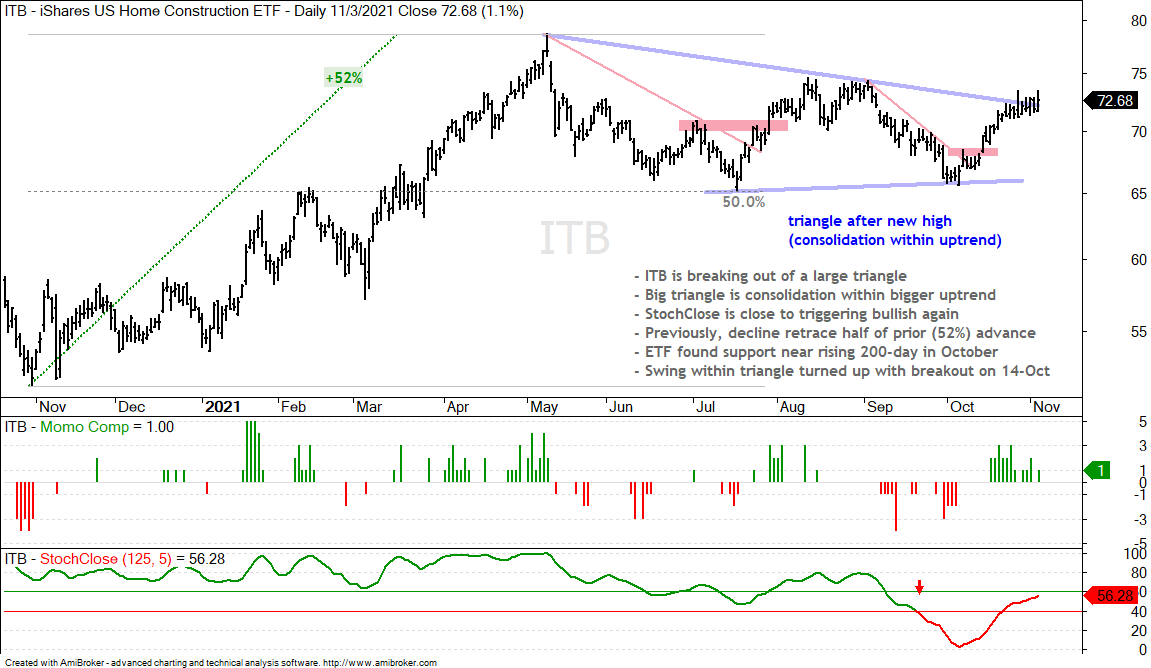
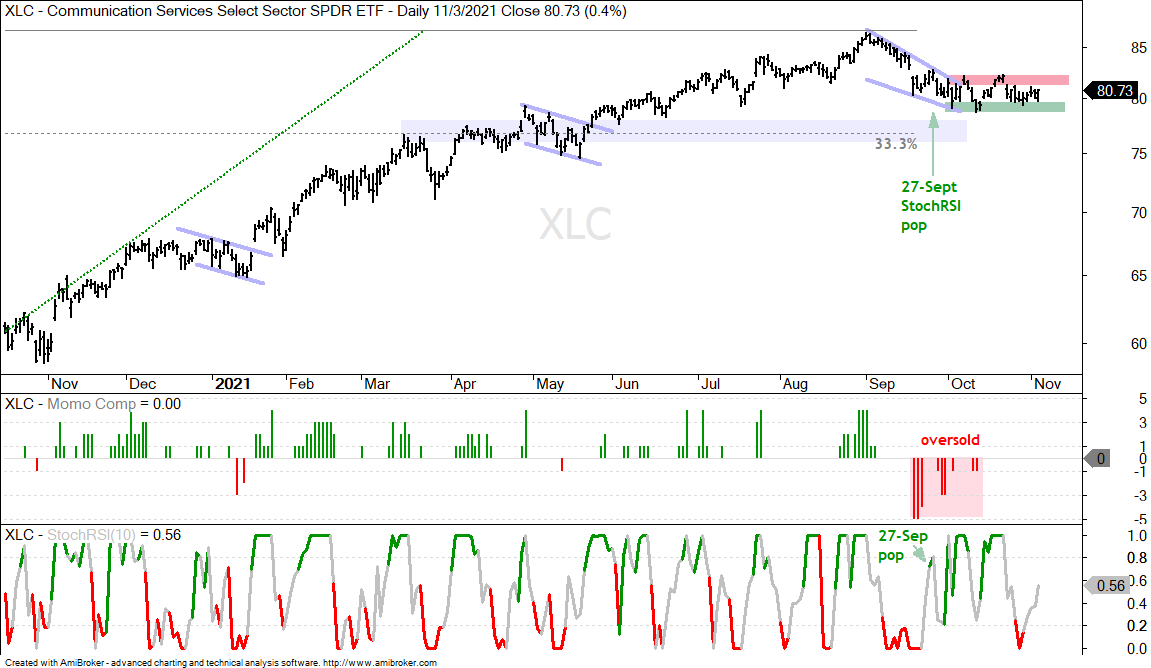
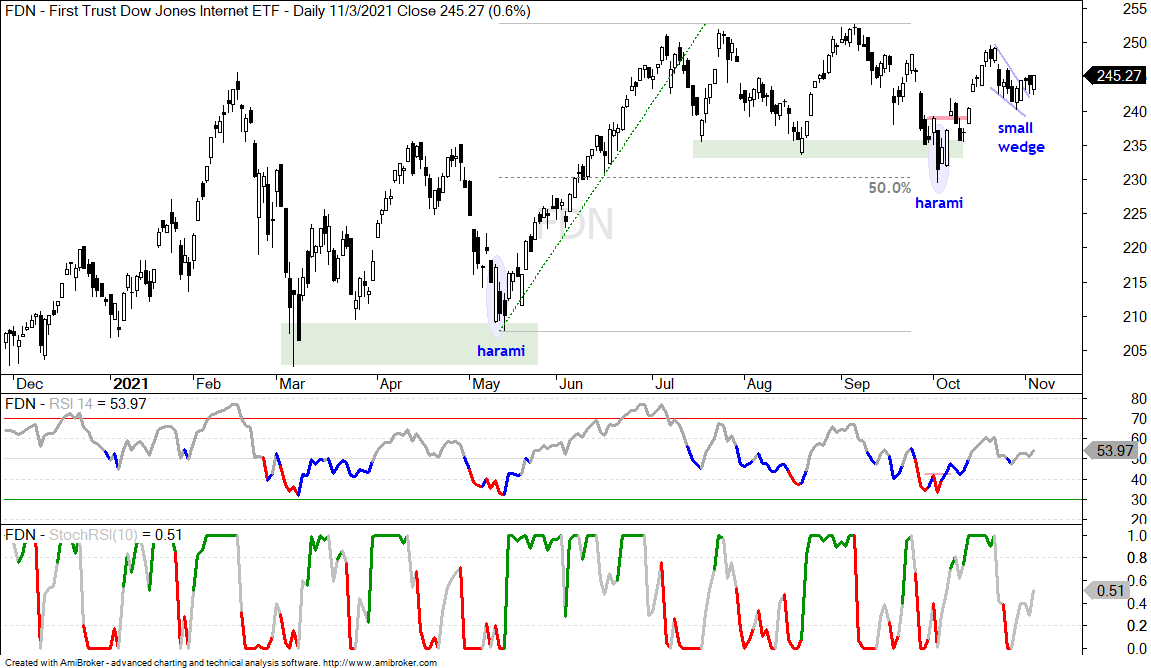
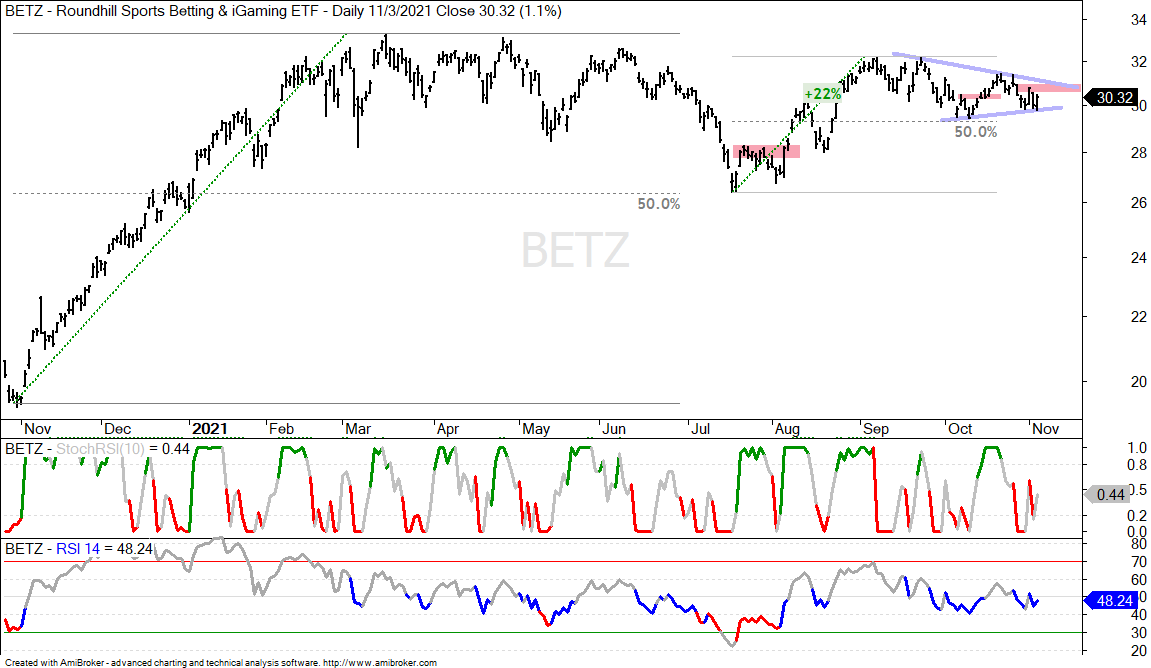
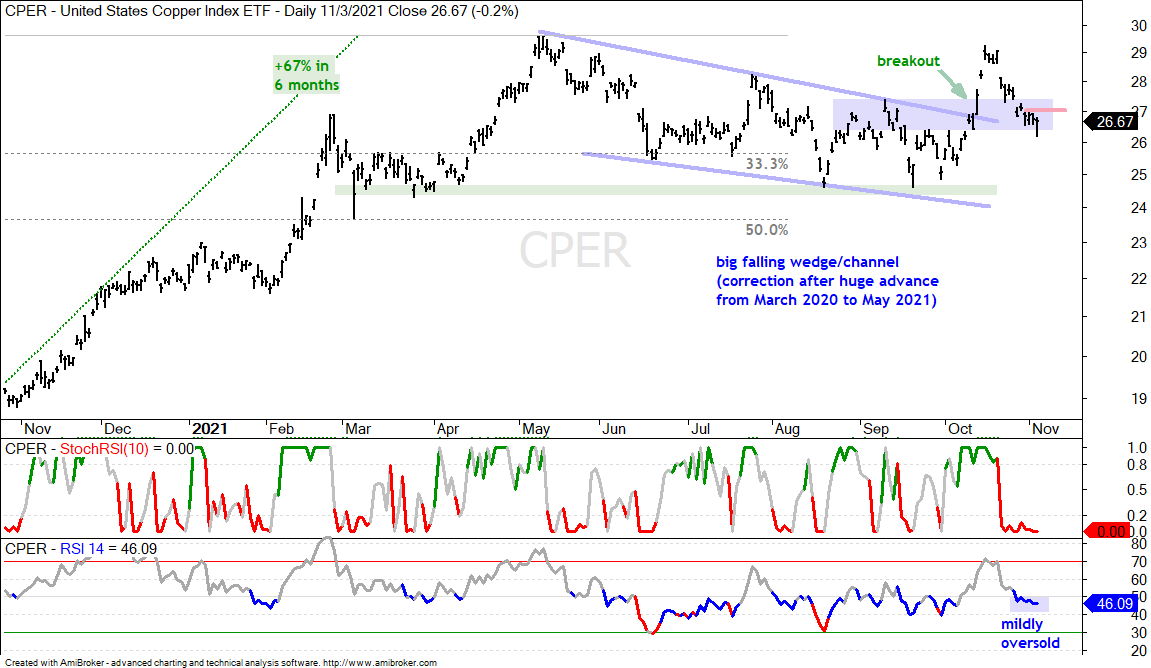
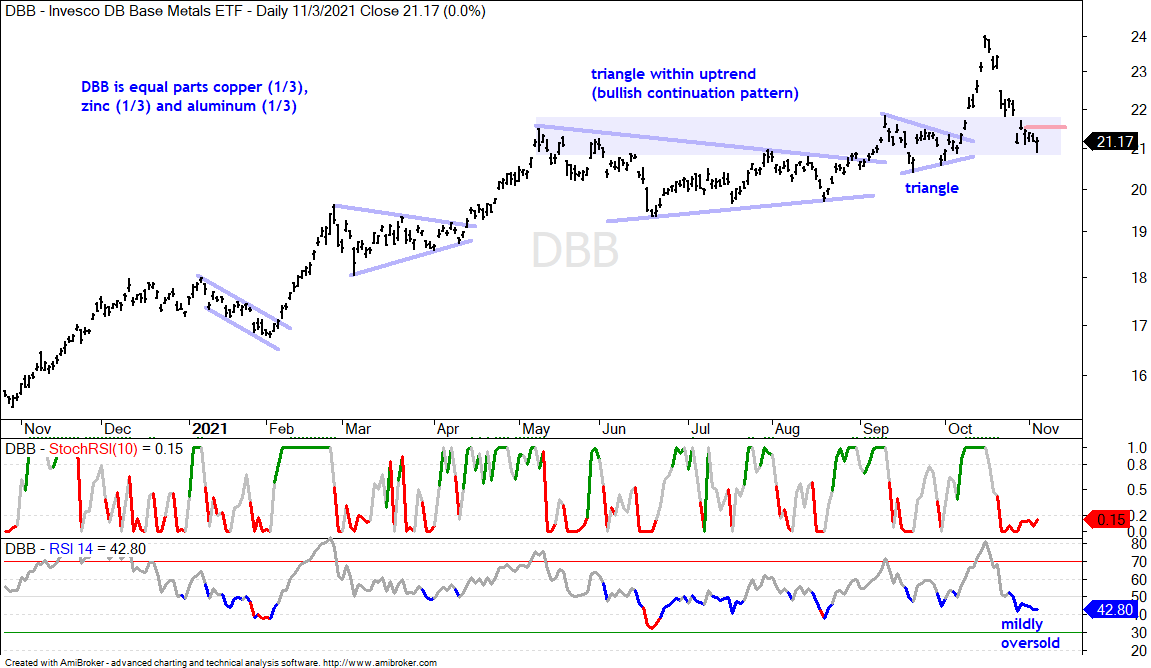
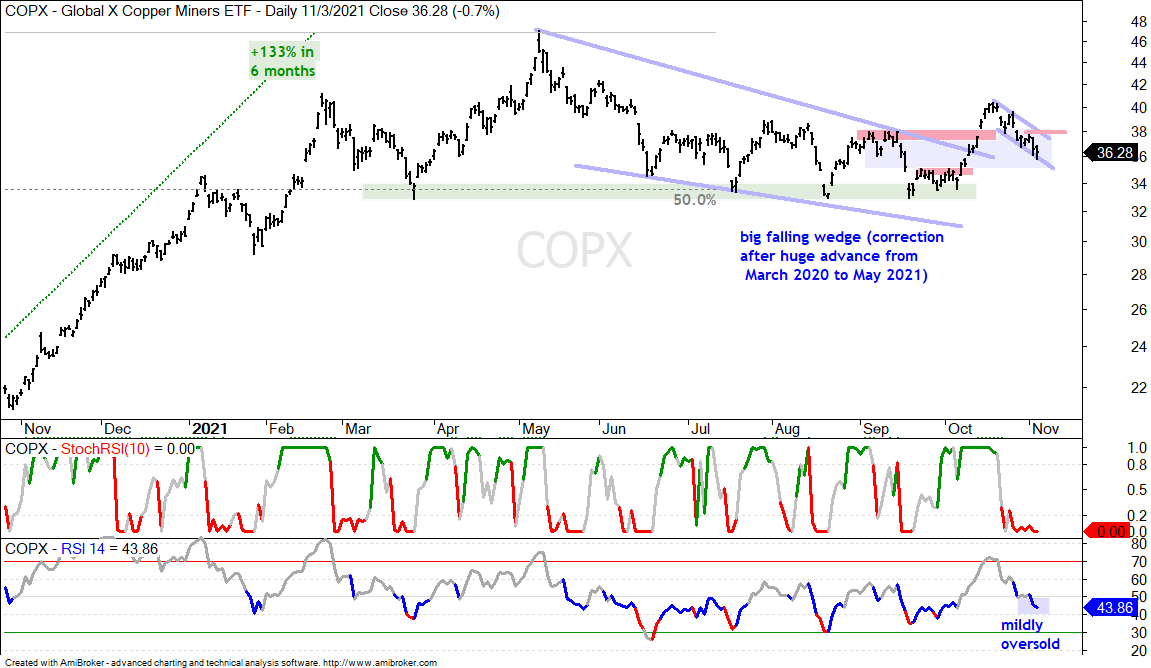
The October run continued into November with small-caps breaking out and participation expanding. Some of the old leaders, however, are still leading with new highs in QQQ, XLK and some tech-related ETFs. The setups and breakouts from early-mid October are bearing fruit and ETFs with big runs the last four to five weeks are in the trend-monitoring phase. We still have some old economy ETFs trying to break out of large consolidation patterns (XLI, IFRA, XLB, ITB). There are also a few ETFs with short-term bullish setups working (XLC, FDN, BETZ). The copper-related ETFs are also toying with their breakout zone (support) after throwbacks the last two to three weeks. All this and more in today’s commentary.

Broad Market ETFs

There is one small change in the broad market picture: IWM broke out and hit a new high. There is no change in SPY and QQQ because they remain in post-breakout moves and hit new highs. The chart below shows SPY with a wedge breakout and S&P 500 Advance-Decline Percent surging above +80% on October 14th (first indicator window). The move continued and there was a Zweig Breadth Thrust on October 25th (bottom window). SPY may be short-term overbought after an 8.42% advance in 22 days, but it is by no means weak

The Russell 2000 ETF (IWM) is the talk of the town, but SPY and QQQ still have better looking charts (clear uptrends). IWM formed two triangles and broke out of the second triangle in the second half of October. The ETF caught a strong bid the last five days and broke above its March high to finally record a 52-week high. I am marking support at 220 and will consider this breakout valid as long as this level holds.

The Russell Microcap ETF (IWC) also broke out and StochClose turned bullish this week. IWM broke out of a small triangle consolidation and exceeded its September high. The ETF remains within a larger falling channel, but I would expect a breakout here too because the Market Regime is bullish and participation is broadening.  

Wedge/Flag Breakout mid October, New High this Week

XLK, CIBR

The tech-related ETFs remain in strong uptrends and are short-term extended. Extended or overbought conditions occur because of strength and represent a double-edged sword. Long-term, these strong moves affirm the overall uptrends. Short-term, these extended conditions increase the chances of a corrective period, which can involve a consolidation or a pullback. The setups evolved in the first half of October and there are no setups on the charts right now. Just strong uptrends and relative strength.  Note that the tech-related ETFs in the first two groups are up between 10.5% (XLK) and 13.6% (SOXX) the last 22 days. Now is time to manage the trade or investment by considering profit targets, trailing stops or a trend-based exit strategy (trend-monitoring phase).

You can learn more about exit strategies in this post,
which includes a video and charting options for everyone.

Sep-Oct Pullback, mid October Harami Breakout, New High

SKYY, IGV, SOXX

You can learn more about my chart strategy in this article covering the different timeframes, chart settings, StochClose, RSI and StochRSI.

ETFs in this next group also hit new highs in early September, pulled back into early October and broke out in mid October. All extended on their breakouts, but have yet to hit new highs, though some are very close. The Healthcare SPDR (XLV) and Medical Devices ETF (IHI) feature here, as well as the REIT-related ETFs (XLRE, IYR, REZ). Again, the setups were in the first half of October and these ETFs are currently in the trend-monitoring phase.

Stalling after Breakouts and Advances

XLE, FCG, XES, XOP, AMLP

The energy-related ETFs remain in uptrends, but they became extended in late October and stalled the last week or two. I do not see any falling flags, wedges or pennants yet so it is still pretty early in the pullback stage. XLE, FCG and XOP are not short-term oversold yet, but the Oil & Gas Equipment & Services ETF (XES) and MLP ETF (AMLP) are mildly oversold. The charts below show RSI dipping below 50, which is the very first oversold threshold (mildly oversold). The chart below shows XES stalling for three days and a break above this week’s high would be short-term bullish. Keep in mind that this is a VERY short-term setup. The second chart shows AMLP with a two week dip that could be a falling flag. A break above this week’s high would be short-term bullish.

You can learn more about falling wedge patterns in this video.

There is no real change in the finance-related ETFs as they extended on their prior breakouts. Long consolidations formed after new highs in spring and the Sep-Oct breakouts signaled a resumption of the bigger uptrends. These ETFs stalled a little as the 20+ Yr Treasury Bond ETF popped and the 10-yr Treasury Yield fell back, but they surged yesterday as TLT fell and the 10-yr bounced. Truth-be-told, the trend in yields is just one narrative affecting banks and there are other narratives in play. We cannot expect to be aware of all narratives and we are usually better off focusing on the price chart. The Bank SPDR (KBE) and Regional Bank ETF (KRE) broke out of long triangle consolidations, both surged the last five days and they hit new highs. This is bullish price action. I do not see a short-term setup so they are in the trend-monitoring phase.

You can learn more about ATR Trailing stops in this post,
which includes a video and charting option for everyone.

There is no change in the Electric Vehicle ETFs as all three hit new highs this week and extended on their moves. These three are up 13 to 16 percent the last twenty days and also short-term extended. The legacy auto maker ETF (CARZ) is headed for a date with the upper line of a rising channel after a wedge breakout in mid October. I would not call this a hard resistance level, but the move to this line does suggest that the ETF is getting short-term extended. The Autonomous EV ETF (DRIV) is above this line with an even stronger advance the last four weeks.

ETFs in the next group formed extended consolidations and are in the process of breaking out. The Agribusiness ETF (MOO) actually broke out in mid October and edged higher after the breakout. MOO did not hit a new high this week, but the breakout is bullish and the ETF hit a new high in late October. The green line marks key support going forward.

The Retail SPDR (XRT) is new to the party with a long falling channel to the rising 200-day SMA and a strong breakout this week. XRT became unwieldy in early 2021 when Gamestop and the meme stock phase hit. The ETF has finally settled down and this breakout is bullish for retail overall.

The Food & Beverage ETF (PBJ) formed a long triangle consolidation from June to September and appeared to break out in early October. There was no follow through to the breakout as the ETF consolidated with a smaller triangle. PBJ broke out of the smaller triangle this week. Overall, I would consider this breakout valid as long as PBJ holds above 42 (closing basis).

The Momentum Composite aggregates signals in five momentum indicators. RSI(10) is oversold below 30 and overbought above 70. 20-day StochClose is oversold below 5 and overbought above 95. CCI Close (20) is oversold below -200 and overbought above +200. %B (20,2) is oversold below 0 and overbought above 1. Normalized ROC (10) is oversold below -3 and overbought above +3. Normalized ROC is the 10-day absolute price change divided by ATR(10). -3 means three of the five indicators are oversold and +3 means three of the five are overbought.

The Momentum Composite and StochClose are part of the TIP Indicator Edge Plugin for StockCharts ACP. Click here for more details.

The Transports ETF (IYT) continued its post breakout run with further gains this past week. Overall, the falling wedge retraced 33-50 percent of the prior advance (45%) and returned to the rising 200-day SMA. IYT firmed in the second half of September and broke out in mid October. The ETF is extended after a big run the last four weeks, but bullish overall.

The Airline ETF (JETS) is a part of the Transport group and a lagging part. The ETF fell in October and seriously underperformed the broader market, which surged. JETS remains in a downtrend overall, but there are signs of support in the 21-22 area (green shading) and the ETF broke short-term resistance with a bounce this week (red line). Also notice that JETS firmed in the 50-67% retracement zone and the ETF was short-term oversold last week (Momo Comp at -3). There was also a StochRSI pop on Monday.

ETFs in this group are lagging to some degree because they have yet to hit new 52-week highs. They are showing some upside strength since early October with big moves that broke short-term resistance within bigger corrective patterns. XLB is the only one of the group to clear its August high, but the other three are quite close. The breakouts within the corrective patterns provided the early bird signals. The long-term signals would be breakouts from these corrective patterns and/or bullish StochClose signals. There is no short-term setup right now and these ETFs are up 6-10% the last 22 days (somewhat extended short-term).

The Biotech ETF (IBB) and Biotech SPDR (XBI) came to life with big moves the last five days. Note that these two were featured on October 22nd (here). IBB provides a good example of the setup and signal. First, the ETF retraced around 2/3 of the prior advance, which is normal for a retracement within an uptrend. Second, the Momentum Composite became oversold from 28-Sep to 10-Oct with several dips to -3 or lower. The retracement zone and oversold conditions provided the setup, but IBB was still in the falling knife category because there was no sign of buying pressure or a bullish catalyst. The first sign came with the StochRSI pop on 12-Oct, the second with the small gap on 14-Oct and the third with the short-term breakout on 25-Oct.

The setup in Biotech SPDR (XBI) was completely different, even though these two are highly correlated. The ETF did not become oversold in September-October and was not in an uptrend. Instead, there was lots of support in the 120 area and seasonality for XBI was quite bullish in November. As such, I focused on the short-term downswing (Sep-Oct) and watched for a short-term breakout, which we got on Monday. XBI followed through with strong gains on Tuesday-Wednesday. I would consider this surge-breakout bullish as long as the October lows hold (122).

ETFs in this next group are struggling a little since early October. They have bullish setups working, but we have yet to see short-term breakouts on the price charts. I put FDN in this group because Meta Platforms (Facebook) and Alphabet (Google) are top holdings. FB accounts for 21% of XLC and 6.7% of FDN. GOOGL accounts for 25% of XLC and 10.3% of FDN.

The first chart shows XLC with a falling wedge, the Momentum Composite becoming oversold on 20-Sept and a StochRSI pop on 27-Sept. XLC drifted lower after this pop, but managed to firm in the 78-80 area the last five weeks (green shading). I am still erring on the bullish side because the market regime is bullish and the ETF is in a long-term uptrend. XLC still has a bullish setup so I am watching for a short-term resistance break and/or another StochRSI pop. The second chart shows FDN with a small wedge breakout.

The next chart shows the Sports Betting iGaming ETF (BETZ) with a 22% surge in July-September and a triangle of sorts taking shape. It may be premature to draw the lower trendline because the ETF has yet to really bounce. A bounce from here and breakout, however, would be bullish and signal a continuation of the prior advance.

ETFs in this next group fell sharply the last few weeks and returned to their breakout zones, which turn into first support. The Momentum Composite did not dip to -3, but RSI did dip into the 40-50 zone to become mildly oversold.  Note that RSI turns blue when it dips below 50 and red when it dips below 40, which is more oversold. The chart below shows the Copper ETF (CPER) with a breakout surge and throwback to the breakout zone. This decline also retraced 67% of the October surge. Thus, price is in the retracement zone and RSI is mildly oversold, which is a bullish mean-reversion setup. I will now watch StochRSI for a pop above or a price break above 27.

The Dry Bulk Shipping ETF (BDRY) provides a good example of a falling knife that continues to fall. The ETF was became oversold on 22-Oct when the Momentum Composite dipped to -3 and dipped to -3 or lower several times, including Wednesday. The ETF bounced two days last week, but did not break a short-term resistance level and I do not see a short-term pattern in play (flag, wedge). Moreover, StochRSI did not pop. DBRY remains with a setup because it has not retraced 50-67 percent of the prior advance and remains oversold. However, it often takes time to recover after such steep declines. This means we could see a bounce and then retest. Also keep in mind that volatility (risk) is through the roof for this one.

Thanks for tuning in and have a great day!

-Arthur Hill, CMT
Choose a Strategy, Develop a Plan and Follow a Process

Scroll to Top