The next Chart Trader will be posted on Thursday morning, February 1st.
Broad Market Recap
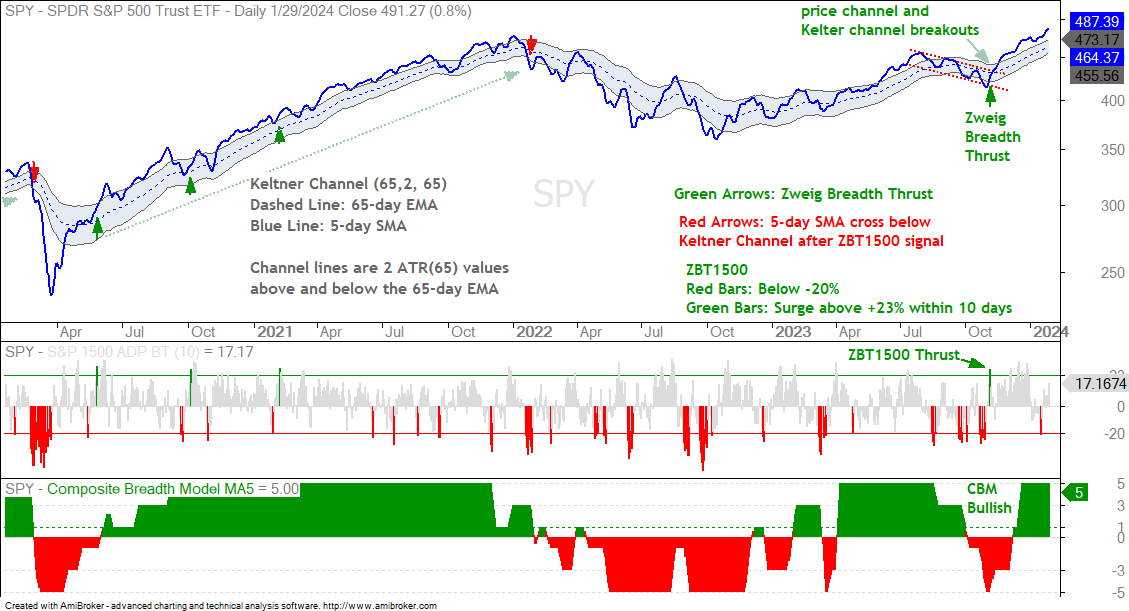
The broad market environment remains bullish with SPY and QQQ leading the way. This bull market started with the Zweig Breadth Thrust (ZBT1500) on November 3rd (green bar) and channel breakout in SPY a few days later. SPY also moved above the upper line of the Keltner Channel. The advance broadened in December with the Composite Breadth Model turning bullish (lower window).
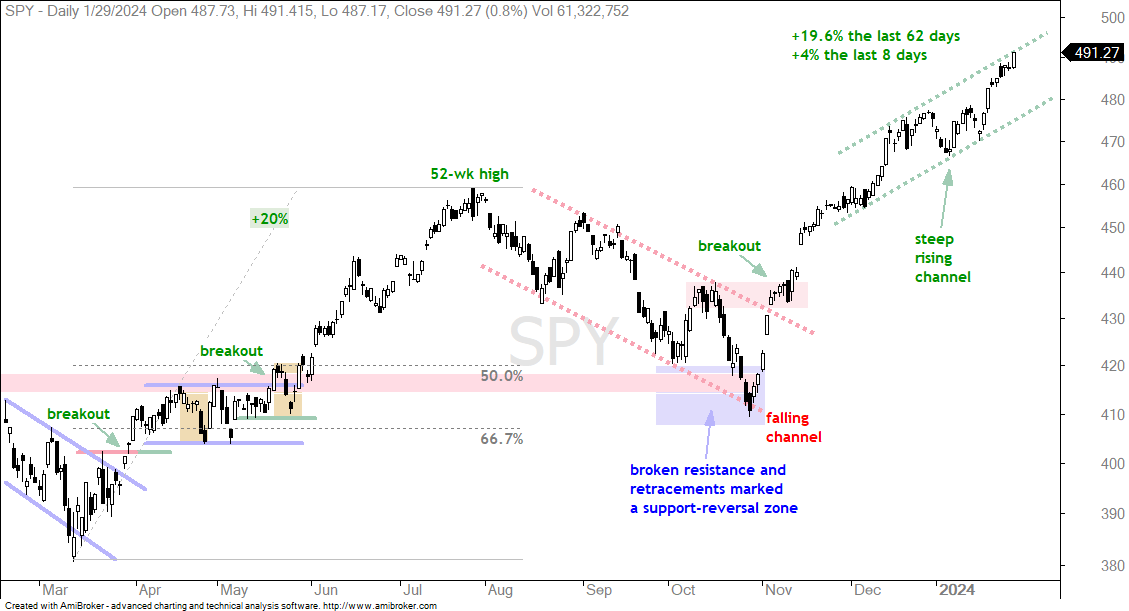
SPY and QQQ are extended after big advances since late October. SPY is up 19.6% since late October (62 days) and up 4% the last eight days. Corrections and pullbacks do occur in bull markets, but timing a counter-trend move is very difficult because stocks can become overbought and remain overbought. This is what we are seeing now. Stocks became overbought with big surges and remain overbought (strong) as price continues higher.
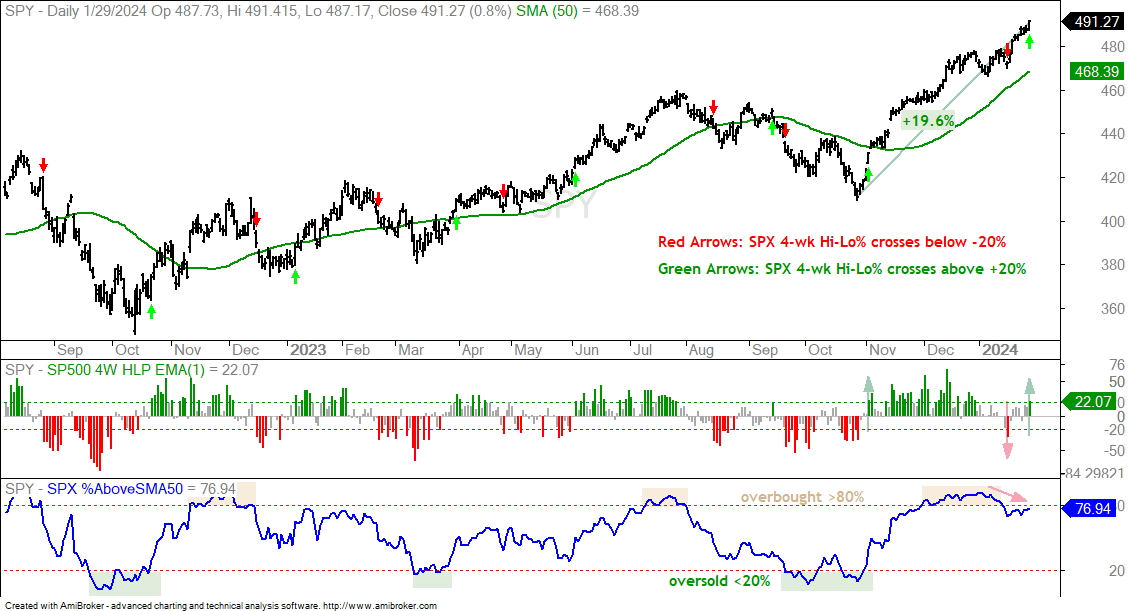
The next chart shows 4-week High-Low Percent for S&P 500 stocks in the first window. This is the percentage of stocks recording 4-week highs less the percentage with 4-week lows. This indicator dipped below -20% last week as the percentage of 4-week lows expanded. The red arrows show prior occurrences on the price chart. SPY did not continue lower after this signal. Instead, SPY surged and 4-wk High-Low Percent moved back above +20% on Monday.
The bottom window shows the percentage of S&P 500 stocks above the 50-day SMA. This indicator moved above 80% on December 1st and became “overbought”. It remained above 80% until January 16th. SPY surged to new highs the last six days, but SPX %Above 50-day SMA remains below 80%. This minor divergence means fewer stocks are getting back above their 50-day SMA.
Seasonal Pattern for S&P 500
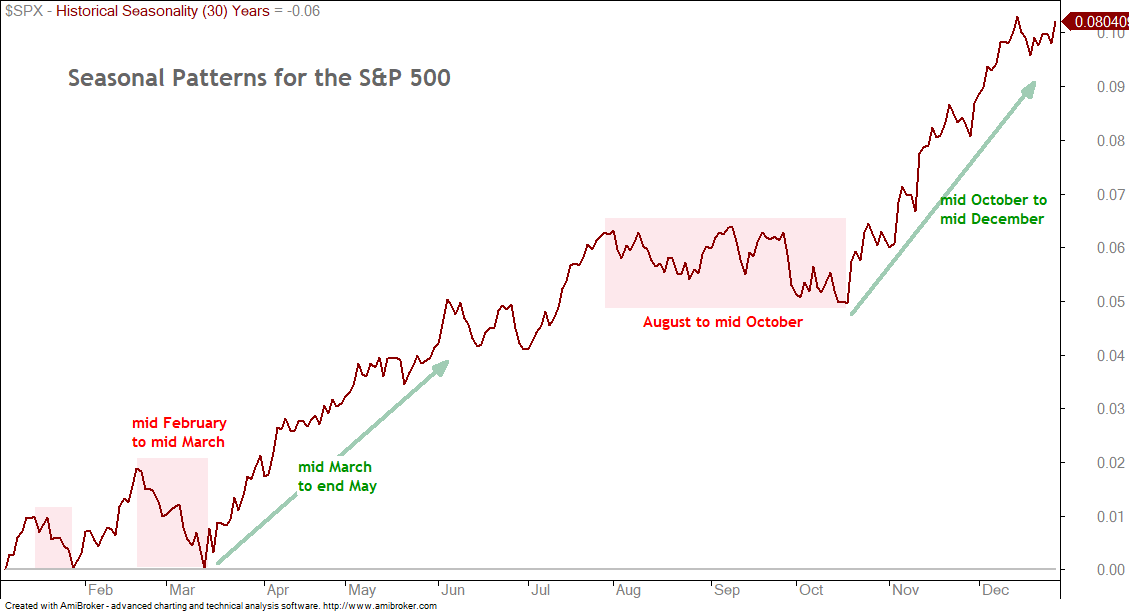
Even though timing a correction within a strong uptrend is difficult, the seasonal pattern for the S&P 500 argues for a correction sometime between now and mid March. Two negative periods stand out: mid February to mid March and August to mid October (red shading). Seasonally speaking, February is one of the weakest months.
SPY and QQQ Hit Top of Rising Channels
There is no change in the charts for SPY and QQQ. Both surged in early November with exceptionally sharp advances. SPY surged 9.1% and QQQ was up 10.8% in one month. These advances continued in December and January, but at a slightly slower pace. SPY is up 8% the last two months and QQQ is up 10%. Even so, the advance since early December is quite steep with a rising channel taking shape. The chart below shows SPY hitting the top of the channel. I would not call this a “hard” resistance level. It just indicates that SPY is quite extended and could fall back into the channel.
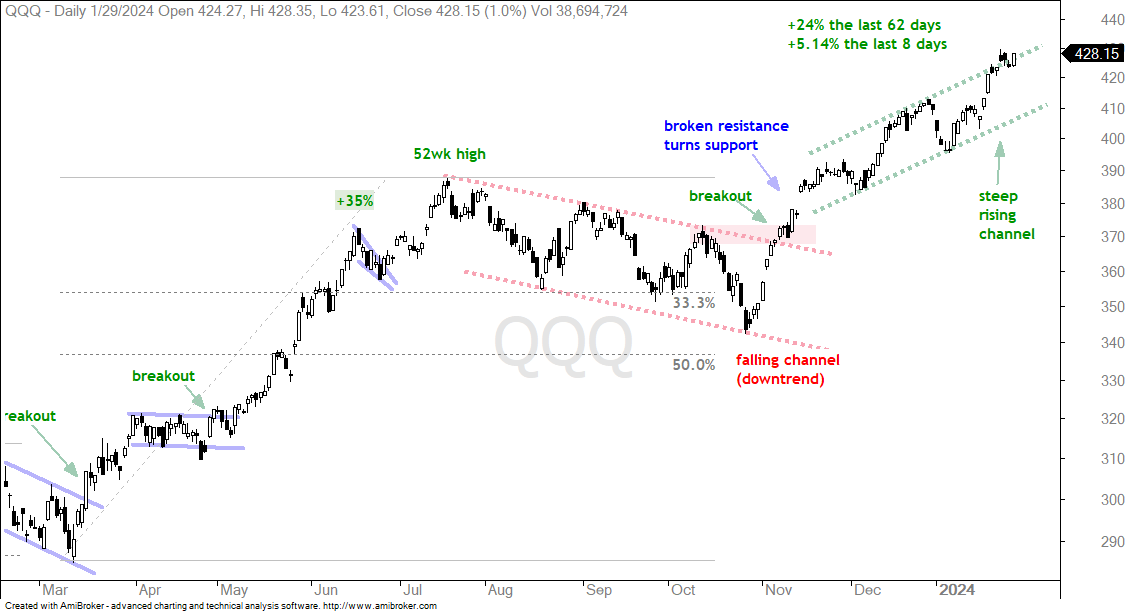
The next chart shows QQQ hitting the upper line of the rising channel the last four trading days.
Chart Analysis, Setups and Trading Ideas
S&P SmallCap 600 SPDR Breaks Out
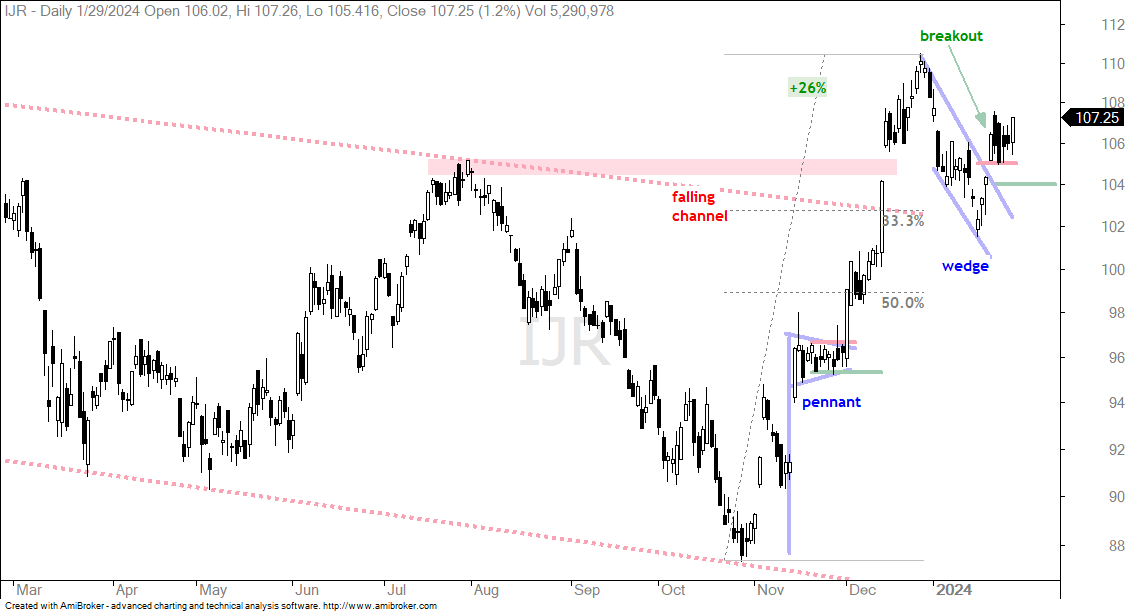
The next chart shows the S&P SmallCap 600 SPDR (IJR) breaking out of a falling wedge with a surge on January 22nd. This move broke the wedge line and the red resistance line with a gap. The gap held last week as IJR stalled above the breakout. I am marking re-evaluation support at 104 and a close below this level would negate the breakout.
XLB Breaks Channel Line
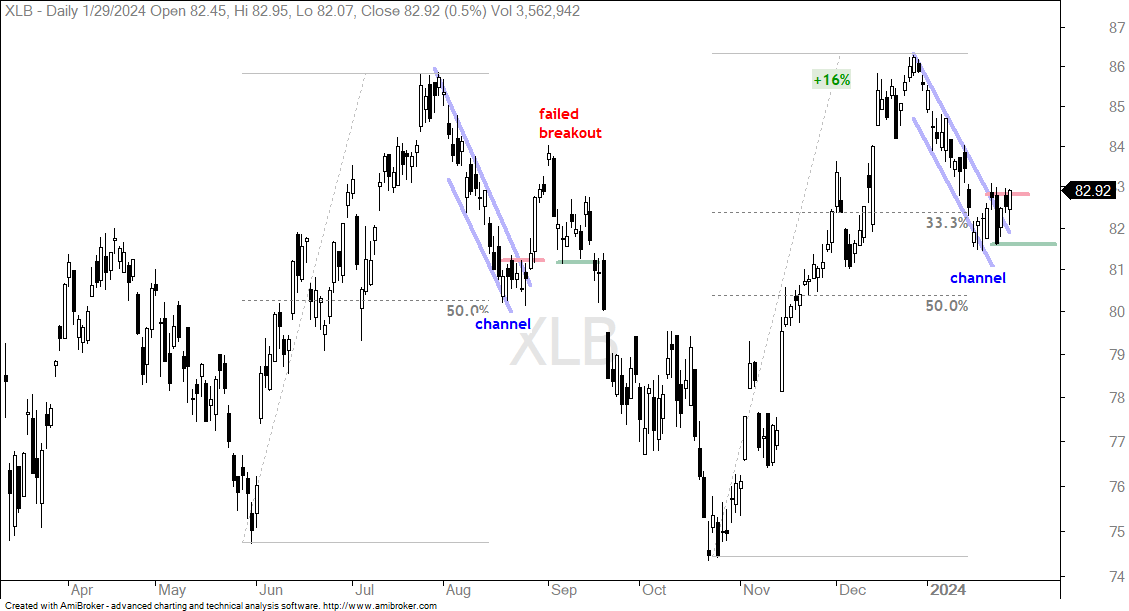
The Materials SPDR (XLB) corrected with a falling channel in January and broke the upper line with a surge the last three days. Overall, XLB has been range bound for a year with resistance in the 86 area and support in the 74 area. The ETF advanced 16% with the broad market rally and then retraced just over a third with the January decline. This is a normal retracement after a big advance and the falling channel is typical for a corrective pattern. I view the breakout as bullish and would set re-evaluation support at 81.50 (green line). Before moving on, note the similar setup in August 2023. XLB extended after the breakout, but then gave it all back as the breakout failed. This is also a possibility.
Celanese Turns Up after Normal Retracement
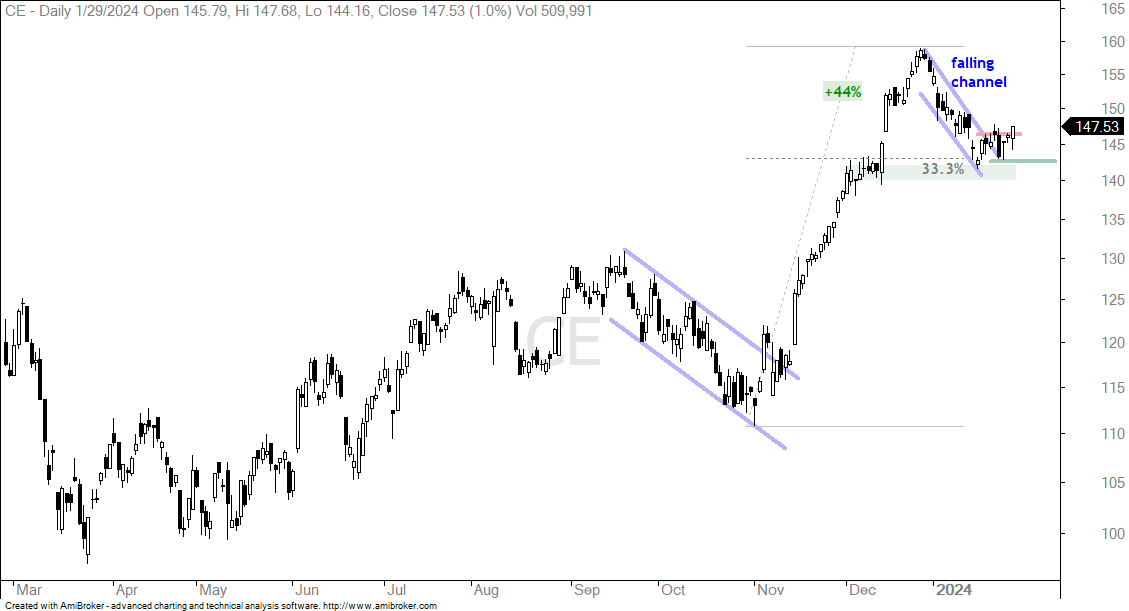
Celanese (CE) is a specialty chemical company and part of the Materials SPDR. Chemical stocks dominate XLB and account for 67% of the ETF. The chart shows CE with a pattern similar to XLB. A falling channel retraced one third of the prior advance and hit support from the early December consolidation (green shading). This amounts to a Support-Reversal Zone. CE turned up the last eight days and broke short-term resistance on Monday. This breakout is bullish and I would set my initial re-evaluation level at 142.50. Celanese reports earnings on February 20th.
Steel Dynamics Bounces off Support-Reversal Zone
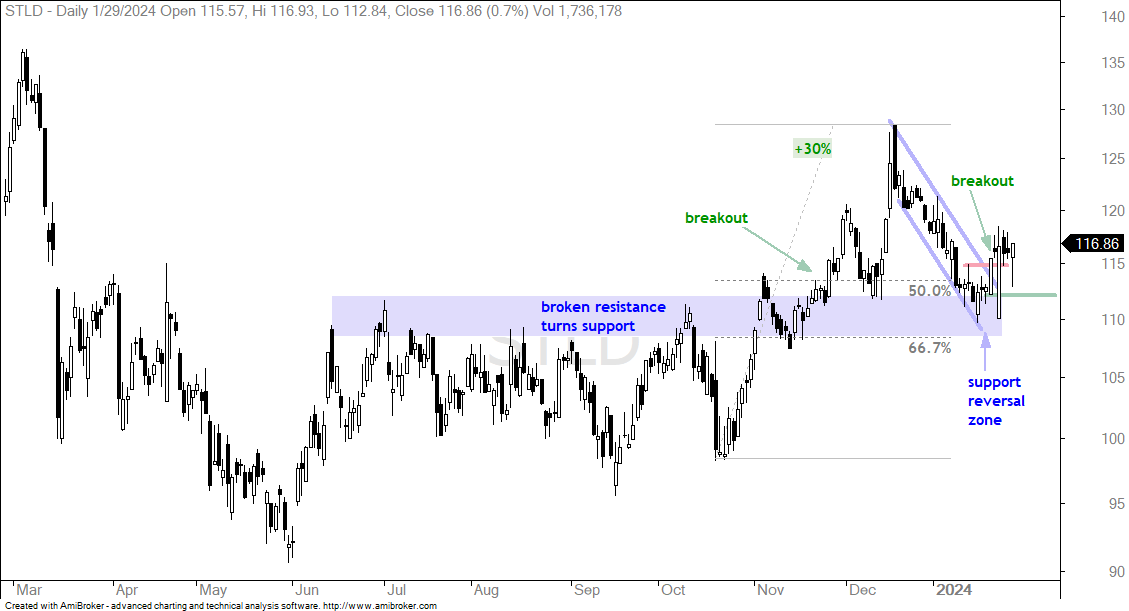
Steel Dynamics (STLD) is also part of the Materials SPDR with the Metals-Mining group accounting for 16.7% of the ETF. The chart shows STLD breaking out with a 30% advance into late December and falling back into mid January. STLD fell back to the breakout zone (blue shading) and this area becomes support. This decline also retraced 50-67 percent of the 30% advance. STLD firmed in this Support-Reversal Zone and then broke out with a surge last week. Price action turned quite volatile after the breakout with a dip to 110 last Wednesday and a dip below 113 on Monday. Overall, however, the breakout is holding. I would set my re-evaluation at 112 and re-evaluate on a close below this level. Steel Dynamics reported earnings on January 23rd.
Gold Goes for a Breakout
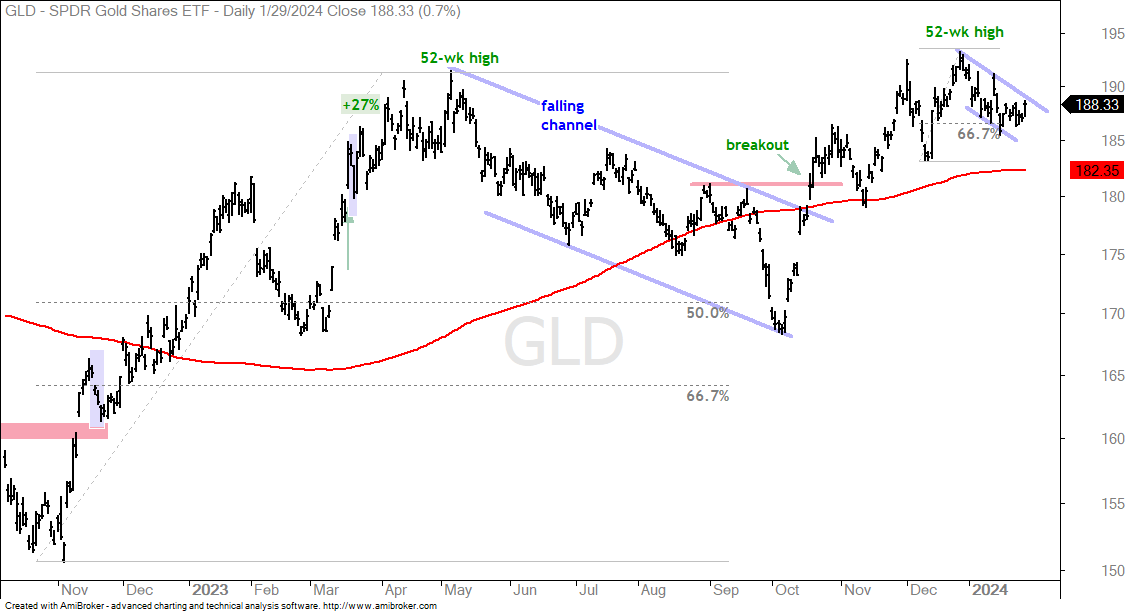
The Gold SPDR (GLD) remains in a long-term uptrend with a 52-week high in late December. GLD fell in January, but I view this as a correction within an uptrend that began with the October breakout. The ETF worked its way higher after this breakout and tagged a new high on December 27th. GLD then fell back with a falling channel that retraced around two thirds of the prior advance. Gold futures are up over 1% as of this writing and GLD could be poised for a breakout. Note that the Fed begins its 2-day meeting today and will make a policy statement on Wednesday. This means volatility could be above average for the Dollar, Gold, Bonds and Stocks.
FinTech ETF Breaks Wedge Resistance
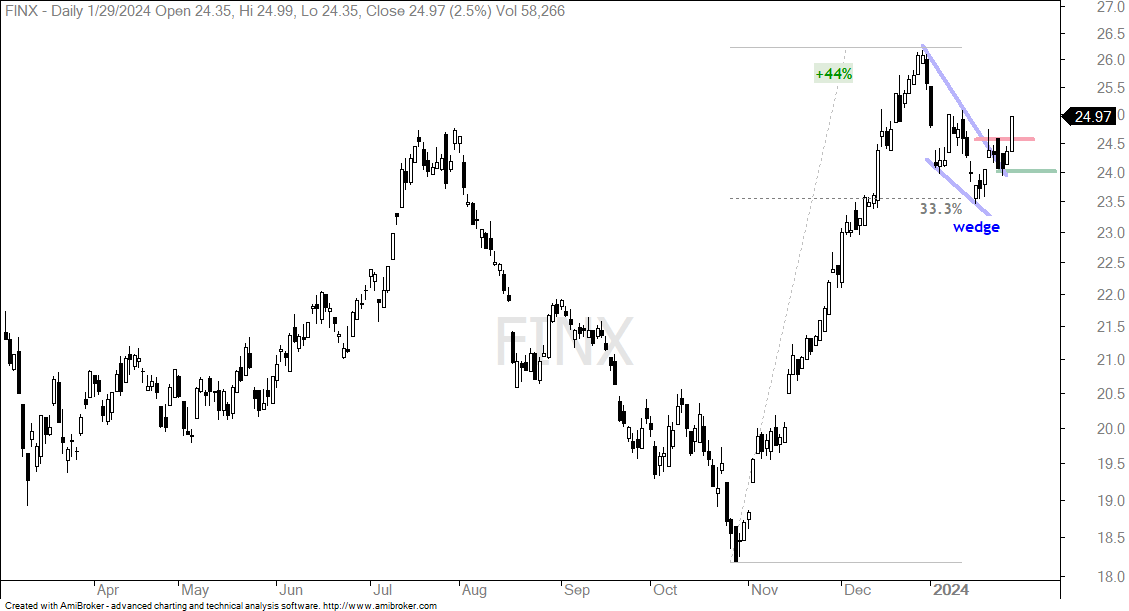
The FinTech ETF (FINX) led the market with a 44% surge from late October to late December. FINX went from a 52-week low to a 52-week high in just two months. Despite this big move, FINX is still well below its 2021 highs, which were around 53. On the price chart, FINX corrected with a falling wedge and broke out with a surge the last eight days. This breakout is bullish and I would mark re-evaluation support at 24. A close below this level would negate the breakout.
The Swing within the Pattern Setup
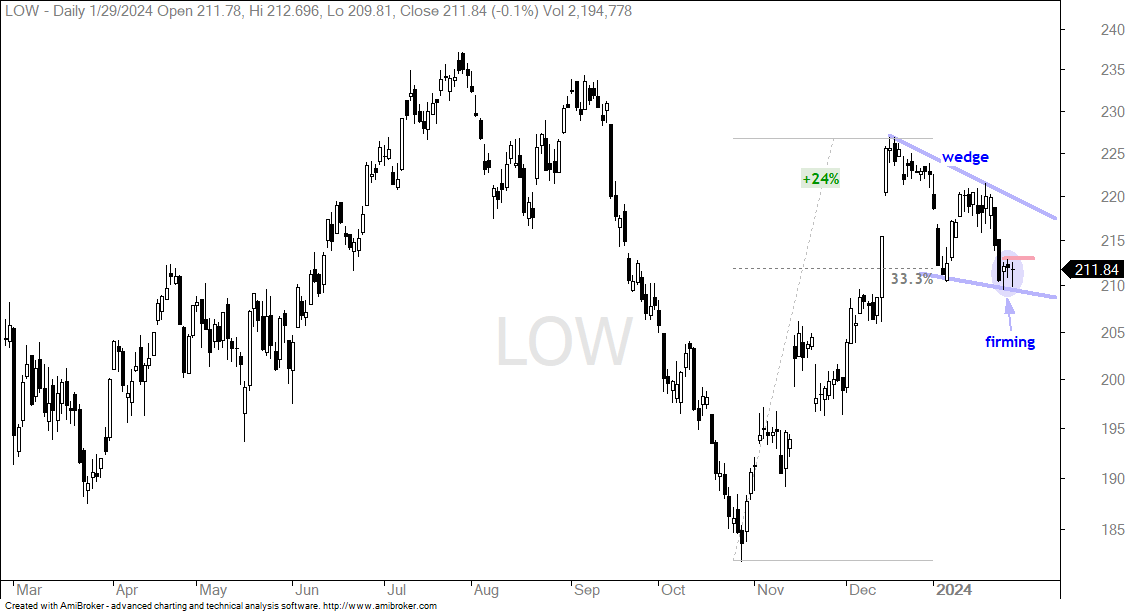
The chart for Lowe’s (LOW) shows an example of trading a swing reversal within a bigger bullish pattern. First, LOW surged 24% and then formed a falling wedge. This wedge retraced around one third of the prior advance. It is a bullish continuation pattern that represents a correction after the sharp advance. A breakout at 220 would confirm the pattern. There are three swings within the pattern (down, up and down). LOW fell to around 210 and firmed the last three days (blue oval). A breakout at 213 would be short-term bullish and reverse this downswing. Upon a breakout, I would re-evaluate on a close below 210. LOW reports earnings on February 28th.