The next Market Model update will be posted on Friday morning, August 30th.
This report covers the broad market environment and will be updated every Friday. We start with the breadth models to define the broad market environment (bull market or bear market). The first model covers the broader market, while the second model emphasizes the Nasdaq 100. And finally, we finish with yield spreads to assess conditions in the credit markets.
Two New Breadth Models
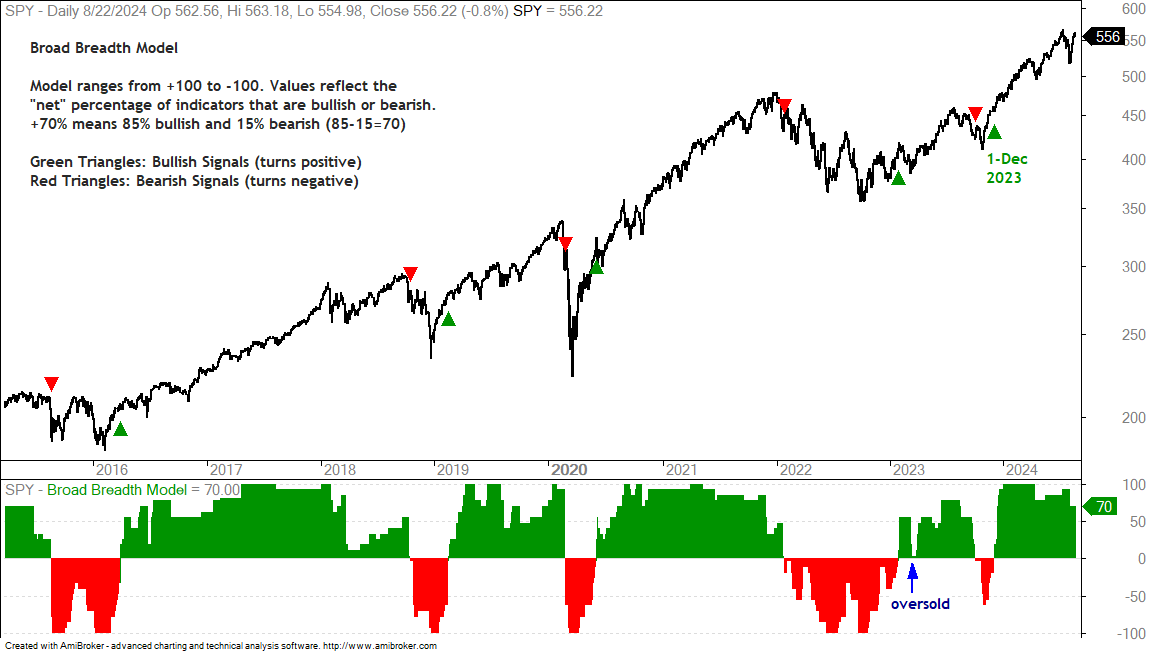
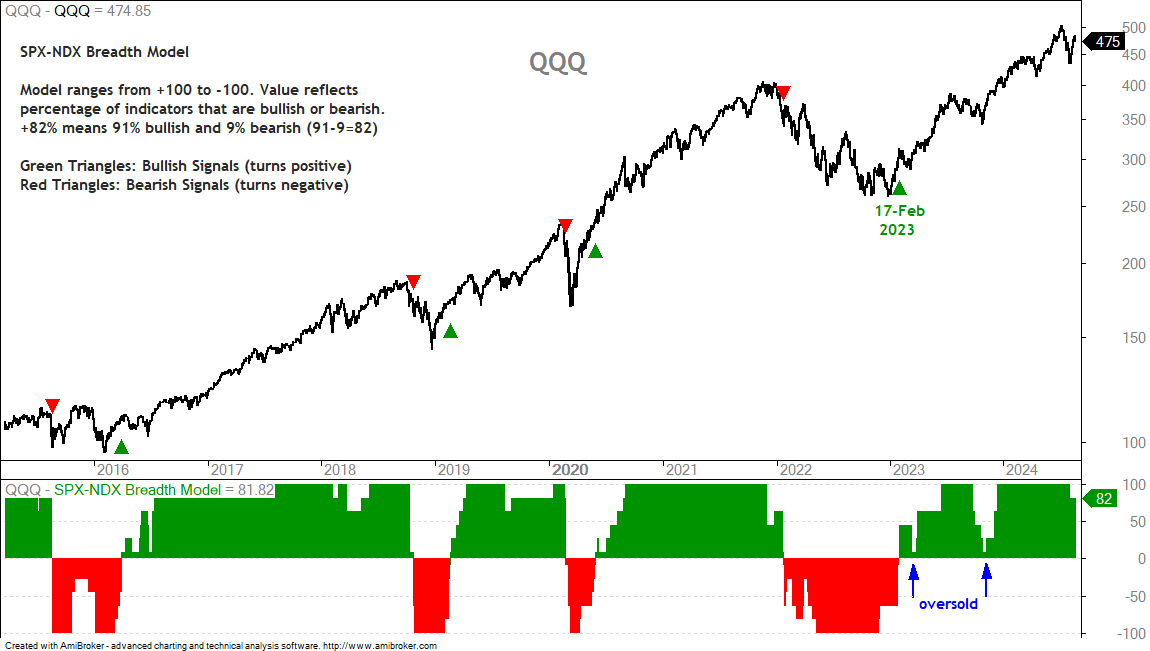
There are two new breadth models in town. Both range from +100 to -100. Bull markets signal when they turn positive and bear markets signal when they turn negative. Model values reflect the “net” percentage of indicators that are bullish or bearish. For example, +70% means 85% of indicators are bullish and 15% are bearish (85- 15 = 70).
The Broad Market Breadth model is based on 27 indicators. This model will eventually replace the Composite Breadth Model. SystemTrader strategies that trade S&P 500 stocks will use this Broad Market Model for market timing. The SPX-NDX Breadth Model is based on 11 indicators from the S&P 500 and Nasdaq 100. Strategies that trade stocks in Nasdaq 100 stocks will use the SPX-NDX Breadth Model for broad market timing. Using two models will help with strategy diversification.
Broad Breadth Model Remains Bullish
The Broad Market Breadth Model turned bullish on December 1, 2023. This model is currently at +70%, which means 85% of the indicators are on bullish signals and 15% are on bearish signals (85 – 15 = 70). It is a bull market environment for stocks in the S&P 500.
SPX-NDX Breadth Model Remains Bullish
The SPX-NDX Breadth Model turned bullish on February 17, 2023. The model is currently at +82%, which means 91% of the indicators are bullish and 9% are bearish (91 – 9 = 82). It is a bull market environment for Nasdaq 100 stocks. Notice that model values dipped below +10% in March and October 2023 (blue arrows). These dips represented corrections because the model remained positive.
Yield Spreads Fall back as Stress Subsides
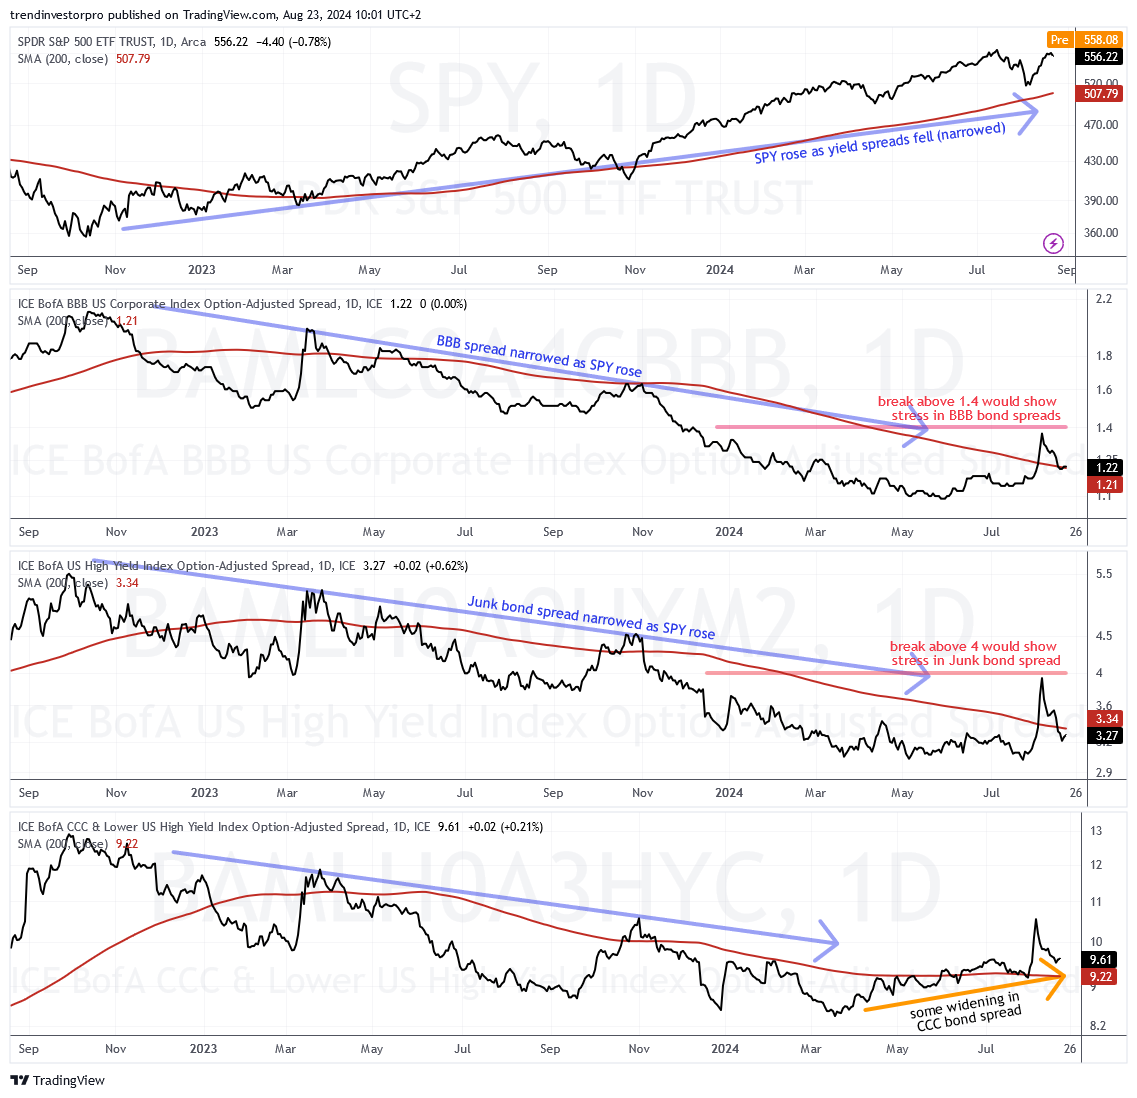
The chart below comes from TradingView. It shows SPY, the BBB spread, the Junk bond spread and the CCC bond spread with their 200-day SMAs. These yield spreads surged in early August and peaked on August 5th as news of the Yen carry trade unwind hit the markets. This widening in spreads immediately subsided as they fell back into their prior ranges. All three are still above their spring lows, but at relatively low (narrow) levels overall. More importantly, stress conditions subsided and this is positive for stocks. The red lines mark the key levels to watch for the BBB and Junk bond spreads.