The next Weekly Report will be posted on Friday morning, October 11th.
The weight of the evidence remains bullish for stocks. The Composite Breadth Model is positive, yield spreads are narrow, SPY is trading near a 52-week high and the S&P 500 EW ETF (RSP) is leading. Big tech was lagging, but we are seeing triangle breakouts in QQQ, Mag7 ETF (MAGS) and Technology SPDR (XLK). These breakouts are bullish until proven otherwise. The Semiconductor ETF (SOXX) is lagging a bit, while the other four tech ETFs tagged new highs in September (IGV, CIBR, FINX, SKYY). Elsewhere we highlight nine leading ETFs and review the charts for the commodity-related ETFs. This report ends with two healthcare related stocks breaking out (ILMN, INCY) and four AI stocks (NVDA, AVGO, TSM, MRVL).
Composite Breadth Model is Bullish
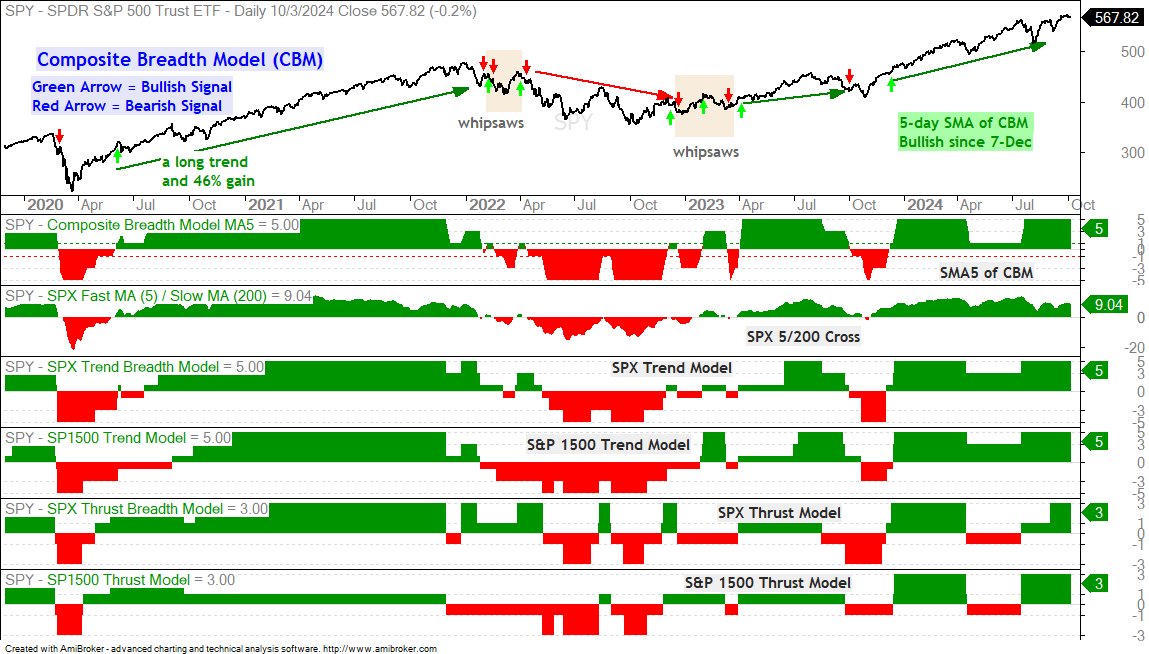
The chart below shows SPY with the 5-day SMA of the Composite Breadth Model at +5. This model turned bullish on December 7th and remains bullish. A positive CBM signals a favorable environment for stocks (bull market). Even within a bull market, we can still see pullbacks, corrections, volatility, rotations and trading ranges.
The Composite Breadth Model aggregates signals in over a dozen breadth indicators from the S&P 500 and S&P 1500. This means it covers large-caps, mid-caps, small-caps, NYSE stocks and Nasdaq stocks. It ranges from +5 to -5. A bull market is present when the 5-day SMA of the CBM is at +1 or higher. A bear market is present when below +1.
BAA-AAA Spread Remains Bullish for Stocks
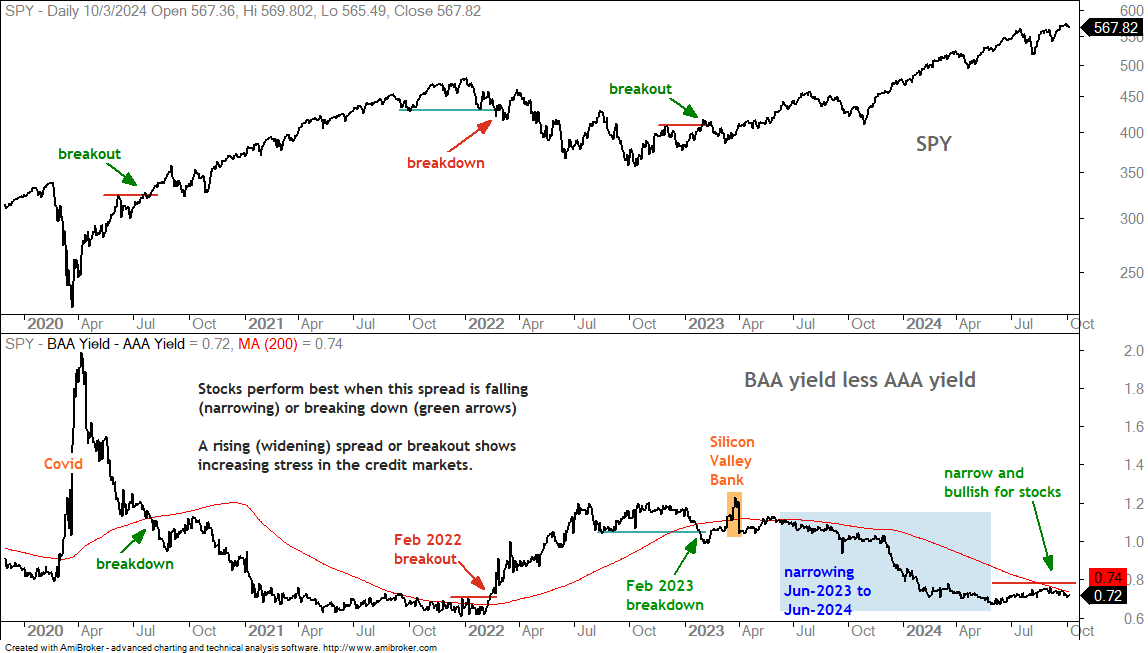
The next chart shows the BAA-AAA yield spread narrowing from June 2023 to June 2024 and then flat-lining at a relatively low level (blue shading). It remains below the red line (.78), which means the spread between the BAA and AAA yields is narrow and showing confidence in the credit markets (bullish for stocks). A break above .78 would put this spread at its widest level since January and signal increasing stress in the corporate bond market.
According to Moody’s, AAA bonds are the highest grade corporate bonds with the lowest level of default risk. BAA bonds have moderate credit risk and “certain speculative characteristics”. The spread between these two narrows (falls) when credit conditions are favorable (no stress). The spread widens (rises) when conditions are deteriorating (increasing stress).
BBB Spread Widens in Sept, but Remains within 2024 Range
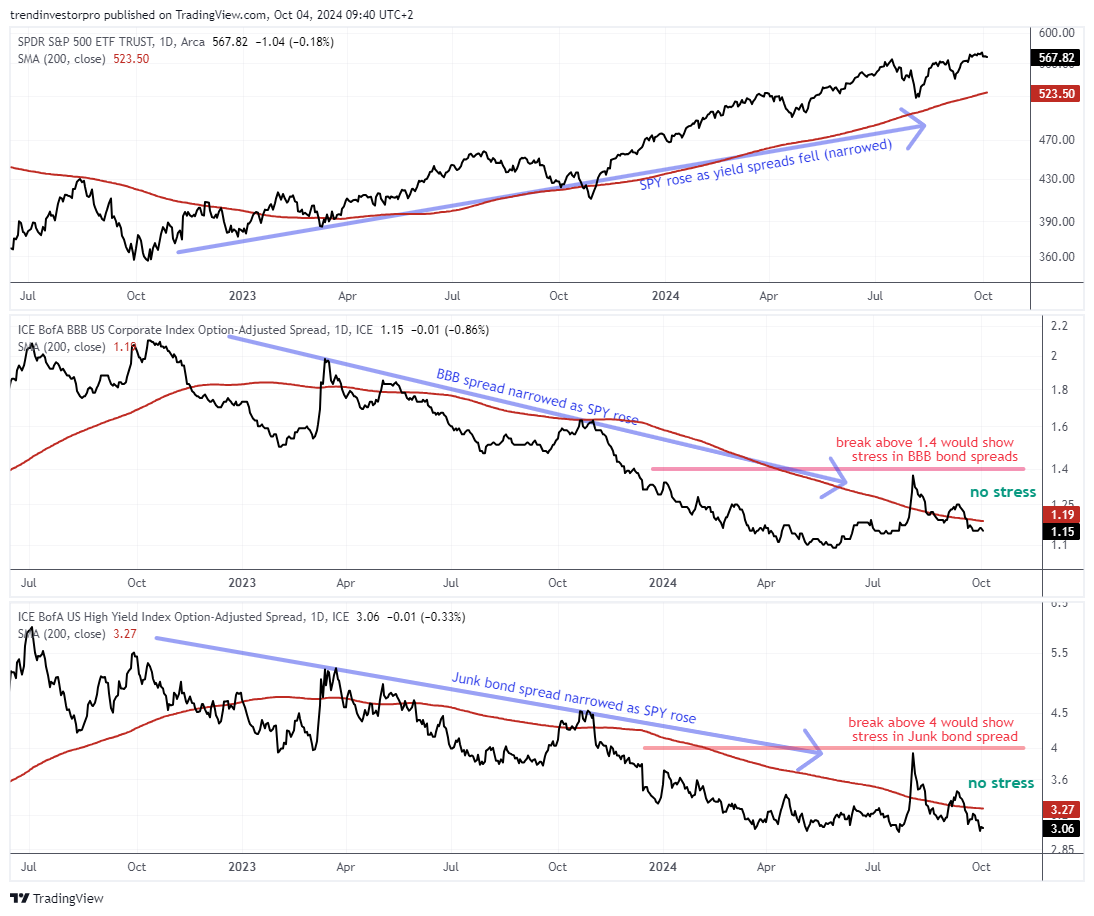
The next chart shows SPY, the BBB spread and the Junk bond spread with their 200-day SMAs. The BBB and Junk bond spreads widened sharply with a pop in early August, but quickly fell back and drifted lower the last two months. They are at narrow levels overall and showing confidence in the credit markets. Breakouts at 1.4 in the BBB spread and 4 in the Junk spread would be bearish for stocks.
These spreads show the difference between a corporate bond yield (BBB) and the equivalent US Treasury bond yield. BBB bonds are the lowest rated investment grade bonds. US Treasuries are the ultimate safe-haven bonds. The spread between these two widens (rises) when stress builds in the corporate bond market. This is negative for stocks. The spread narrows (falls) when stress levels are low or subsiding. This is positive for stocks.
Picking Your Point
While there is no guarantee for an October pullback or choppy range, volatility can be your friend and provide the dips required to enter at lower prices. We are in a bull market and some 70% of S&P 500 stocks are in long-term uptrends (above their 200-day SMAs). As long as the bull market and uptrends remain, a pullback is viewed as an opportunity, not a threat. This is where bullish setup zones come into play. Look for supports, prior resistance, key retracements and long-term moving averages to find such zones. The SPY chart below shows an example. See this report and video for more details.
SPY Stalls above Breakout Zone
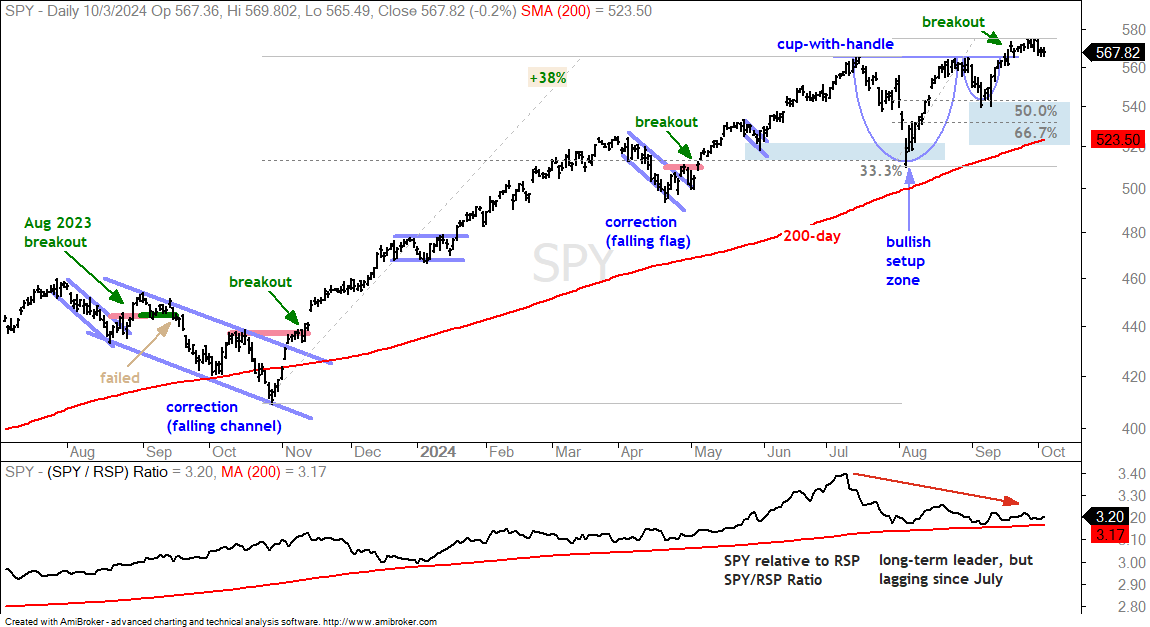
SPY remains in a long-term uptrend. The ETF is above the rising 200-day SMA and recently tagged a new high after breaking rim resistance from a cup-with-handle pattern. This is a bullish continuation pattern that represents a consolidation within the uptrend. The September 19th breakout signals a continuation higher, but we have yet to see much progress on the upside. In any case, SPY is in a confirmed uptrend and I do not see a setup right now.
At this stage, it is very challenging to guess what will happen short-term (the next five weeks). We could see an extension higher, a choppy decline back below the rim breakout or even a test of the 200-day SMA. Instead of trying to predict a short-term movement, I am removing my support marker at 540 and marking a potential bullish setup zone in the 520-540 area (blue shading). The rising 200-day SMA is around 523, the September low is around 540 and the 50-67 percent retracements are in the 542-532 area. A pullback into this zone could lead to a tradable setup.
QQQ, MAGS and XLK with Triangle Breakouts
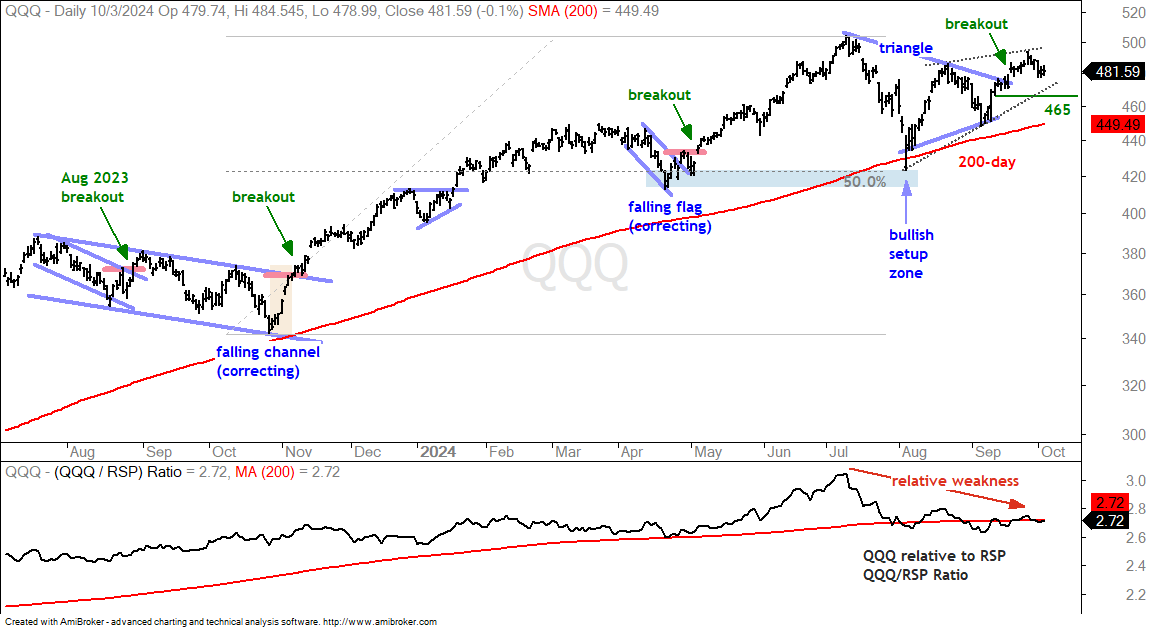
QQQ is in a long-term uptrend. The ETF is above its rising 200-day SMA and recently broke out of a triangle consolidation. Triangles represents a rest within the uptrend and subsequent breakouts signal a continuation higher. The triangle breakout is the active pattern for QQQ and it is bullish until proven otherwise.
The thin dotted lines on the chart above show the alternative pattern at work, which is a rising wedge. Rising wedges are bearish continuation patterns that form as counter-trend bounces. The immediate trend is up as long as the wedge rises. A move below 465 would break the wedge line and negate the triangle breakout. This would be short-term negative and we could then see a test of the August lows.
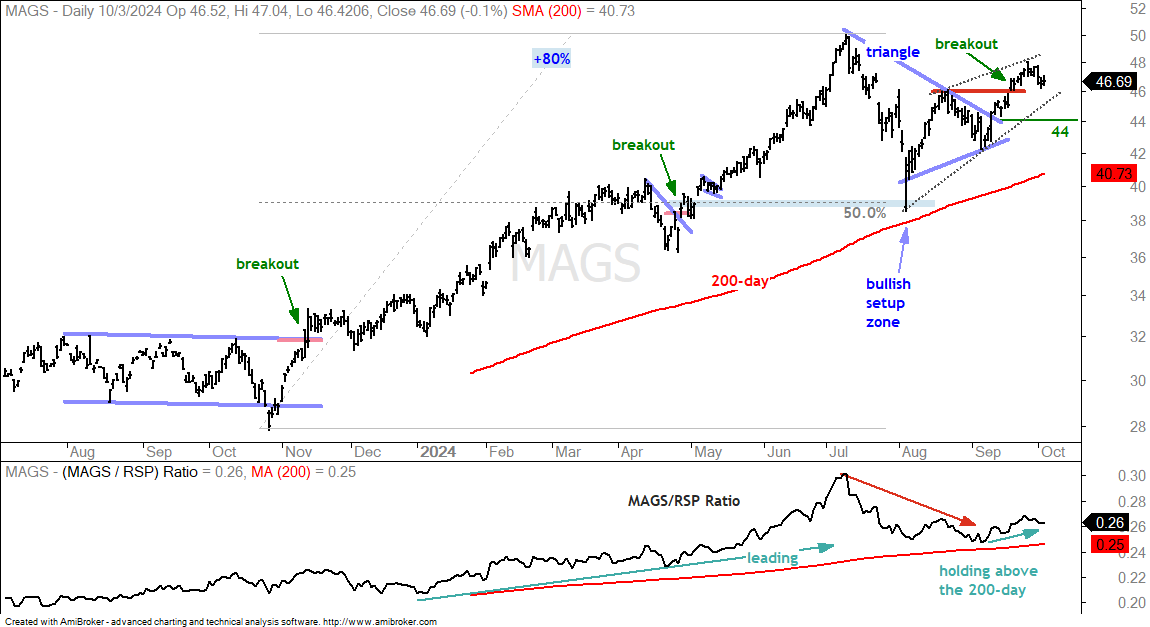
The next chart shows the Mag7 ETF (MAGS) with similar characteristics. The triangle breakout is the active pattern at work and bullish until proven otherwise. A rising wedge is possible and a break below 44 would negate the triangle breakout. This would activate the rising wedge and argue for a test of the rising 200-day SMA or August lows.
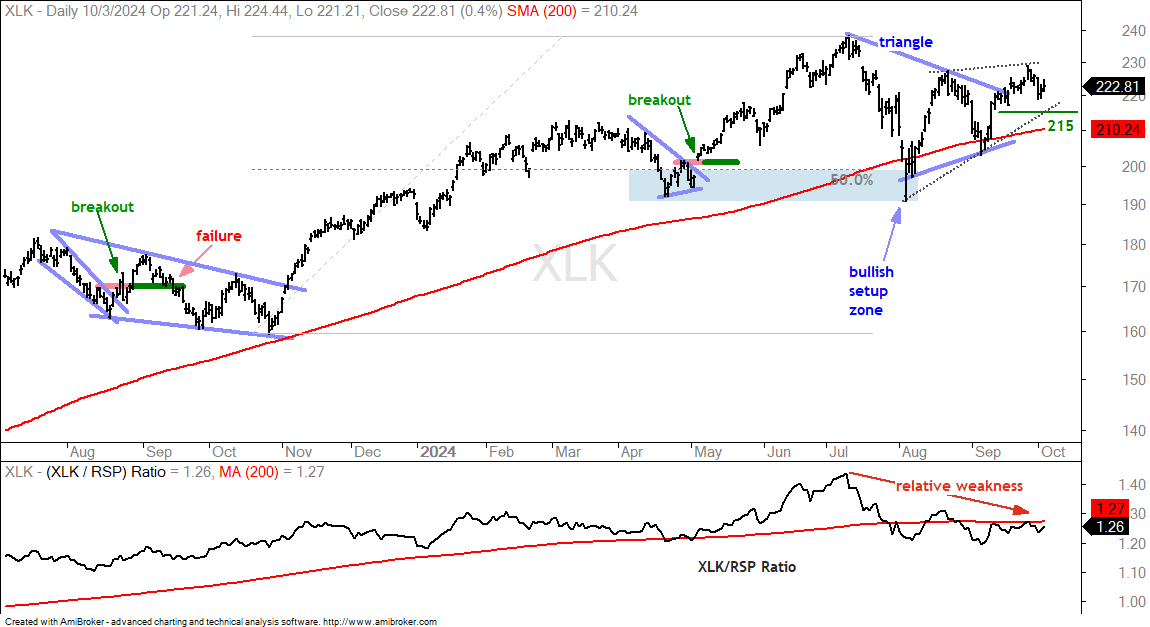
The next chart shows the Technology SPDR (XLK) with similar characteristics and support marked at 215.
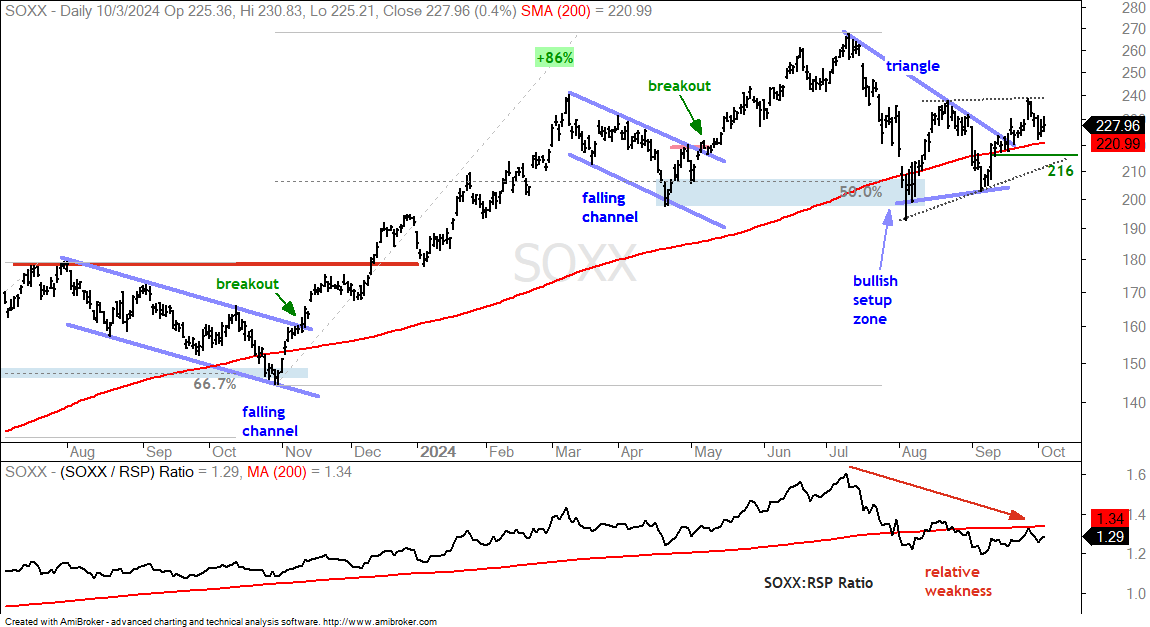
The next chart shows the Semiconductor ETF (SOXX) with a slightly different pattern at work. SOXX is lagging because it did not clear its August high. The ETF, however, is back above its rising 200-day SMA and still in a long-term uptrend. SOXX broke the triangle line in late September and this breakout is holding. I am marking re-evaluation support at 216. A break here would negate the triangle breakout and be negative.
Software, Cyber, Fintech and Cloud Pullback from New Highs
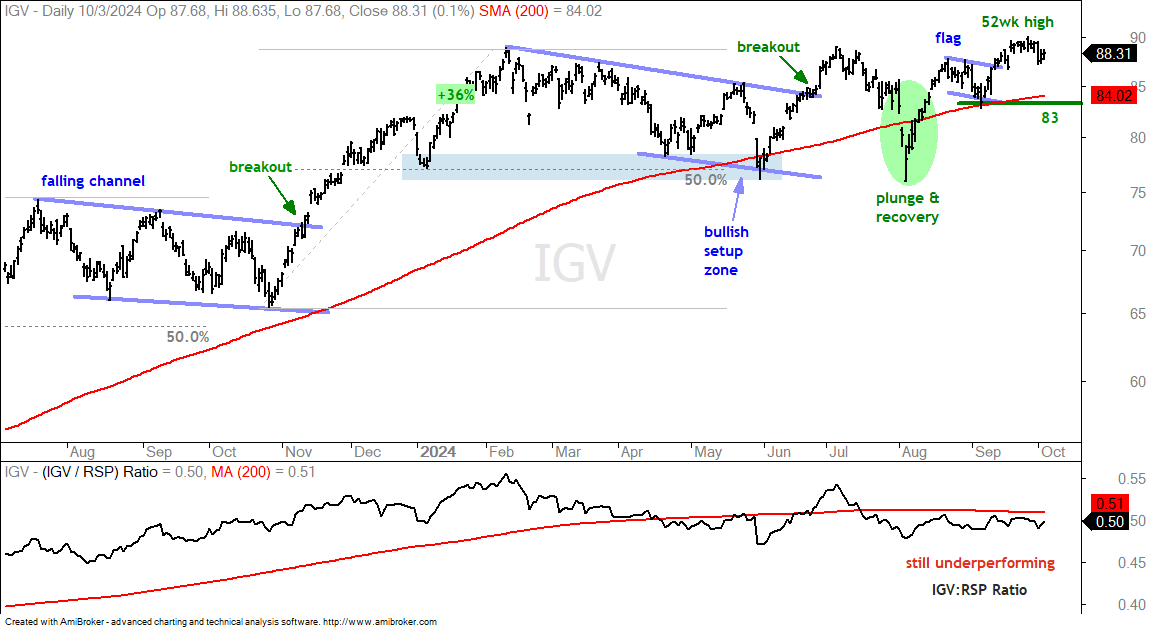
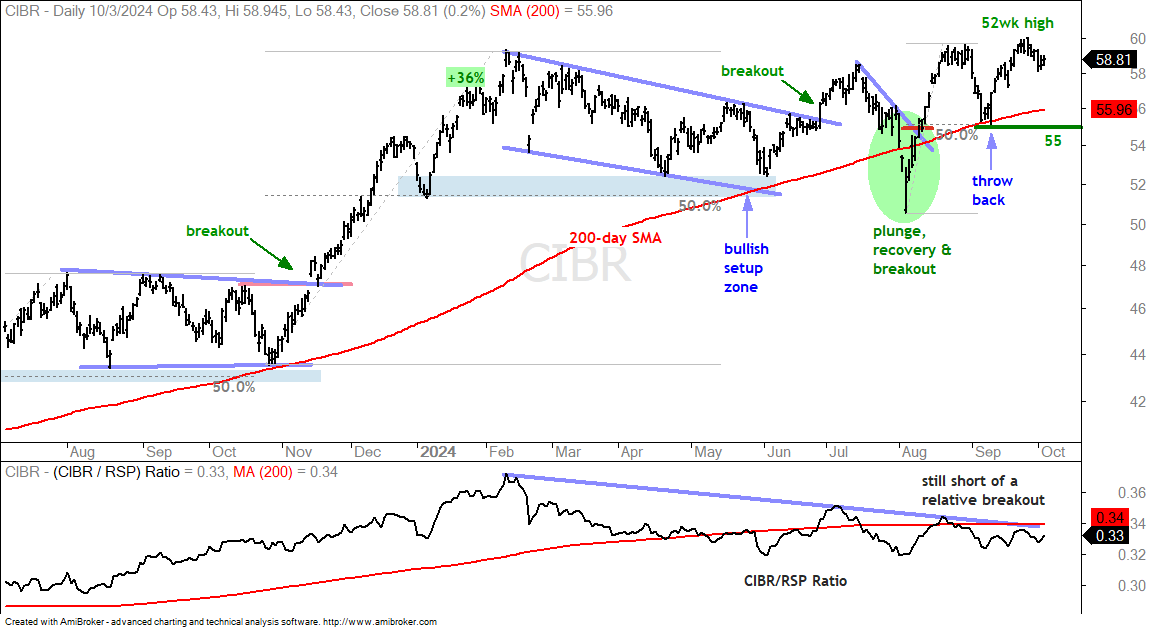
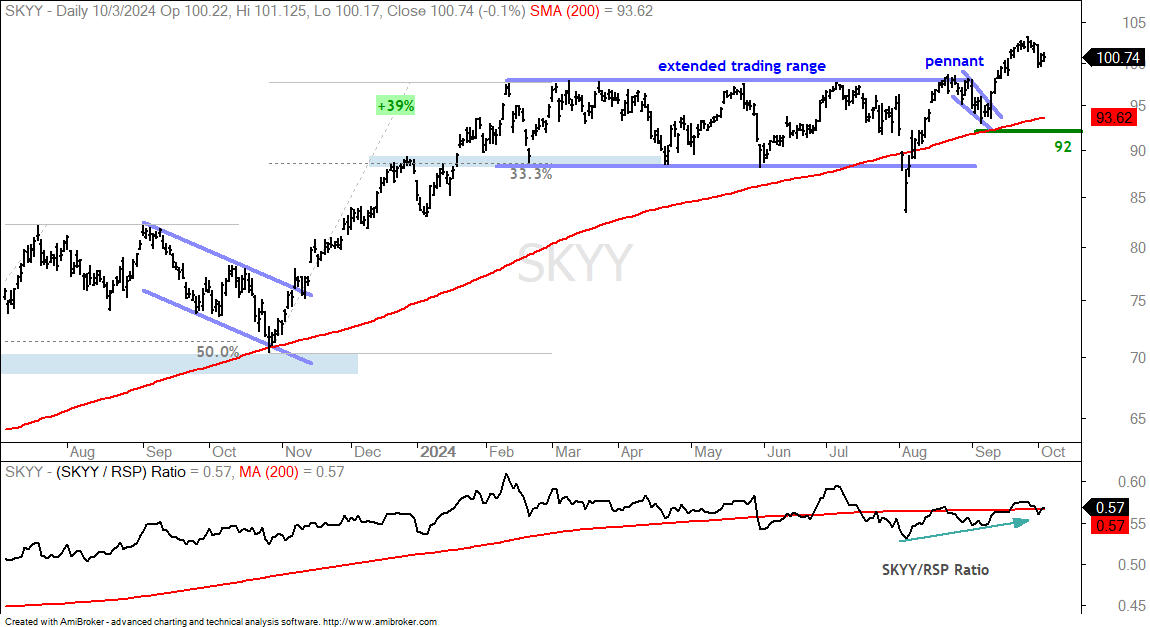
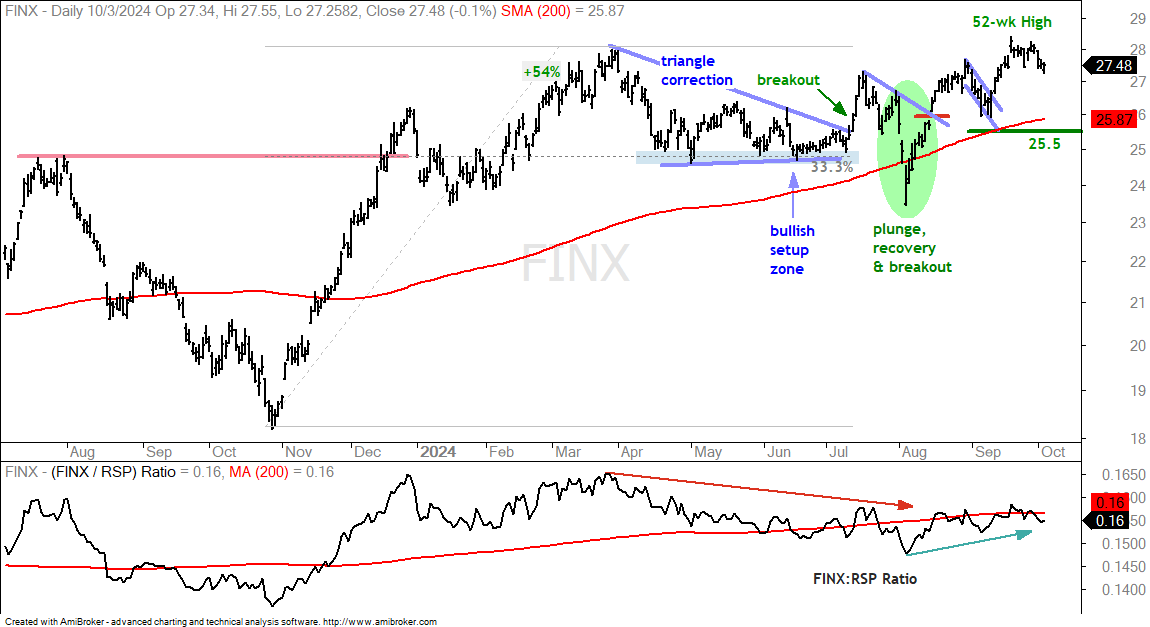
The Software ETF (IGV), Cybersecurity ETF (CIBR), FinTech ETF (FINX) and Cloud Computing ETF (SKYY) are stronger than the four tech-related ETFs above because they tagged new highs in late September. All four pulled back the last few days, but remain in long-term uptrends. I do not see any changes on these charts and will leave key support levels where they were. All four are in choppy uptrends since the July breakouts. A break below key support would argue for a re-evaluation of the long-term uptrend.
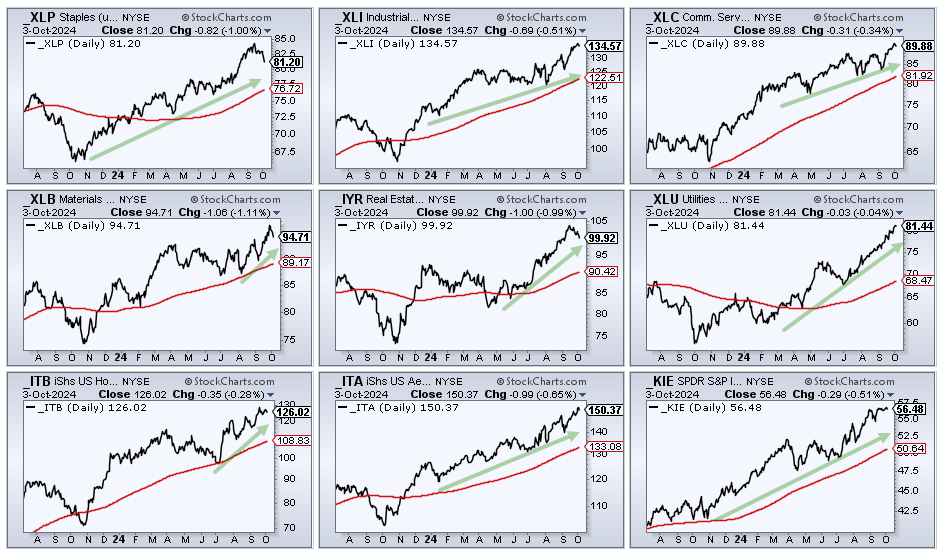
Leading Uptrends: Staples, Utes, Housing, Defense, Insurance
The CandleGlance chart below shows nine ETFs in leading uptrends. All nine recorded new highs in September and they are well above their rising 200-day SMAs. There are no setups on these charts as they remain in confirmed uptrends. XLU was looking extended two weeks ago and still looks extended after further gains. XLP fell back over the last two weeks and could be starting a corrective period after an extended run.
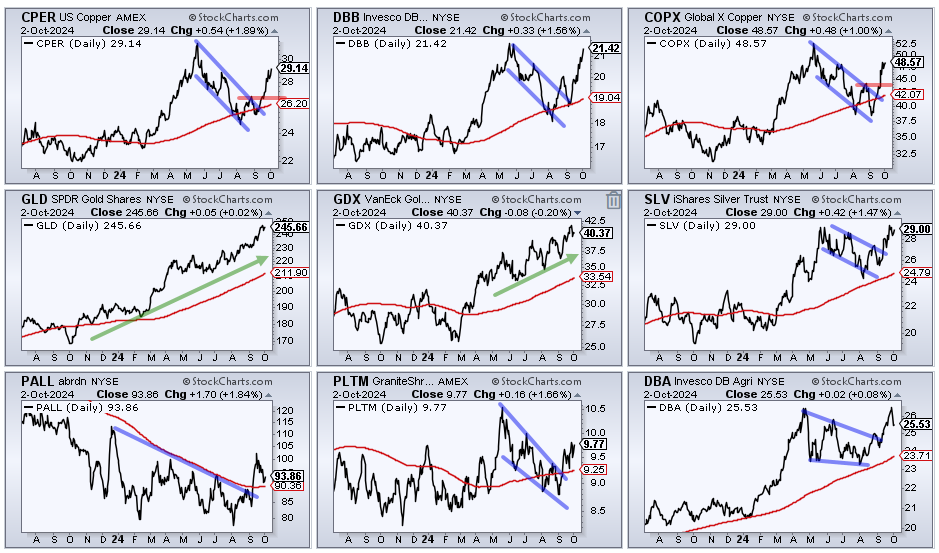
Industrial Metals ETFs Extend on Breakouts
The next CandleGlance chart shows nine commodity-related ETFs. The Copper ETF (CPER), DB Base Metals ETF (DBB) and Copper Miners ETF (COPX) are at the top and showing big breakout moves the last few weeks. Industrial metals ETFs were first featured on September 19th. The Gold SPDR (GLD) and Gold Miners ETF (GDX) are in leading uptrends, while the Silver ETF (SLV) broke out along with the industrial metals. The bottom row shows the Palladium (PALL) and Platinum ETFs (PLTM) with breakouts, and the DB Agriculture ETF (DBA) falling back after nearing its May high.
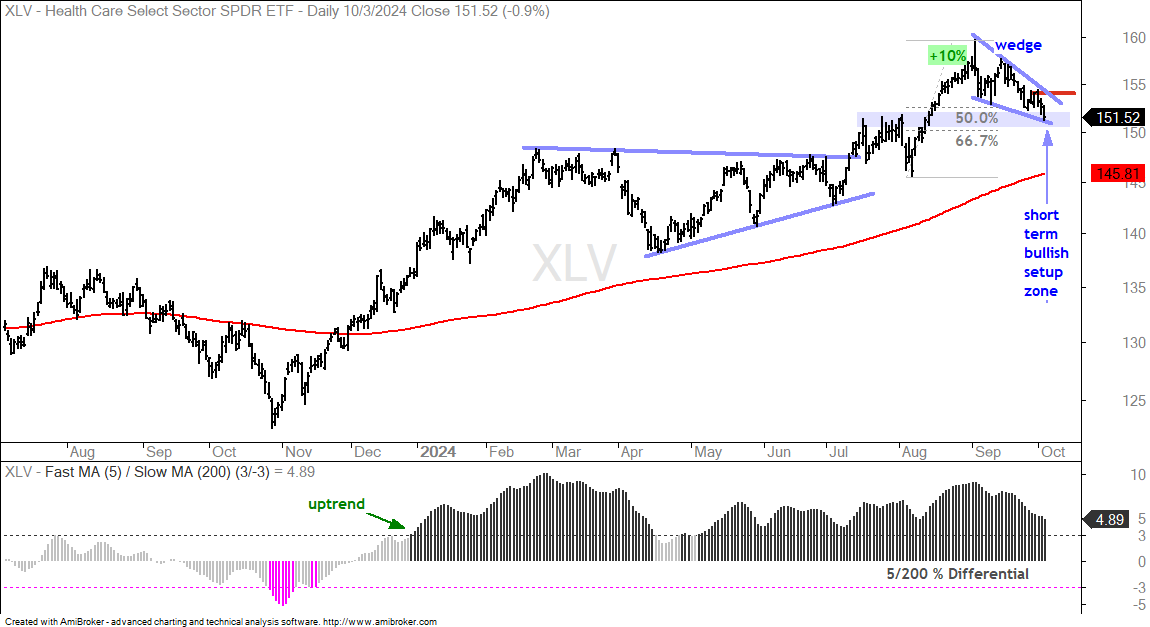
XLV Setting UP
The Healthcare SPDR (XLV) is setting up as it pulls back within a bigger uptrend. The chart below shows XLV hitting a new high in early September and trading well above the rising 200-day SMA. XLV fell back in September with a falling wedge that retraced 50-67 percent of the prior 10% advance. XLV also returned to the prior breakout zone, which turns into support. I would call this a short-term bullish setup zone. Also note that the falling wedge is a short-term bullish continuation pattern that is typical for correction after advances. The red line mark resistance at 154 and a breakout here would be bullish.
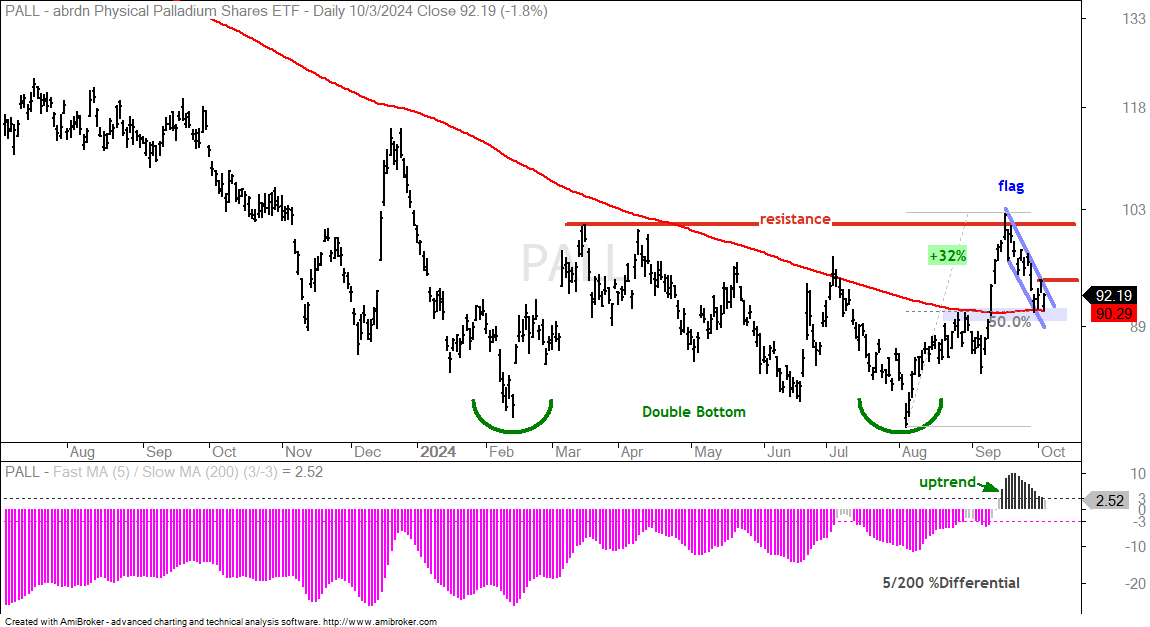
PALL with a Throwback
The next chart shows the Palladium ETF (PALL) with an extended double bottom and resistance just above 100. A breakout would confirm the pattern and project a move towards the 120 area. Short-term, PALL broke its 200-day SMA with a 32% advance from early August to late September. The size of this advance reflects the high volatility and risk in this ETF. In the indicator window, we can see the 5/200 %Differential exceeding +3% for the first time since October 2022. There are early signs of an emerging uptrend here. PALL fell back to the breakout zone and 200-day SMA with a falling flag that retraced 50% of the 32% advance. This throwback offers a second chance to partake in the breakout around 90. PALL surged 1.8% on Wednesday and then fell back on Thursday. This pop-drop establishes a short-term resistance level at 94 and a breakout here would be bullish.
Illumina Breaks Out to Extend Uptrend
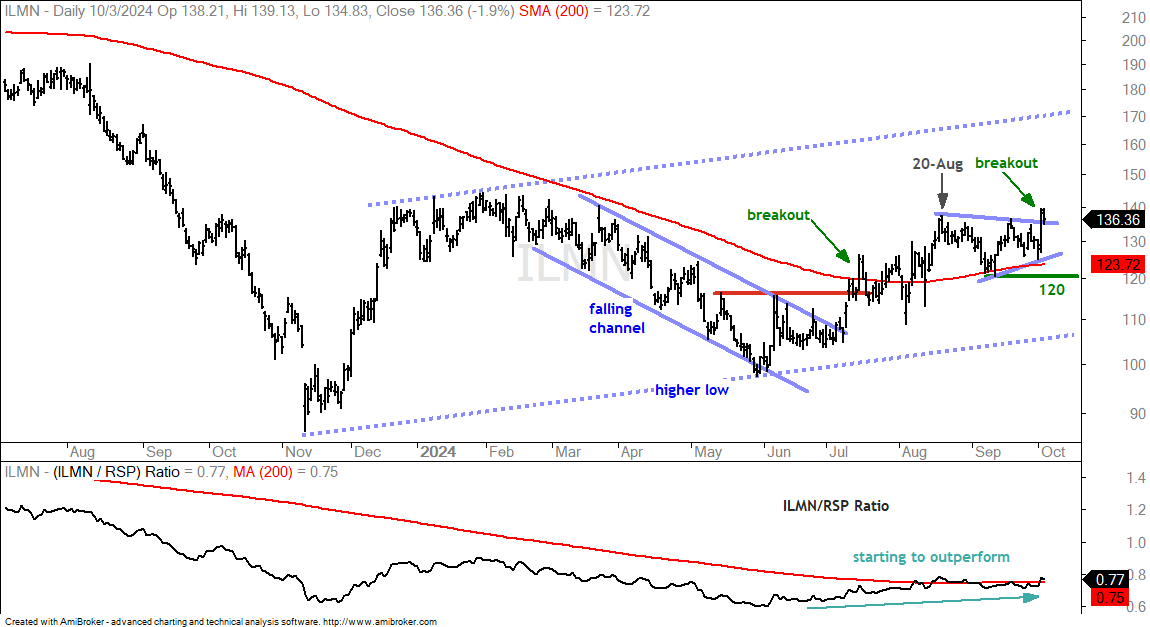
Illumina (ILMN) was featured on August 20th as it extended on its mid July breakout. The stock moved into a consolidation in September and broke out with a big move on Wednesday. Long-term, ILMN turned the corner with the falling channel breakout in July. A higher low also formed from November to May. ILMN battled its 200-day SMA into August and then successfully tested this key moving average in September. A triangle formed into early October and the stock broke the upper line with an outsized advance. The indicator window shows the price-relative moving higher since June as ILMN starts to outperform the broader market (RSP).
Incyte Breaks Out of Triangle
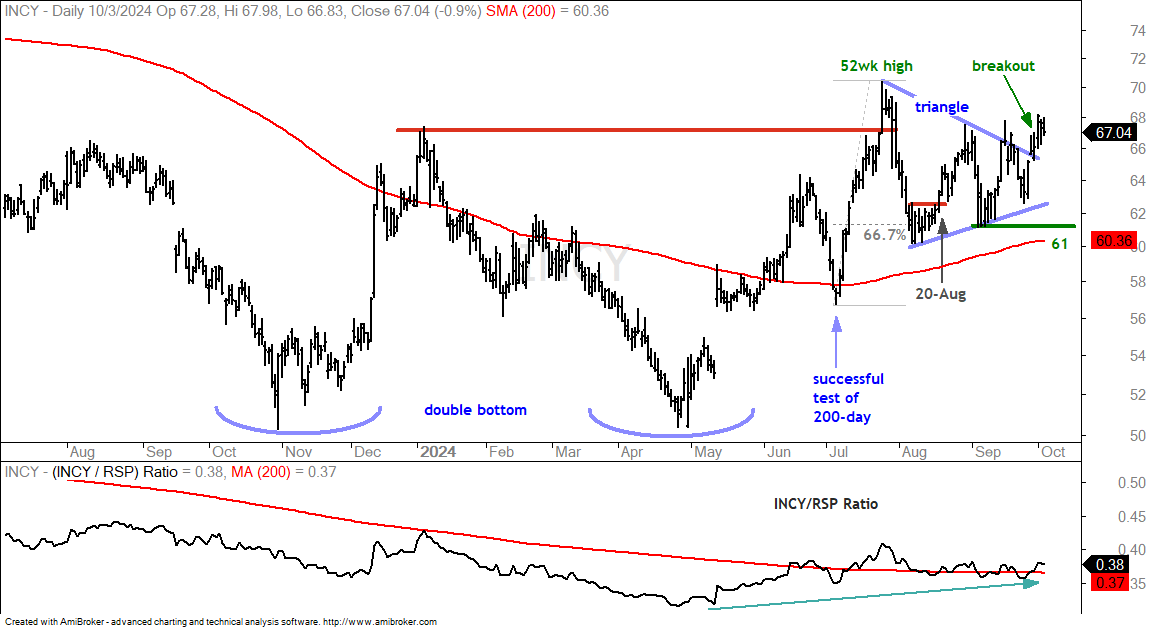
I also featured Incyte (INCY) on August 20th as it consolidated near the 66.7% retracement level and broke short-term resistance. Trading remained quite choppy into September as a triangle consolidation formed. A view this triangle as a consolidation after the 52-wk high and big advance. This makes it a bullish continuation pattern. INCY broke out with a surge above 66 this week and this signals a continuation higher. It also put the double bottom breakout back in play. I would mark support at the September low and re-evaluate on a close below 61.
A Bullish Continuation Pattern for Nvidia
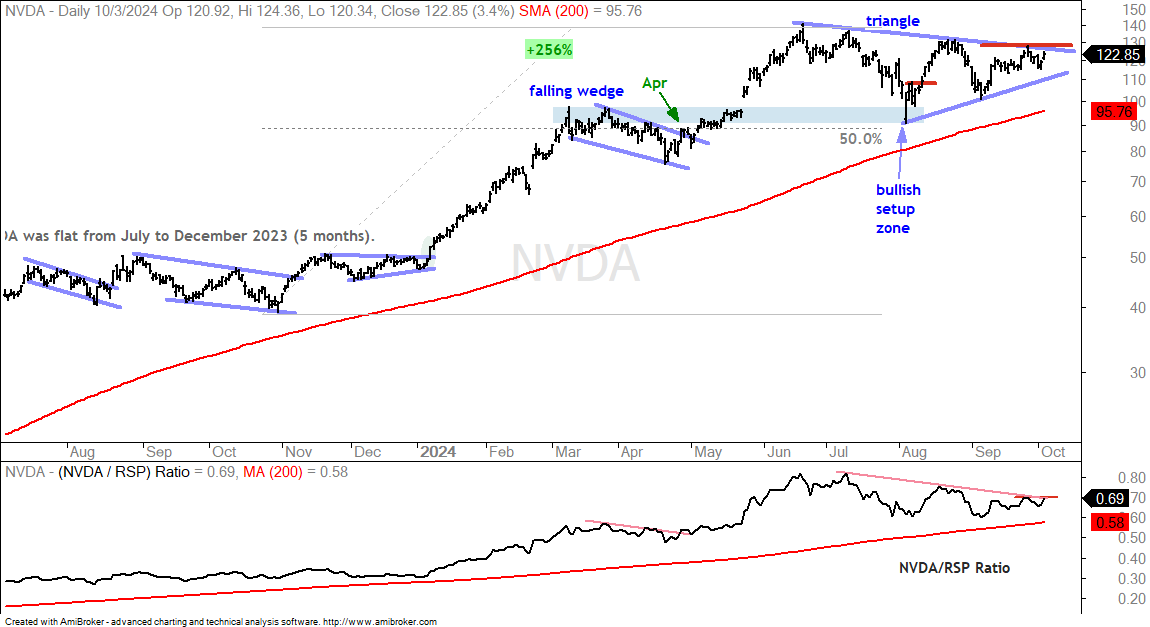
Nvidia is the king of AI right now. They are on the picks and shovels end of the equation because they supply the components needed to run AI applications. Microsoft, Alphabet, Meta and Amazon are the hyperscalers driving the capex for AI projects. We can also thrown in OpenIA and Anthropic. NVDA is currently consolidating within a long-term uptrend. The stock hit a new high in June, fell to a bullish setup zone in early August and then traded rangebound the last two months. Overall, a triangle is taking shape and this is a bullish continuation pattern. Resistance is set at 128 and a breakout here would signal a continuation of the bigger uptrend. The indicator window shows the NVDA/RSP Ratio peaking in July and falling into September. NVDA is underperforming short-term, but still outperforming long-term. Notice that the price-relative is well above its 200-day SMA.
Broadcom Leads with Break Above August High
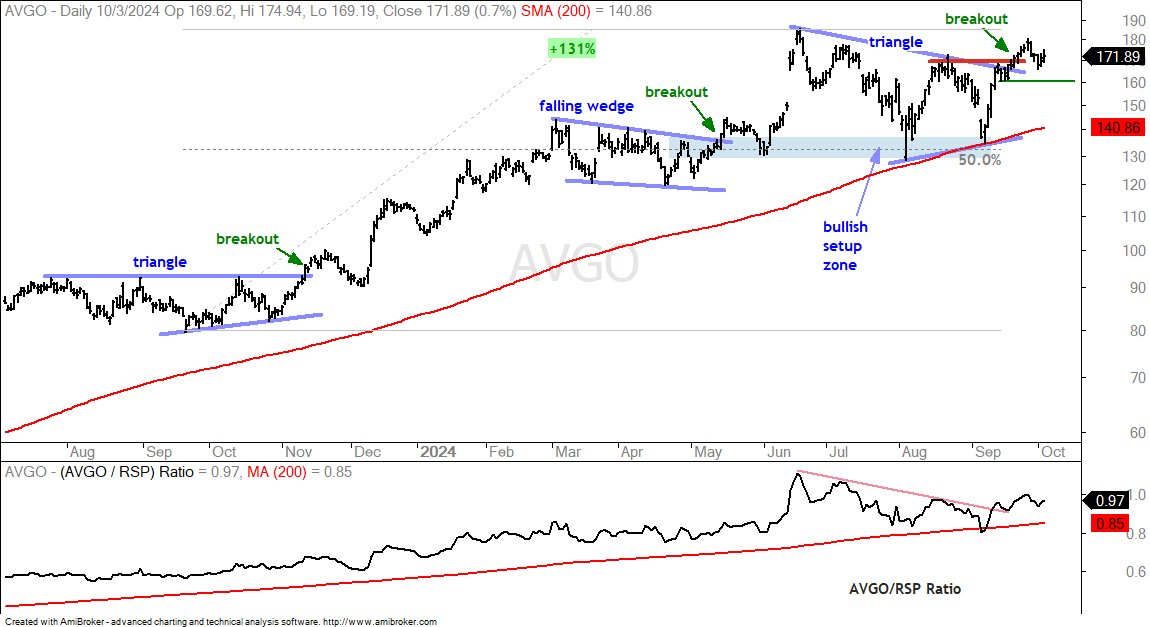
Broadcom (AVGO) is also part of the AI trade because it specializes in connecting all the parts (GPUs, CPUs, NPUs, accelerators and high-bandwidth memory). It also works with some of the hyperscalers on chip development. AVGO is leading NVDA on the price chart because it broke its August high already. Overall, the stock is in a long-term uptrend. It formed a triangle consolidation from mid June to mid September and broke out in late September. This breakout signals a continuation of the long-term uptrend. The indicator window shows the price-relative (AVGO/RSP ratio) turning up in September and breaking the June trendline. I am marking first support at 160. A break here would negate the triangle breakout.
Taiwan Semiconductor Breaks Triangle Resistance
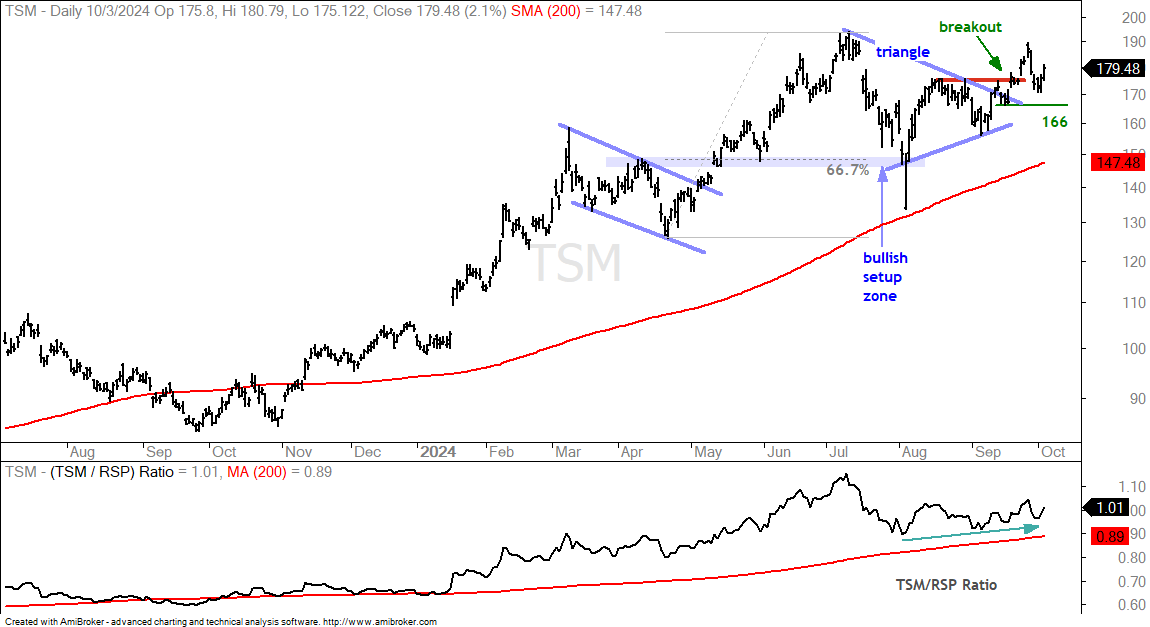
Taiwan Semiconductor (TSM) is also a big part of the AI trade because they manufacture most of the high end chips needed to power AI applications. The chart shows a similar pattern: long-term uptrend, triangle and breakout. TSM is well above the rising 200-day SMA and a clear performance leader long-term. The triangle represents a rest within the long-term uptrend and the breakout signals an end to this rest. More important, it also signals a continuation of the long-term uptrend. I am marking first support at 166 and a close below this level would negate the breakout.
Marvell Consolidates after Breakout
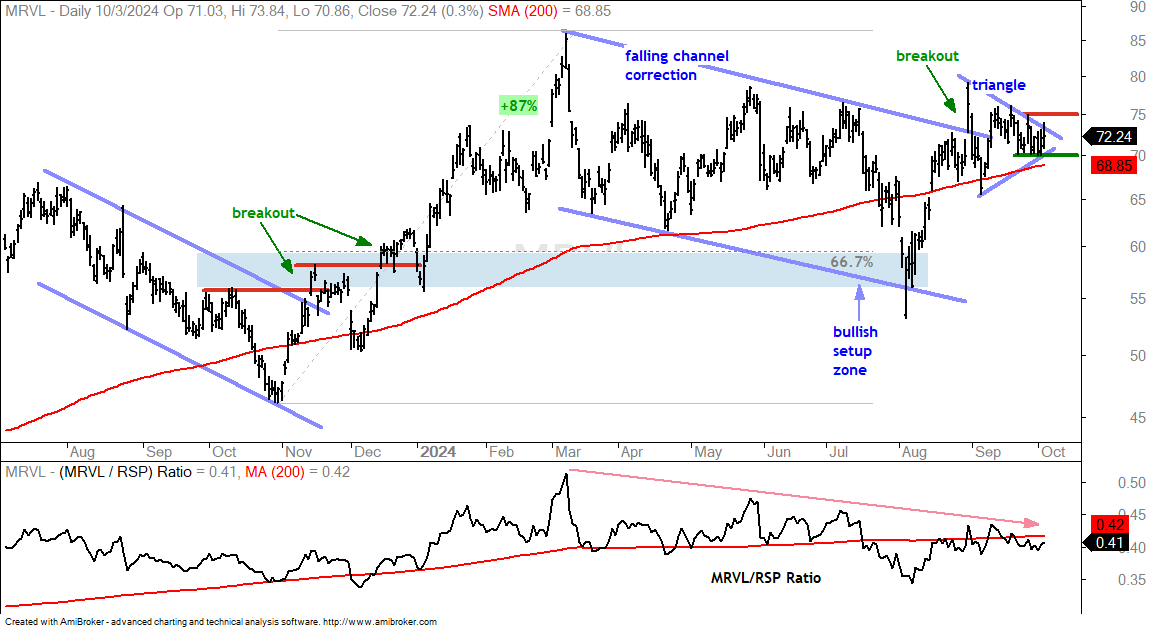
Marvell (MRVL) is an AI play because it specializes in connectivity within data centers. It customers include Nvidia, Alphabet and Amazon. On the price chart, MRVL fell from March to early August and then surged into early September. The stock formed a large falling channel that retraced around 66.7% of the 87% advance and returned to the prior breakout. The blue shading marks the bullish setup zone. Overall, I view the falling channel as a big correction and the breakout as a bullish continuation signal. MRVL stalled around the breakout with a triangle since early September. This is a short-term bullish continuation pattern and a breakout at 75 would signal a continuation higher. Such a breakout would also keep the bigger channel breakout alive and target a move to new highs.
TLT Hits Bullish Setup Zone
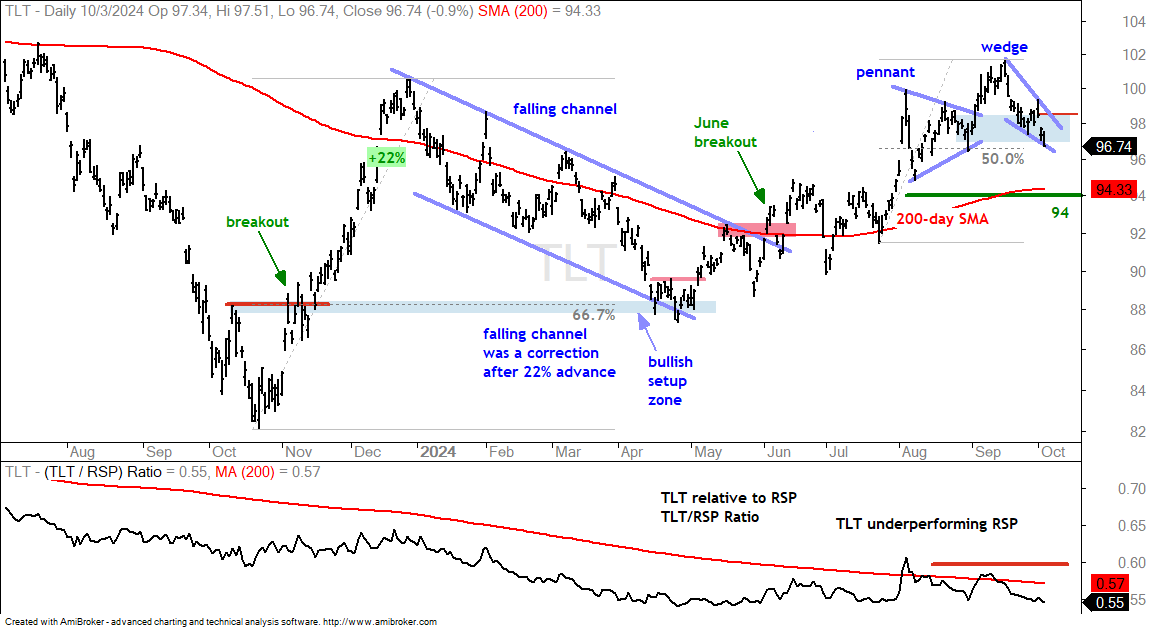
The 20+ Yr Treasury Bond ETF (TLT) is in a long-term uptrend since the breakout in June. TLT triggered a pennant breakout in early September and hit a new high in mid September. It then fell back to the pennant’s apex with a falling wedge that retraced around 50% of the July-September advance. The pennant apex acts as support and this means TLT is trading in a bullish setup zone (support and 50% retracement). I am marking short-term resistance using Wednesday’s close. A close above 98.5 would trigger a short-term breakout.
GLD Extends after Latest Breakout
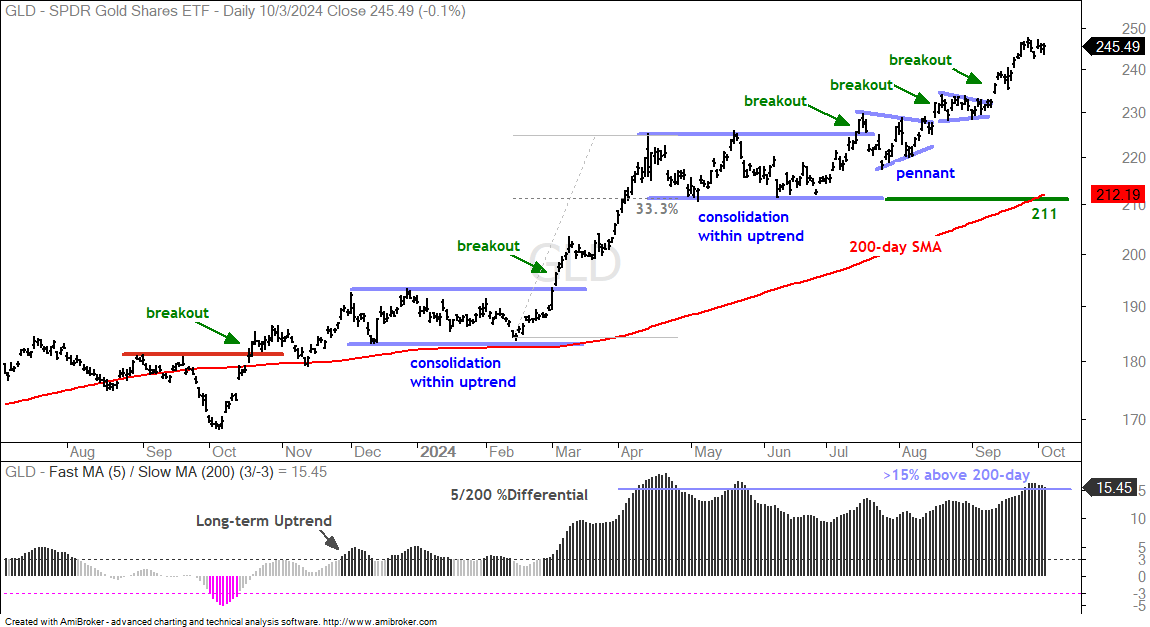
The Gold SPDR (GLD) remains in one of the strongest uptrends in the markets right now. The 5/200 %Differential has been bullish since late November and GLD is over 15% above its rising 200-day SMA (bottom window). It seems extended, but there are no signs of weakness on the price chart. Since the breakout surge in early March, it has been advance, consolidate, breakout and repeat. Most recently, GLD broke out of a small pennant in mid September and extended to new highs in late September. I will leave long-term support at 211 for now.
Bitcoin: Long-term Downtrend and Short-term Reversal
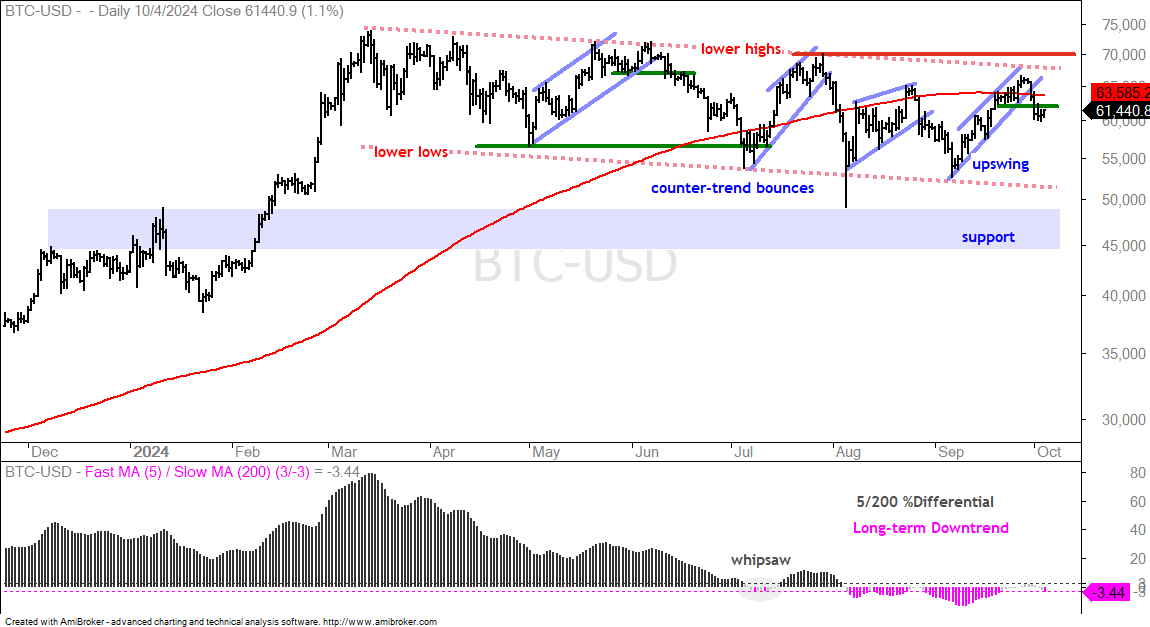
Bitcoin remains in a long-term downtrend with lower lows and lower highs since April. Overall, a falling channel defines this downtrend with resistance marked at 70,000. BTC rose with the stock market in September and exceeded its 200-day SMA for a few days. This breech did not last as the crypto fell sharply this week and broke short-term support. The swing is down and in the same direction as the long-term trend (down). This argues for a continuation of the long-term downtrend and a target in the low 50,000 area.