Systematic Strategies and Next Level Technical Analysis
Chart Trader Weekly Report – Broad Market Analysis, Leading Groups (ETFs), Chart Setups and Trading Ideas (Premium)
Arthur Hill, CMT
Archive
Charts
Use CRTL+P to Print
Report Headlines
Composite Breadth Model is Bullish
BAA-AAA Spread Remains Bullish for Stocks
BBB Spread Remains at Low End of 2024 Range
SPY Edges to New High
QQQ and MAGS Break August Highs
XLK and SOXX Stall at August Highs
Software, Cyber, Fintech and Cloud ETFs Hit New Highs
Mid-caps and Small-caps Go for Breakouts
Industrial Metals ETFs Surge along with China
DB Agriculture ETF Extends on Breakout
GLD Extends after Latest Breakout
TLT Hits Short-term Bullish Setup Zone
Bitcoin: Long-term Downtrend with Counter-Trend Bounces
The next Weekly Report will be posted on Friday, October 4th.
Overview
The weight of the evidence remains bullish for stocks. The Composite Breadth Model is at +5 with 72% of S&P 1500 stocks above their 200-day SMAs. Yield spreads show confidence in the credit markets as the BBB spread fell back after the August pop. The major index ETFs are in long-term uptrends.
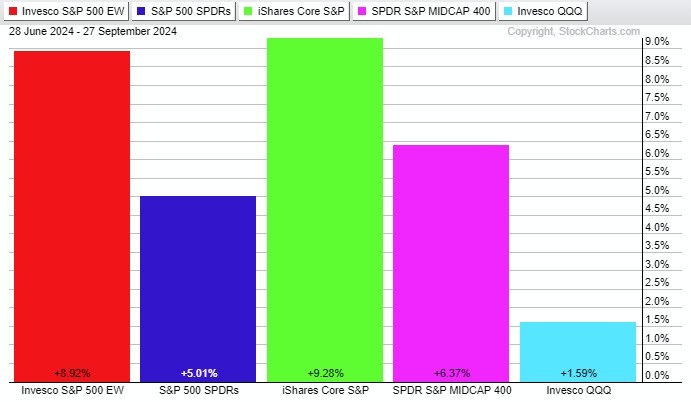
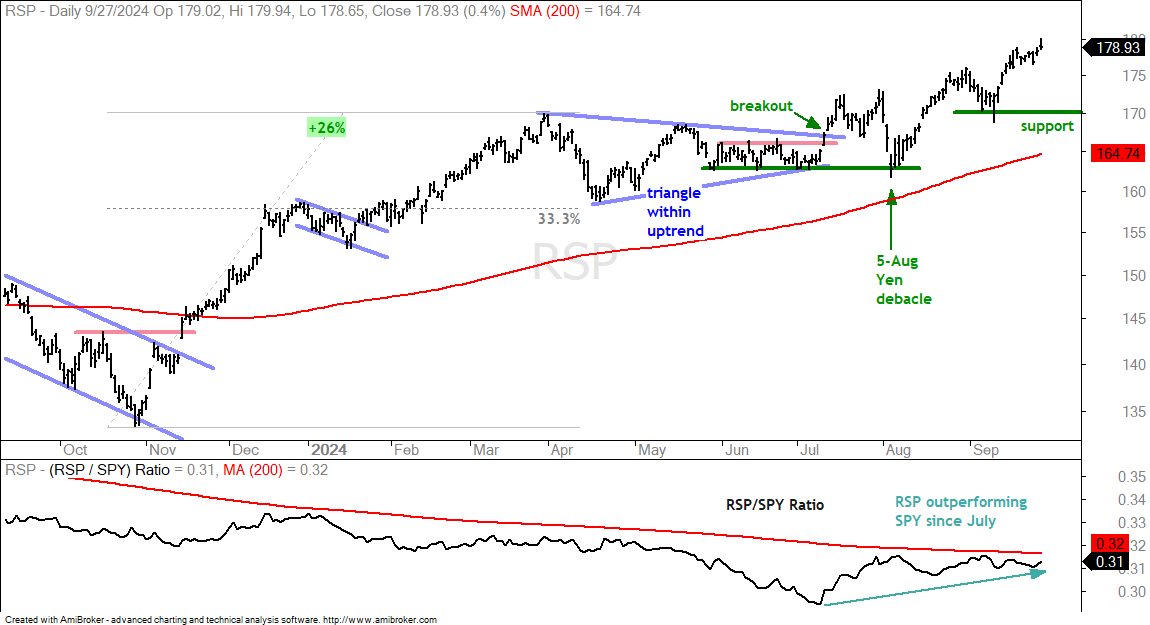
The S&P 500 EW ETF (RSP) is performing much better than the S&P 500 SPDR (SPY) since July (three months). RSP is up 9% since July, and SPY is up 5%. This shows a preference for smaller stocks. The chart below shows the S&P SmallCap 600 SPDR (IJR) up 9.3% since July and leading the major index ETFs. The S&P MidCap 400 SPDR (MDY) is also up more than 6%. We will look at bullish patterns in MDY and IJR today.
Commodities stole the show last week as China made the “whatever it takes” announcement. This triggered big gains in Chinese stocks and industrial metals. The Materials SPDR (XLB) surged to a new high with a 3% gain last week and an 8% gain the last three weeks. We will update the charts for copper and base metals in this report.
ICYMI
On Friday, September 27th, I published a report/video covering breadth indicators, setups and signals This report provides a systematic approach for capitulation setups, breadth thrusts, oversold conditions and market regimes.
On Friday, September 20th, I published a report/video covering bullish setup zones last Friday. This report provides a systematic approach to identify and trade pullbacks within a bigger uptrend (stocks and ETFs).
Composite Breadth Model is Bullish
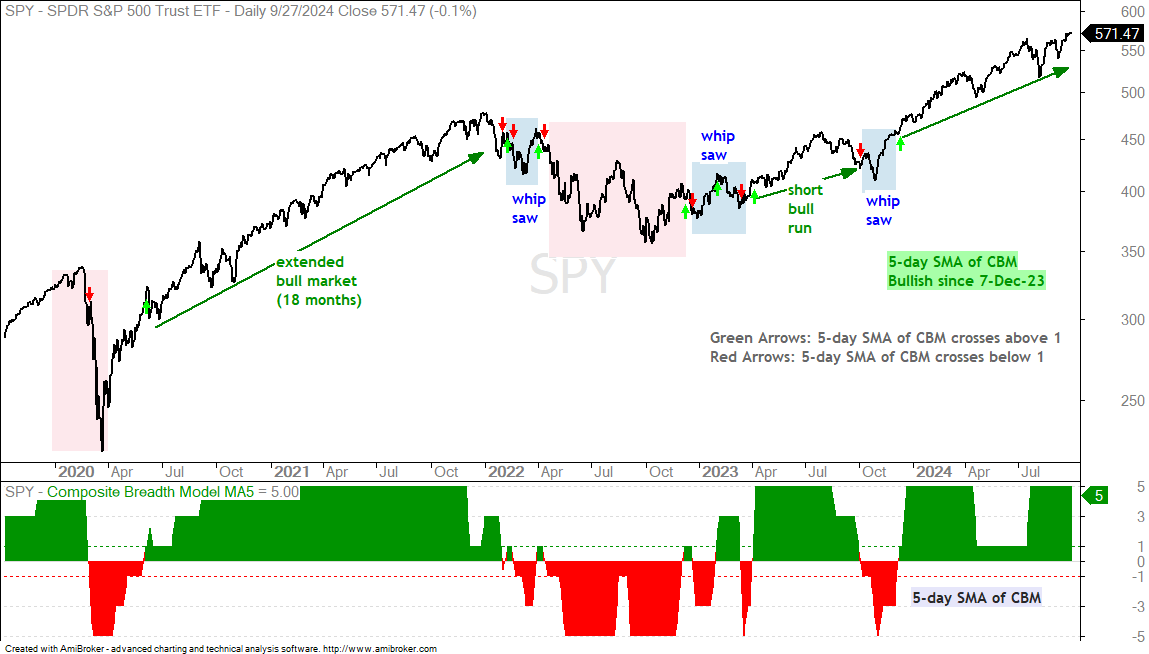
The chart below shows SPY with the 5-day SMA of the Composite Breadth Model at +5. This model turned bullish on December 7th and remains bullish. A positive CBM signals a favorable environment for stocks (bull market). Even within a bull market, we can still see pullbacks, corrections, volatility, rotations and trading ranges.
The Composite Breadth Model aggregates signals in over a dozen breadth indicators from the S&P 500 and S&P 1500. This means it covers large-caps, mid-caps, small-caps, NYSE stocks and Nasdaq stocks. It ranges from +5 to -5. A bull market is present when the 5-day SMA of the CBM is at +1 or higher. A bear market is present when below +1.
BAA-AAA Spread Remains Bullish for Stocks
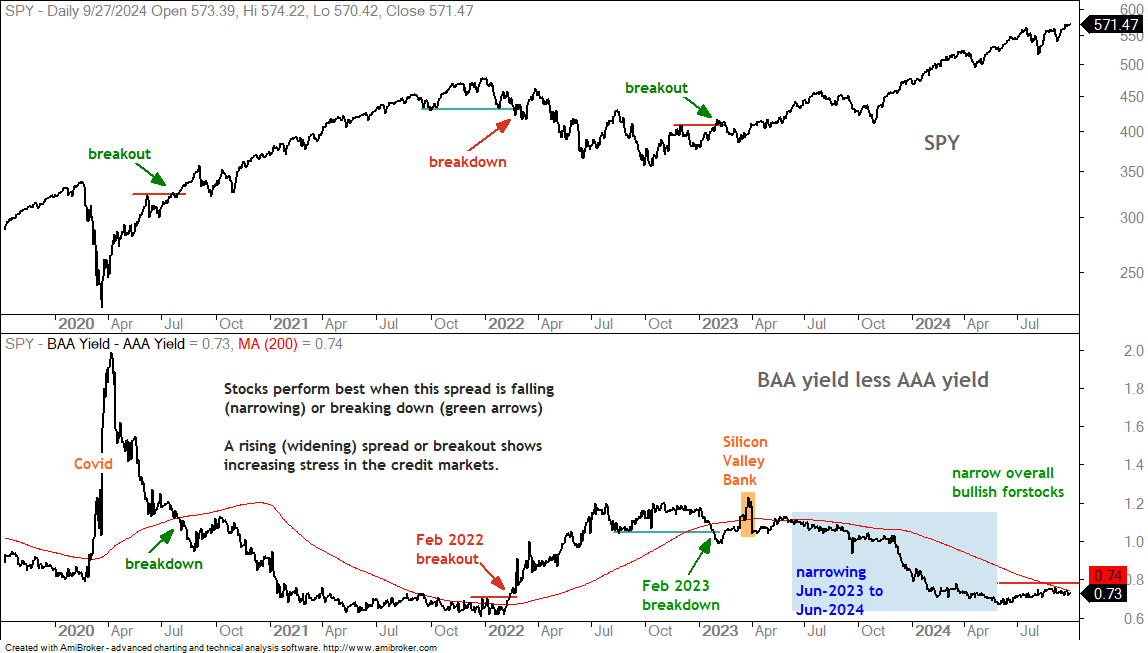
The next chart shows the BAA-AAA yield spread narrowing from June 2023 to June 2024 and then flat-lining at a relatively low level (blue shading). It remains below the red line (.78), which means the spread between the BAA and AAA yields is narrow and showing no signs of stress in the credit markets (bullish for stocks). A break above .78 would put this spread at its widest level since January and signal increasing stress in the corporate bond market.
According to Moody’s, AAA bonds are the highest grade corporate bonds with the lowest level of default risk. BAA bonds have moderate credit risk and “certain speculative characteristics”. The spread between these two narrows (falls) when credit conditions are favorable (no stress). The spread widens (rises) when conditions are deteriorating (increasing stress).
BBB Spread Remains at Low End of 2024 Range
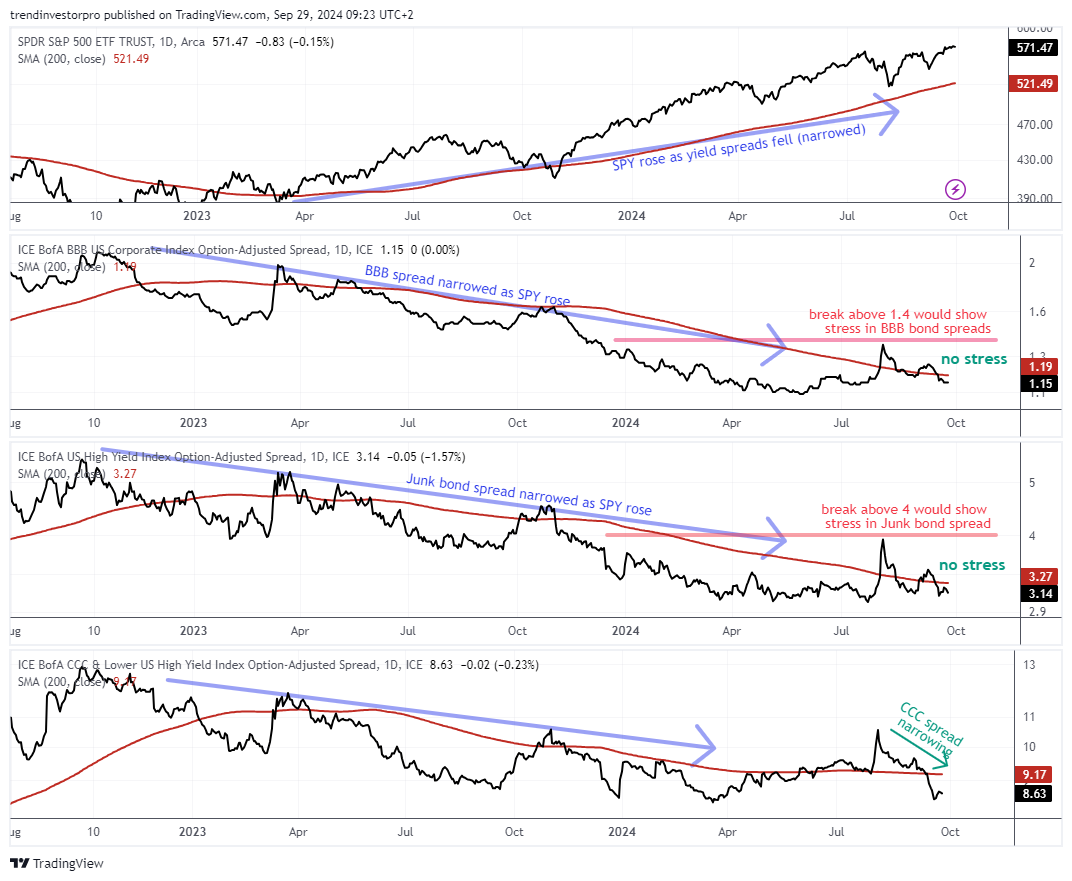
The next chart shows SPY, the BBB spread, the Junk bond spread and the CCC bond spread with their 200-day SMAs. The BBB and Junk bond spreads widened sharply with a pop in early August, but quickly fell back and drifted lower the last few weeks. They are at narrow levels overall and showing confidence in the credit markets. Breakouts at 1.4 in the BBB spread and 4 in the Junk spread would be bearish for stocks.
These spreads show the difference between a corporate bond yield (BBB) and the equivalent US Treasury bond yield. BBB bonds are the lowest rated investment grade bonds. US Treasuries are the ultimate safe-haven bonds. The spread between these two widens (rises) when stress builds in the corporate bond market. This is negative for stocks. The spread narrows (falls) when stress levels are low or subsiding. This is positive for stocks.
SPY Edges to New High
The S&P 500 SPDR (SPY) remains in a long-term uptrend. SPY tagged a new high this past week and remains well above the rising 200-day SMA. A cup-with-handle pattern formed from mid July to mid September and the ETF broke out with a surge on September 19th. With the breakout and new high, the low of the handle becomes first support to watch going forward. The trend is up as long as 540 holds.
Even though SPY is in a clear uptrend, it is underperforming RSP. This means the S&P 500 EW ETF (RSP) is in a stronger uptrend. The indicator window on the chart above shows the SPY/RSP ratio peaking in early July and falling the last few months. Large-caps are lagging the average stock in the S&P 500. The chart below shows RSP with a breakout in mid July, a hard throwback on August 5th and then a move to new highs.
QQQ and MAGS Break August Highs
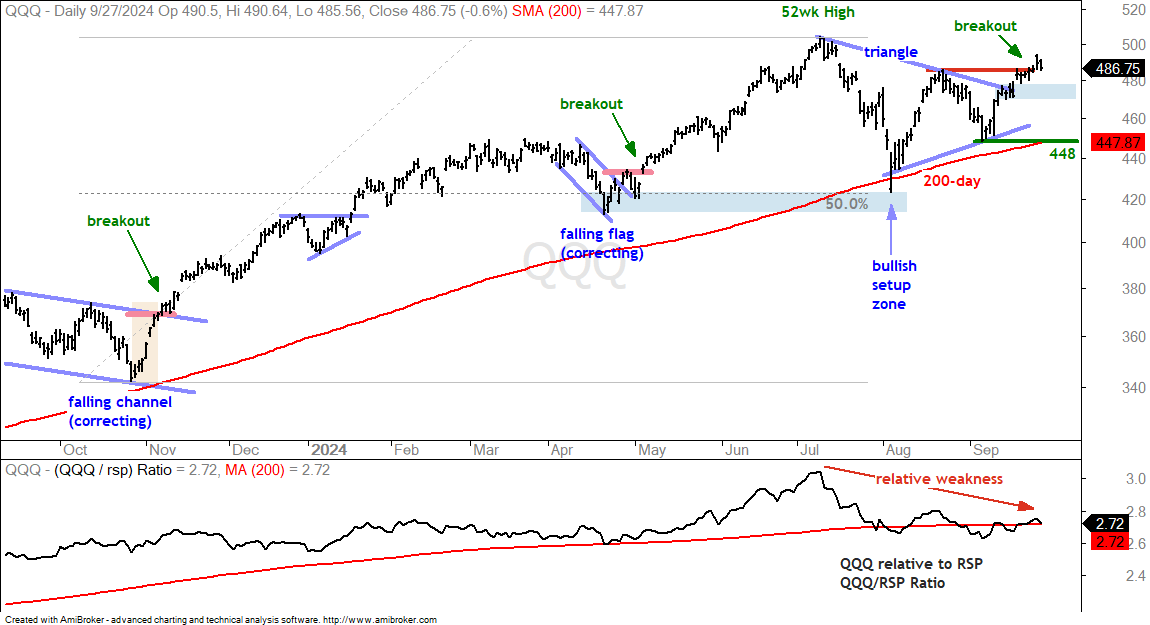
QQQ is underperforming SPY and RSP, but the large-cap dominated ETF is still in an uptrend with a triangle breakout working. QQQ hit a new high in July and then consolidated with a triangle the last few months. A consolidation within an uptrend is typically a bullish continuation pattern that represents a rest within the uptrend. QQQ broke the upper line of the triangle on September 19th and exceeded the August high last week. This signals an end to the consolidation and a resumption of the bigger uptrend. The blue shading marks a short-term support level to watch should we see a throwback (470-480). The September low marks key support at 448.
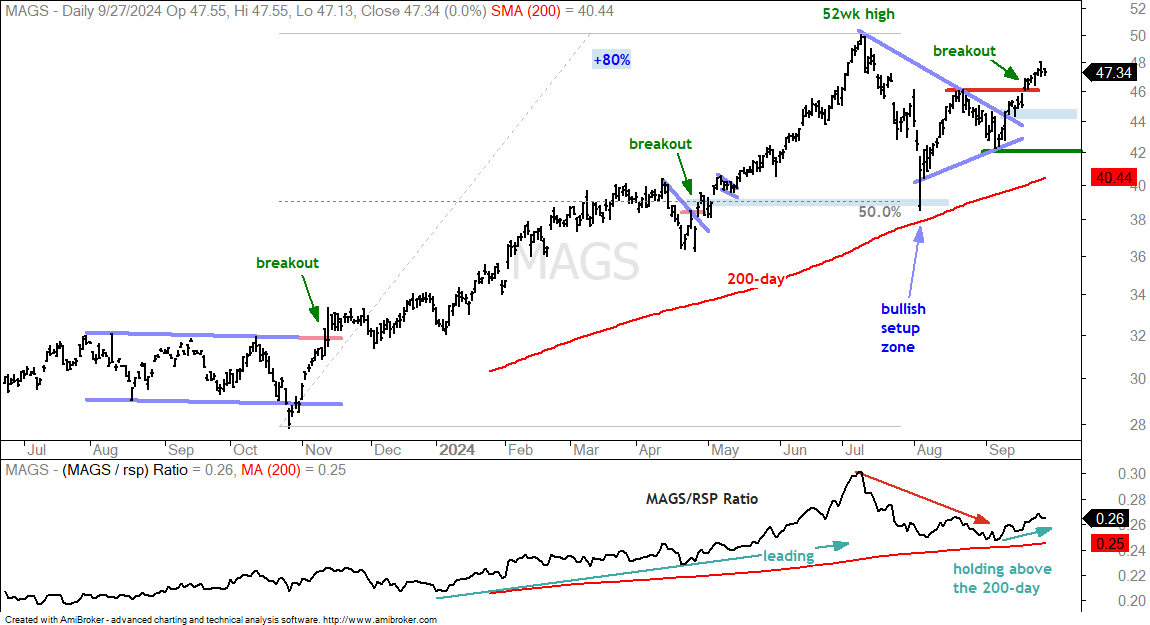
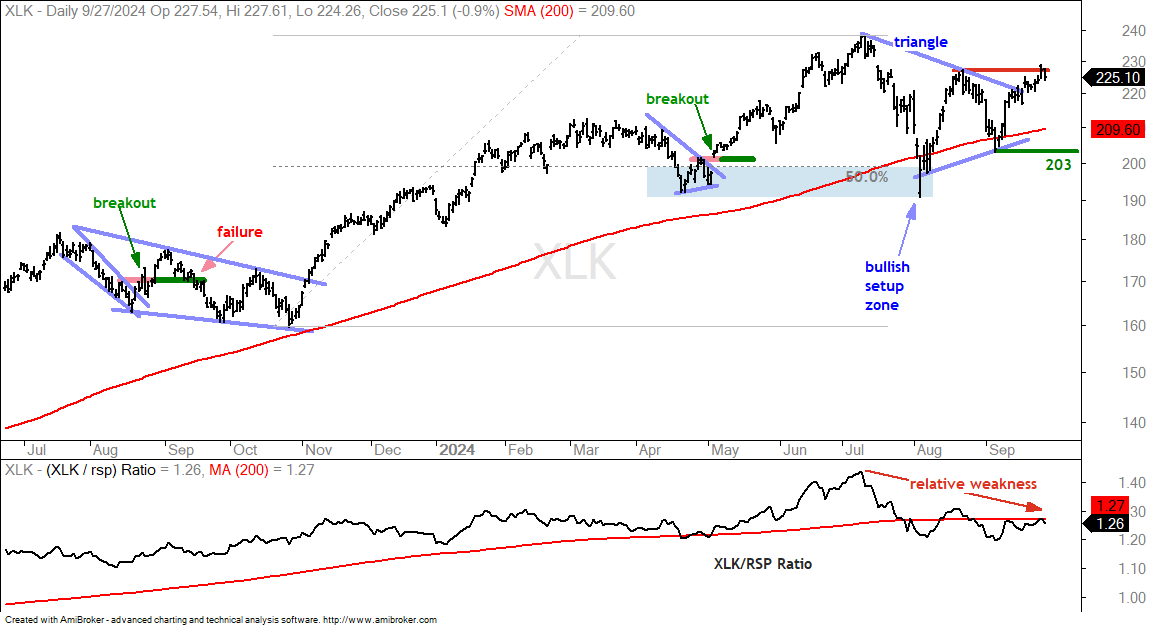
The chart below shows QQQ triangulating within a long-term uptrend. There is really no change since last week because QQQ remains within this triangle. Ditto for the Technology SPDR (XLK) and Mag7 ETF (MAGS). The August highs mark resistance and the September lows mark support. Traders should watch these levels for the next directional bias.
The next chart shows the Mag7 ETF (MAGS) with a triangle and breakout as well. The blue shading marks the first area to watch for support should we see a throwback (post-breakout pullback). As with many ETFs and stocks, I am using the September lows to mark key support (42 for MAGS).
XLK and SOXX Stall at August Highs
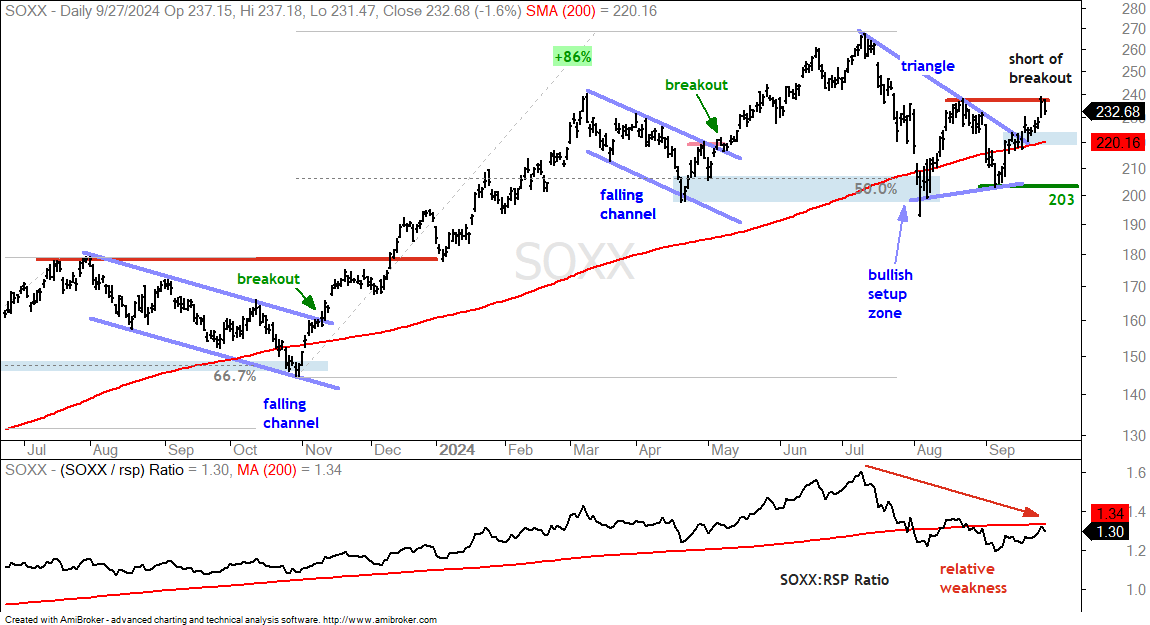
Despite breakouts in QQQ and MAGS, the Technology SPDR (XLK) and Semiconductor ETF (SOXX) are stalling near their August highs. These two are lagging a bit.
Software, Cyber, Fintech and Cloud ETFs Hit New Highs
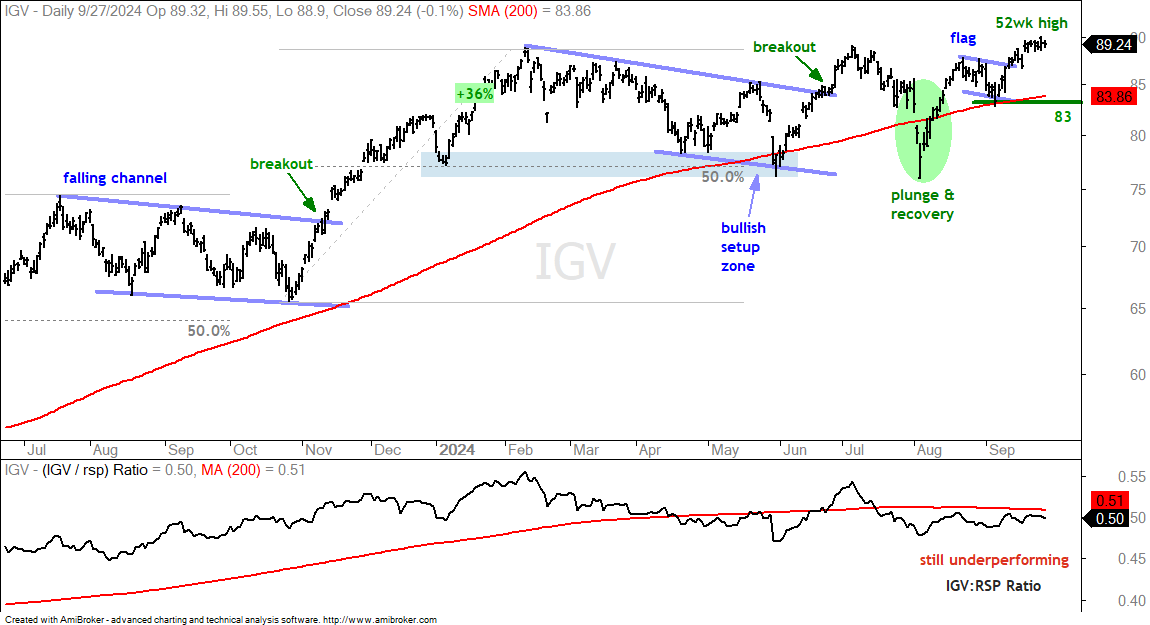
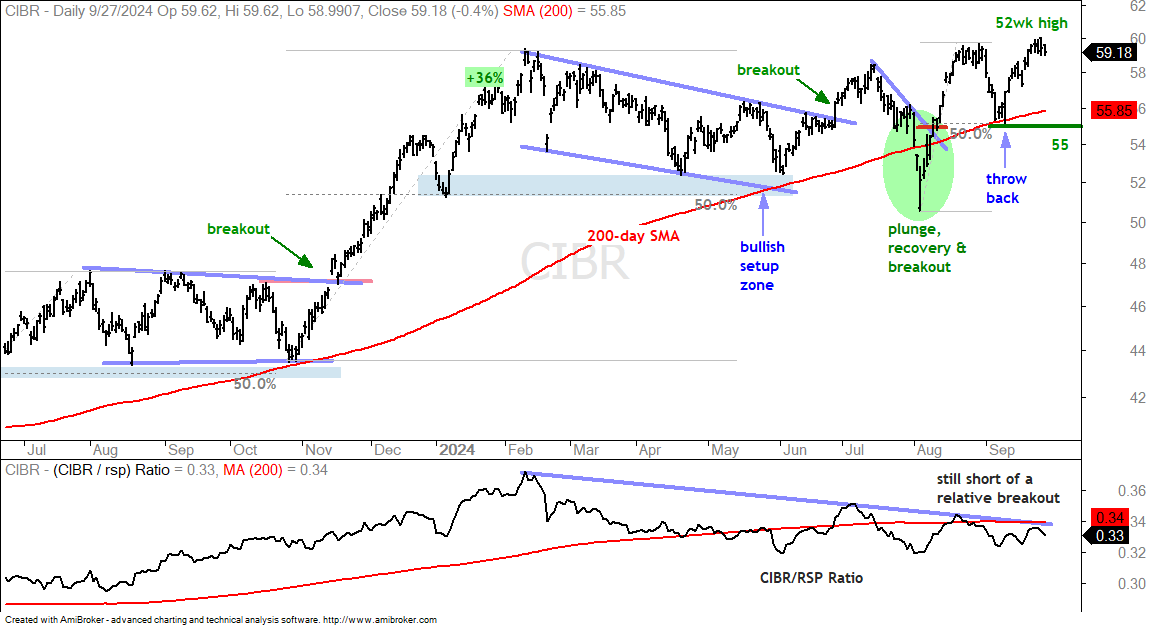
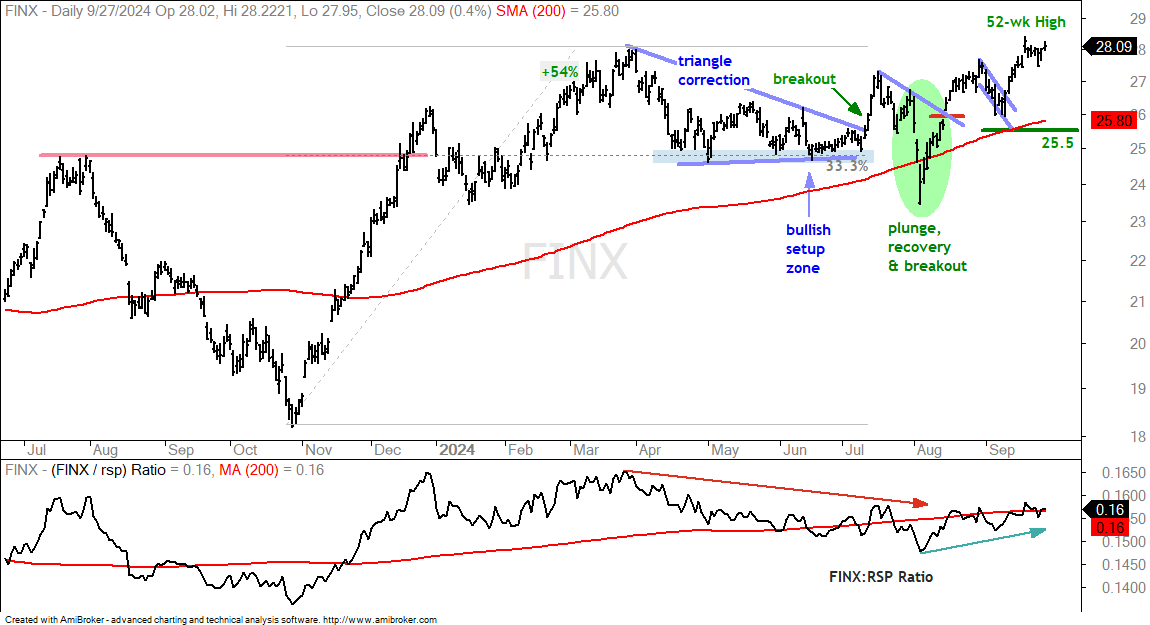
The Software ETF (IGV), Cybersecurity ETF (CIBR), FinTech ETF (FINX) and Cloud Computing ETF (SKYY) charts show similar characteristics. Price movements were quite erratic from June to September, but all four are in uptrends and they recorded new highs in late September. They are above their rising 200-day SMAs and I am using the September lows to mark key support. Despite uptrends and new highs, all four show relative weakness since July as they underperform the S&P 500 EW ETF (RSP). This is perhaps more a function of relative strength RSP. In other words, these four are lagging because RSP is stronger, not because they are weak.
The first chart shows IGV with a breakout in June, a plunge-recovery in August and new highs in September. Key support is set at 83.
The next chart shows the Cybersecurity ETF (CIBR) with a breakout in early July, a plunge below the 200-day SMA in early August and a recovery to new highs. Price action is erratic, but the trend is up with support marked at 55.
The next chart shows the FinTech ETF (FINX) with a surge to new highs in mid September. The indicator window shows the price-relative (FINX/RSP ratio) rising since early August as FINX shows some relative strength.
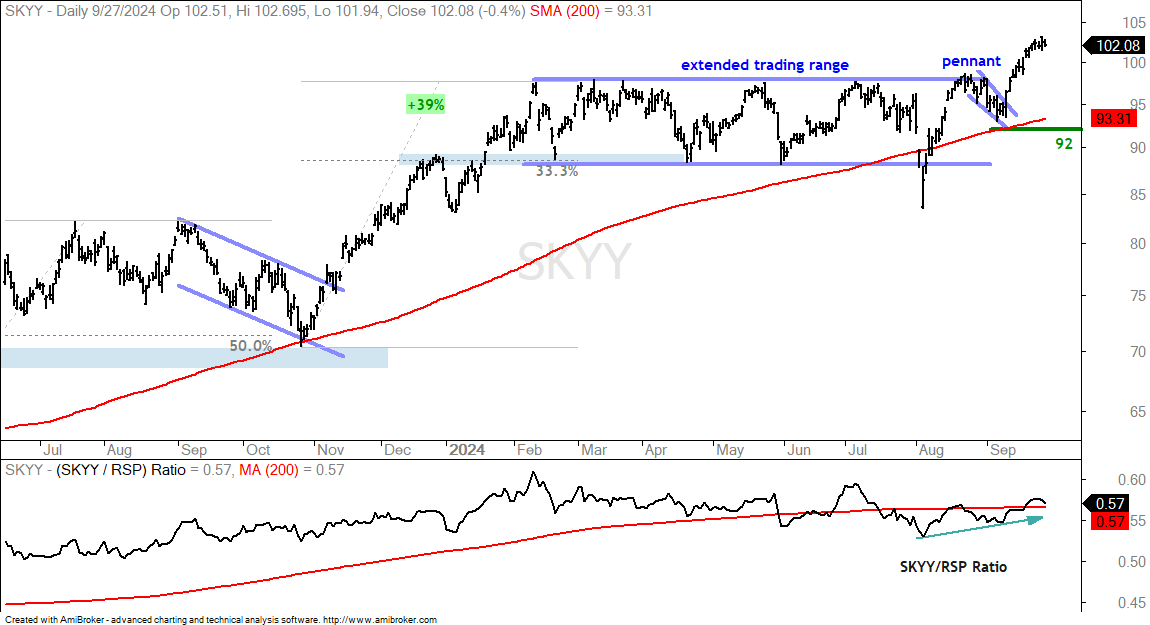
The next chart shows the Cloud Computing ETF (SKYY) with an extended trading range, a pennant into early September and a breakout to new highs the last two weeks. The indicator window shows the price-relative (SKYY/RSP ratio) edging higher since early August as SKYY shows some relative strength.
Mid-caps and Small-caps Go for Breakouts
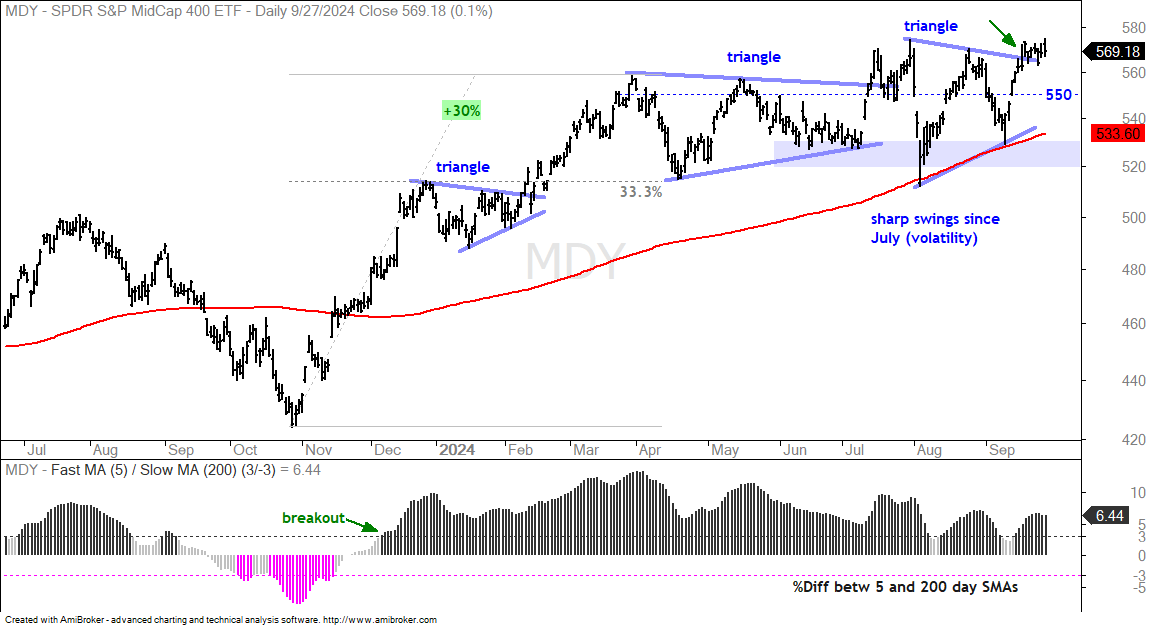
The Fed is dovish and rates are expected to fall. This, in theory, should be beneficial to small-caps and mid-caps. Theory is one thing, but reality is sometimes different. This is why I trade the charts, not the headlines. The chart below shows MDY with a 30% advance from late October to early April. MDY exceeded 550 in early April and then crossed this level at least ten times over the last five months. Yep, trading has been extremely choppy since spring. More recently, a volatile triangle formed since August. Notice the sharpness of the swings above/below 550. The long-term trend is up because MDY is above the rising 200-day SMA and the 5/200 %Differential is bullish. This means I view the triangle as a consolidation within an uptrend, which makes it a bullish continuation pattern. MDY broke the upper line of the triangle (green arrow), but stalled near the August highs this past week. Even though a breakout is in the making, volatility over the last two months remains a concern. This means it may be prudent to wait for a pullback or short-term oversold condition for a better entry.
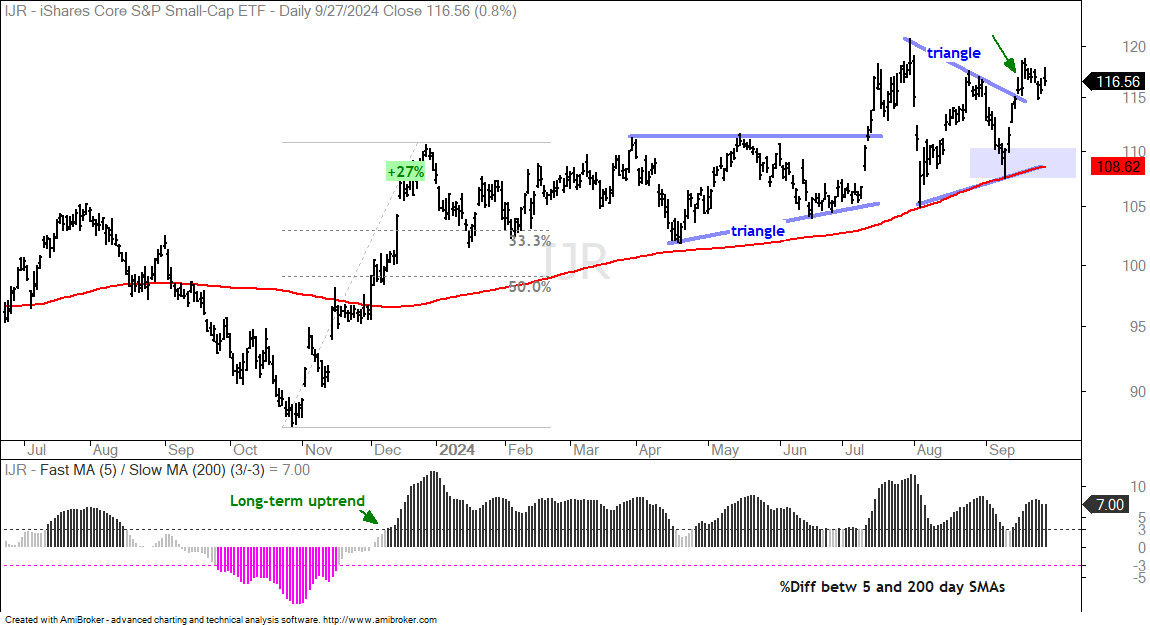
The next chart shows the S&P SmallCap 600 SPDR (IJR) with similar characteristics.
Industrial Metals ETFs Surge along with China
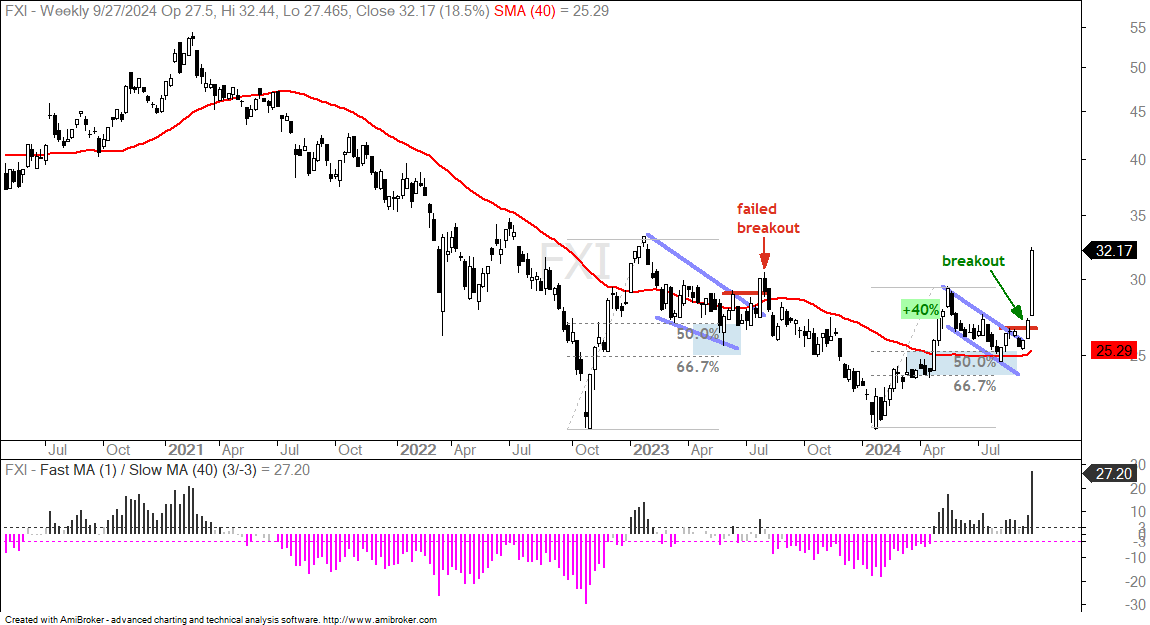
China was the big story last week as the China Large-Cap ETF (FXI) surged 18.5% on news of a big government intervention. As the Wall Street Journal puts it: China went for a triple boost last week: cuts to interest rates and other easing, loans to investors and to companies to buy back their stock, and a promise of something “fiscal” in yet-to-be-defined size”. Markets immediately price in news, even if the actual effects will not be felt for several months (if at all).
Analysts are comparing this to Mario Draghi’s “whatever it takes” moment to preserve the Euro in July 2012. History will ultimately be the judge for China’s “whatever it takes” moment. Keep in mind that governments and central banks get what they want more often than not. Also keep in mind that the largest central bank in the world (US) is dovish.
The chart below shows weekly candlesticks for the China Large-Cap ETF (FXI) with a 40% advance in the first half of 2025, a correction into July and a breakout in mid September. There was a bullish setup zone around 25 as the 40-week SMA and 50-67% retracement zone crossed paths. FXI also formed a falling channel, which is typical for corrective patterns. The ETF followed through on the mid September breakout with an 18.5% surge last week.
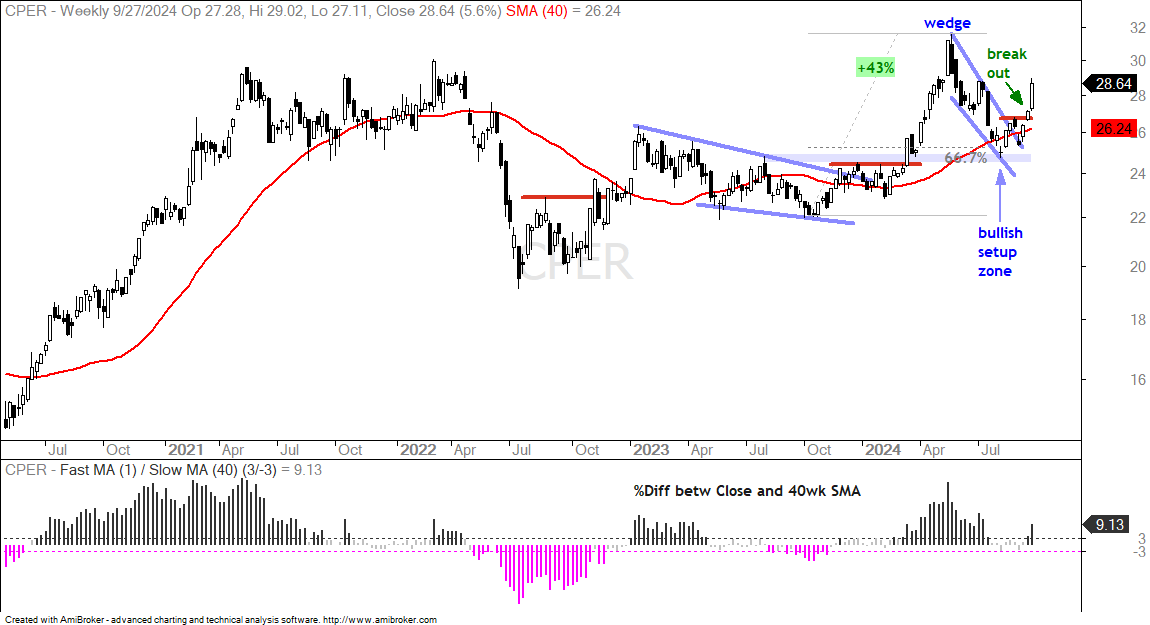
The next chart shows weekly candlesticks for the Copper ETF (CPER), which was featured along with other commodity ETFs in the report on September 19th. CPER advanced 43% into May 2024, retraced 67% of this advance with a return to the breakout zone and broke wedge resistance in mid September. Notice that the ETF hit a bullish setup zone in August and broke out along with China in mid September. This breakout signals an end to the correction and a resumption of the bigger uptrend. A move to new highs (>32) is expected.
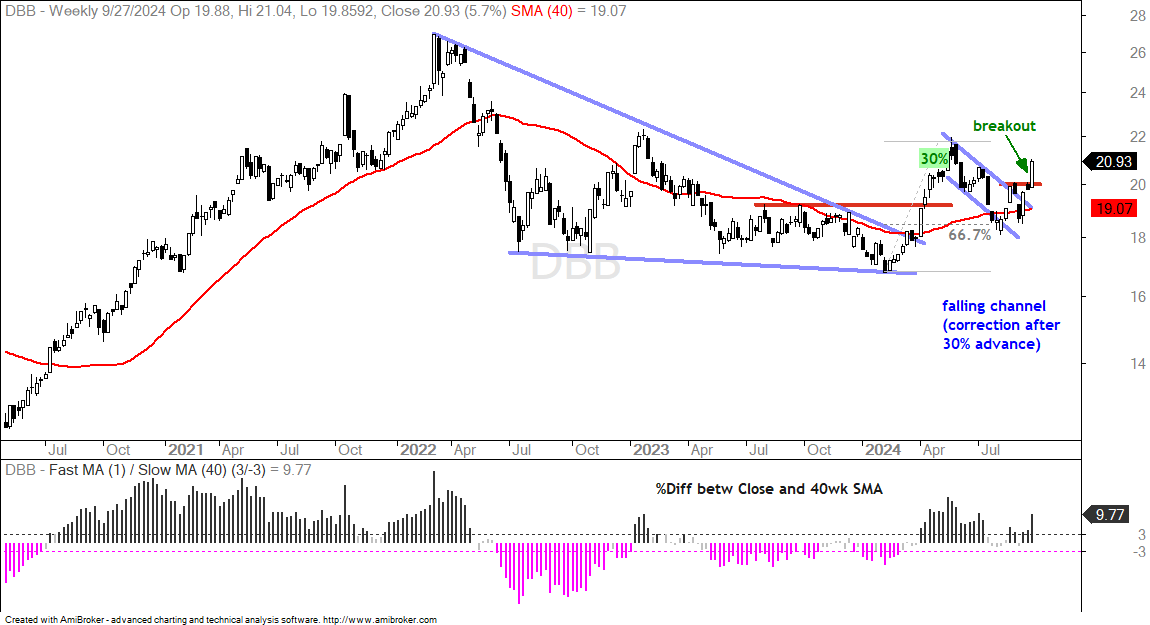
The next chart shows the DB Base Metals ETF (DBB) with a 30% advance into May 2024, a falling channel correction and a breakout. DBB is equal parts copper, zinc and aluminum.
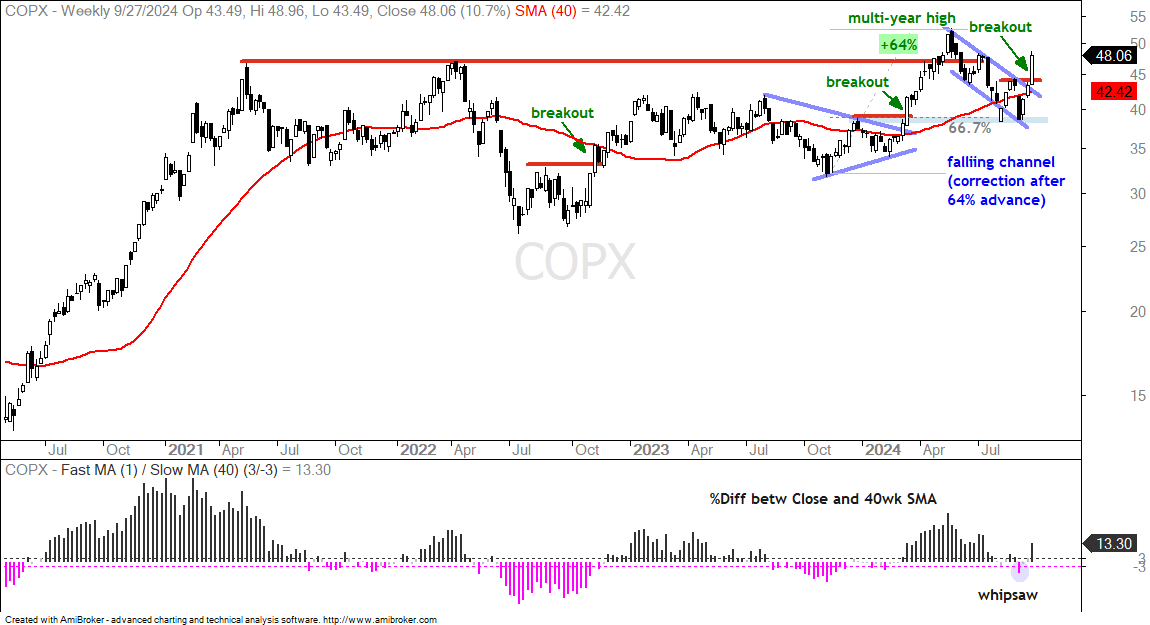
The next chart shows the Copper Miners ETF (COPX) with a 64% advance into May 2024 and a multi-year high. COPX then corrected into August with a 67% retracement and falling channel. The ETF broke out with a big move last week. This signals an end to the correction and a resumption of the bigger uptrend.
DB Agriculture ETF Extends on Breakout
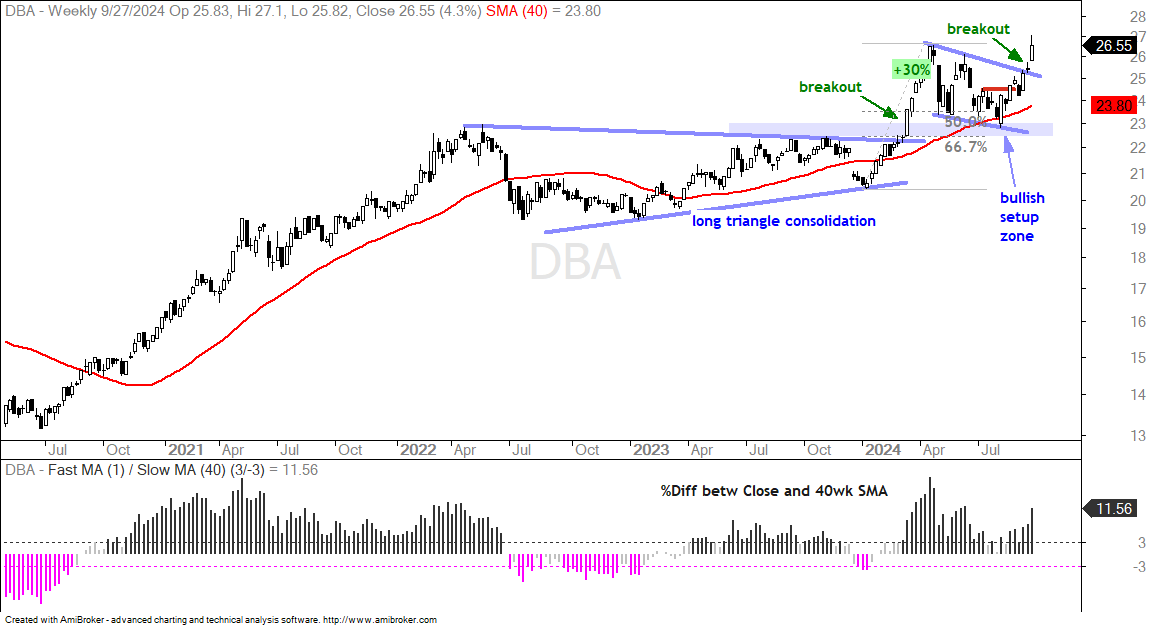
The next chart shows the DB Agriculture ETF (DBA) with a 30% advance into April 2025 and a return to the breakout zone in August. The blue shading shows the bullish setup zone marked by broken resistance, the 40-week SMA and the 50-67% retracements. DBA broke out of a falling channel in mid September and extended higher last week.
GLD Extends after Latest Breakout
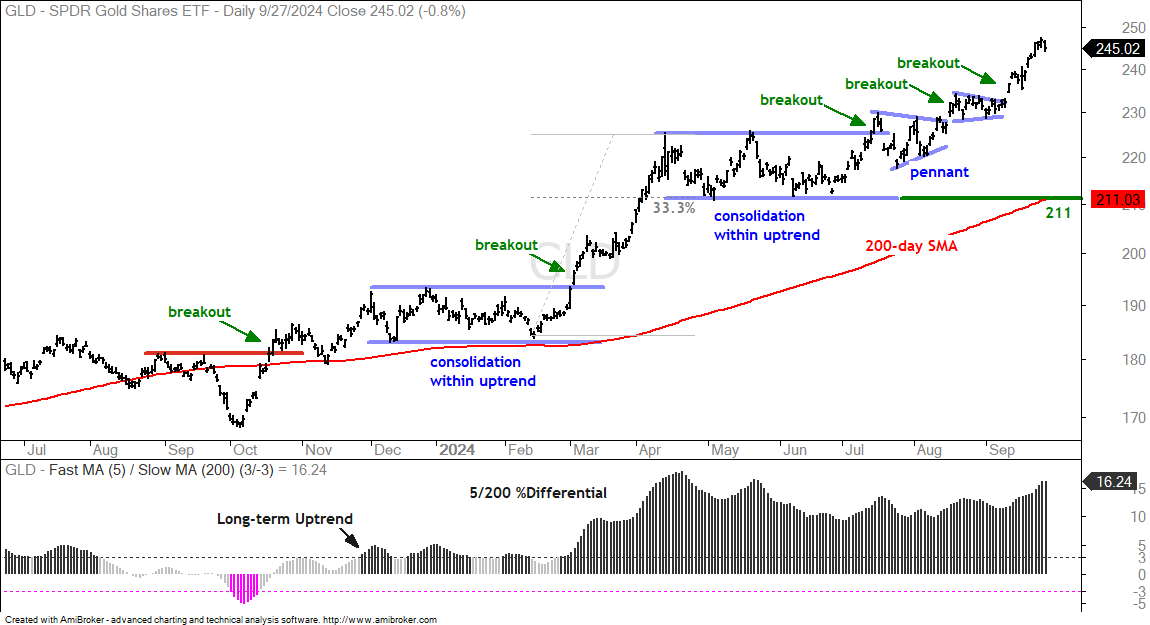
The Gold SPDR (GLD) remains in one of the strongest uptrends. Note that the percentage moves in gold are not as big as those in copper, but the gold chart sports a consistent uptrend since the October 2023 breakout. There was a long consolidation from mid April to mid July and then a breakout in late July. Since this breakout, GLD consolidated twice and broke out twice. It hit new highs again this week to confirm the leading uptrend. Long-term support is set at 211.
TLT Hits Short-term Bullish Setup Zone
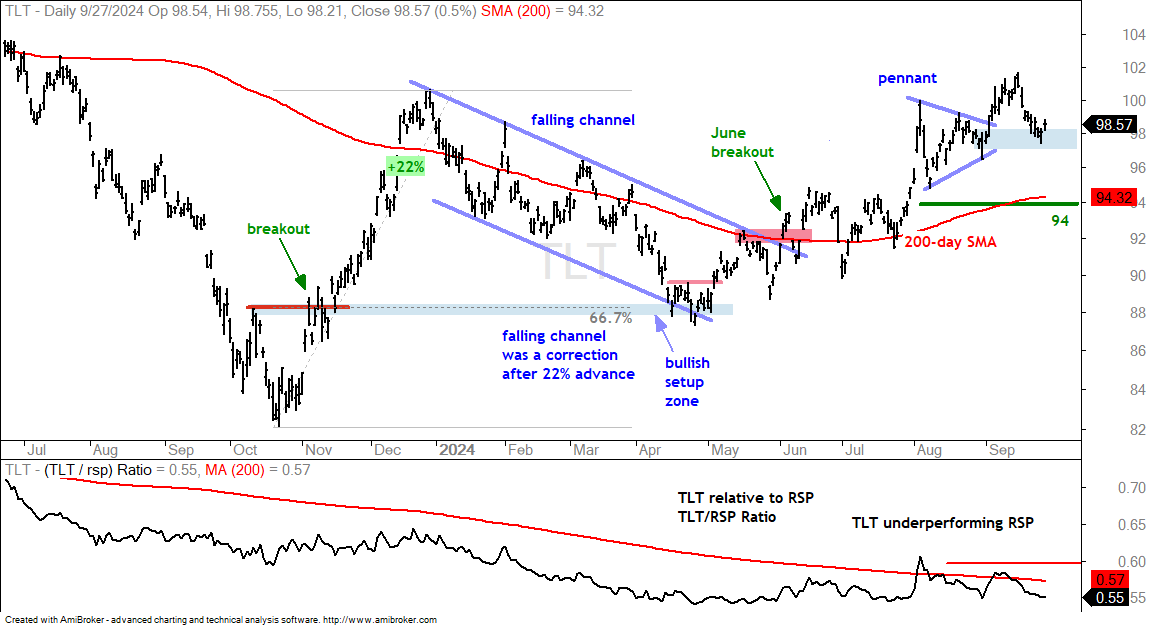
The 20+ Yr Treasury Bond ETF (TLT) is in a long-term uptrend since the breakout in June. Most recently, TLT consolidated with a pennant in August and broke out with a surge in early September. The ETF fell back into the pennant zone (blue shading) and this is a post-breakout throwback. The throwback is a corrective pullback after the breakout and the apex of the pennant acts as support. This is an area to watch for an upside reversal. Long-term support is set at 94.
Bitcoin: Long-term Downtrend with Counter-Trend Bounces
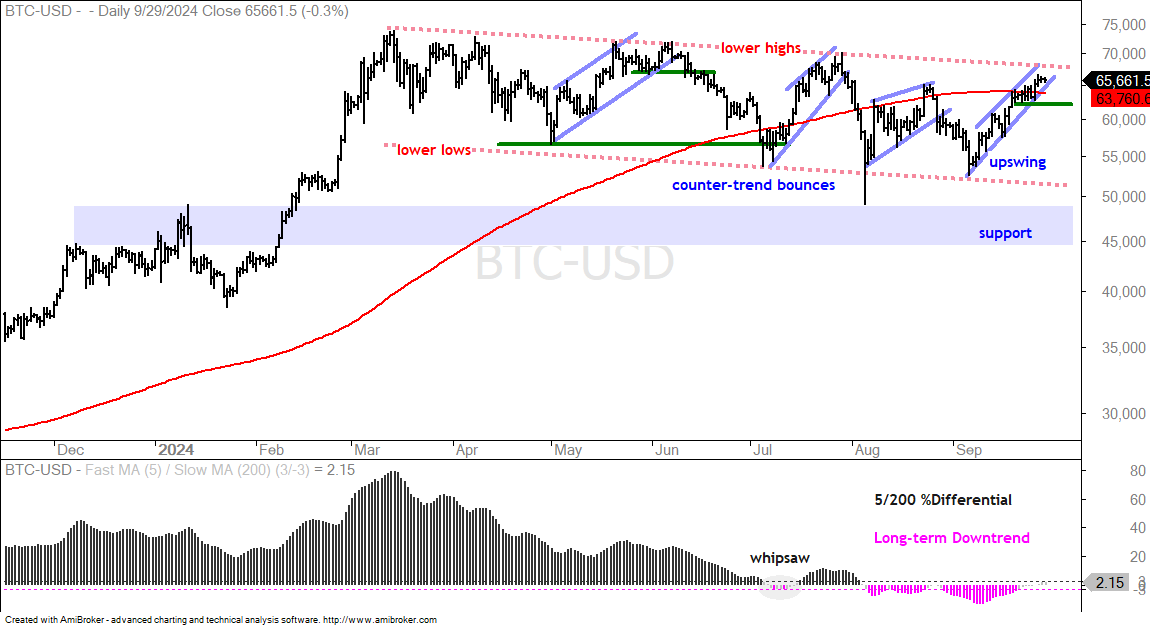
Even though Bitcoin exceeded its April high and 200-day SMA, the long-term trend is down because it remains within a falling channel. The 5/200 %Differential also signals a downtrend since crossing below -3% in early August. It needs to exceed +3% to signal an uptrend. As such, I view the September bounce as another counter-trend bounce within a bigger downtrend (upswing). I am marking support at 62000 and a break here would reverse this upswing.