Systematic Strategies and Next Level Technical Analysis
Chart Trader Weekly Report – Broad Market Analysis, Leading Groups (ETFs), Chart Setups and Trading Ideas (Premium)
Arthur Hill, CMT
Archive
Charts
Use CRTL+P to Print
Video and Report Headlines
Techs Start to Lead in October
Composite Breadth Model is Bullish
BBB Spread Moves to New Lows (narrows)
SPX Leads with Most Long-term Uptrends
New Highs Pop within S&P 500 and Nasdaq 100
SPY Tags Another New High
QQQ, MAGS and XLK Extend on Triangle Breakouts
New Leaders Emerging: Software, Cybersecurity, Cloud, Fintech
AKAM Forms Bullish Pattern at 200-day
MU Surges after Throwback
XLV Remains in Bullish Setup Zone
IBB Hits Short-term Support
VRTX Corrects Back to January High
AMGN Finds Support within Triangle
Live by the Stimulus, Die By the Stimulus (China)
Copper and Base Metals Fall Back Palladium Breaks Flag Resistance
GLD Stalls after Becoming Overbought
TLT Plunges to 200-day SMA
Bitcoin: Short-term Reversal within Downtrend
The next Weekly Report will be posted on Friday morning, October 18th.
The weight of the evidence remains bullish for stocks — VIX, October and the elections be damned. SPY tagged a new high this week, over 70% of S&P 500 stocks are above their 200-day SMAs and yield spreads continue to narrow. The sharp narrowing in yield spreads shows confidence in the credit markets, which is positive for stocks.
The Volatility Index ($VIX) remains elevated (>20), but this could be just hedging activity heading into the election. I think the stock market is looking past the election because the odds favor divided government. It is highly unlikely that one party will control the House, Senate and Presidency. Wall Street prefers gridlock because it reduces the chances for big changes.
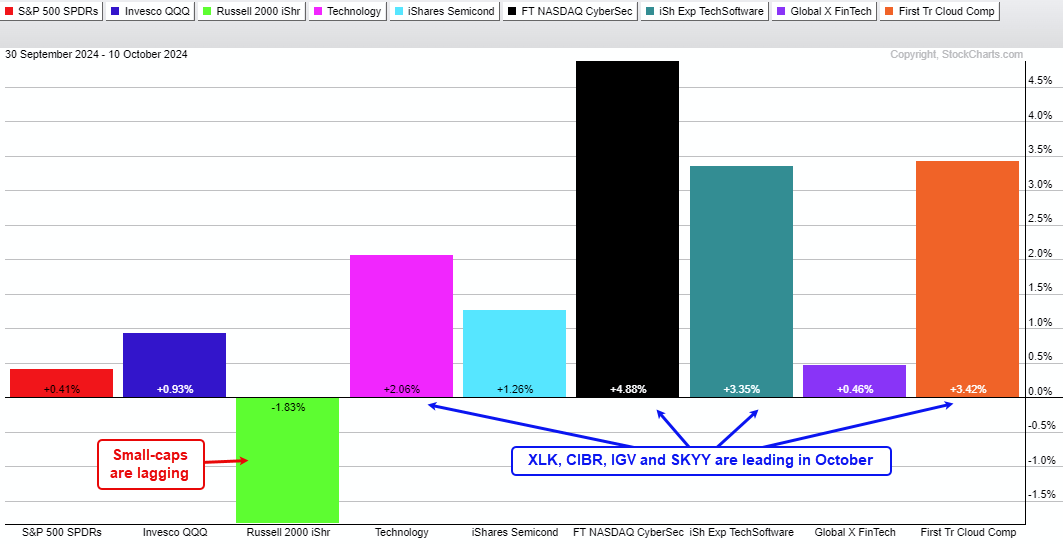
After lagging in from July to September, tech stocks are leading here in October. Many tech groups lagged from July to September. There are early signs of change here in October with leadership coming from cybersecurity, software, and cloud. The PerfChart below shows October performance for SPY, QQQ, IWM and these tech-related ETFs.
Composite Breadth Model is Bullish
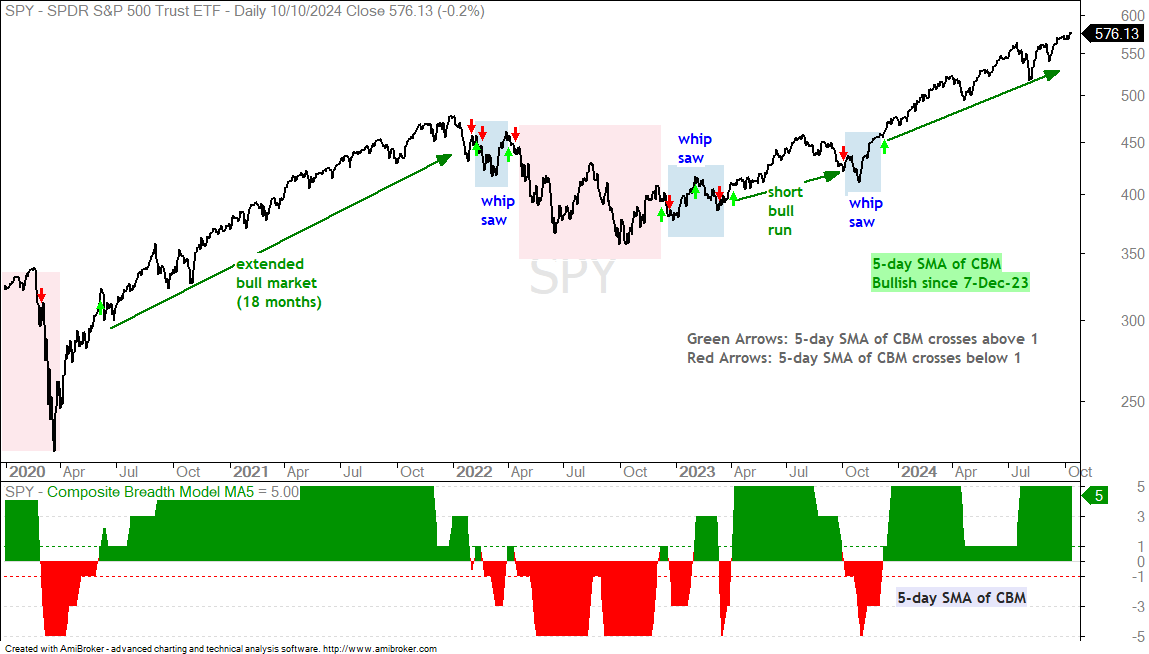
The chart below shows SPY with the 5-day SMA of the Composite Breadth Model at +5. This model turned bullish on December 7th and remains bullish. A positive CBM signals a favorable environment for stocks (bull market). Even within a bull market, we can still see pullbacks, corrections, volatility, rotations and trading ranges.
The Composite Breadth Model aggregates signals in over a dozen breadth indicators from the S&P 500 and S&P 1500. This means it covers large-caps, mid-caps, small-caps, NYSE stocks and Nasdaq stocks. It ranges from +5 to -5. A bull market is present when the 5-day SMA of the CBM is at +1 or higher. A bear market is present when below +1.
BBB Spread Moves to New Lows (narrows)
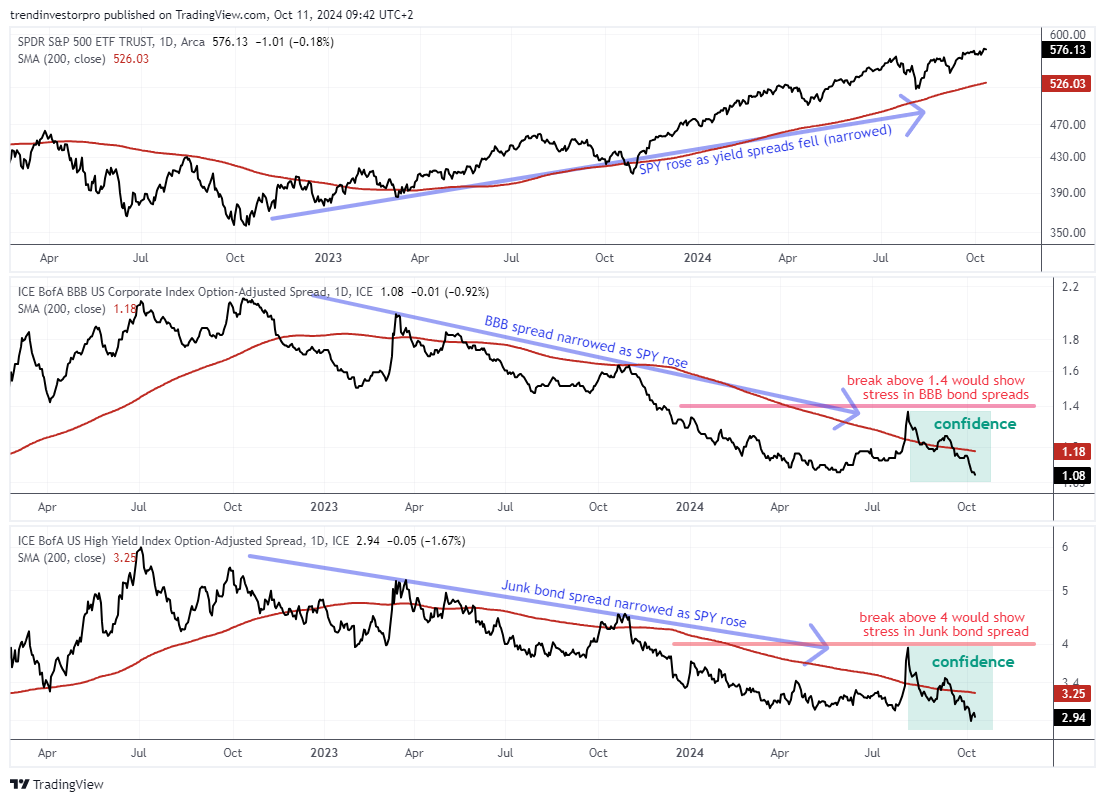
The next chart shows SPY, the BBB spread and the Junk bond spread with their 200-day SMAs. The BBB and Junk bond spreads widened sharply with a pop in early August, but quickly fell back and narrowed to new lows here in October (green shading). This narrowing shows increasing confidence in the corporate credit markets and this is positive for stocks.
The next chart shows SPY, the BBB spread and the Junk bond spread with their 200-day SMAs. The BBB and Junk bond spreads widened sharply with a pop in early August, but quickly fell back and drifted lower the last two months. They are at narrow levels overall and showing confidence in the credit markets. Breakouts at 1.4 in the BBB spread and 4 in the Junk spread would be bearish for stocks.
These spreads show the difference between a corporate bond yield (BBB) and the equivalent US Treasury bond yield. BBB bonds are the lowest rated investment grade bonds. US Treasuries are the ultimate safe-haven bonds. The spread between these two widens (rises) when stress builds in the corporate bond market. This is negative for stocks. The spread narrows (falls) when stress levels are low or subsiding. This is positive for stocks.
SPX Leads with Most Long-term Uptrends
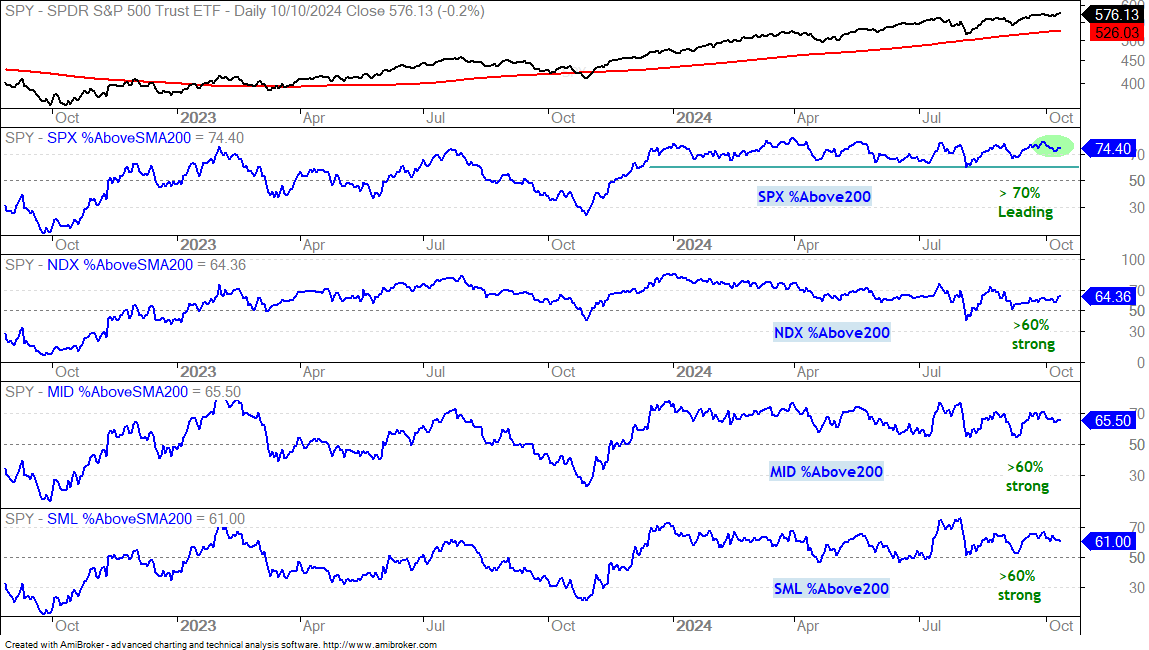
The chart below shows the percentage of stocks above the 200-day SMA for the S&P 500, Nasdaq 100, S&P MidCap 400 and S&P SmallCap 600. S&P 500 stocks are leading the pack because over 70% of components are above their 200-day SMAs. So far, rumors of small-cap leadership have been greatly exaggerated. As the first indicator window shows, this indicator has been above 60% since early December (green line). NDX %Above200 and MID %Above200 are both above 60% and showing enough strength within to support a bull market. SML %Above200 is also above 60%, but the lowest of the group as small-caps lag.
New Highs Pop within S&P 500 and Nasdaq 100
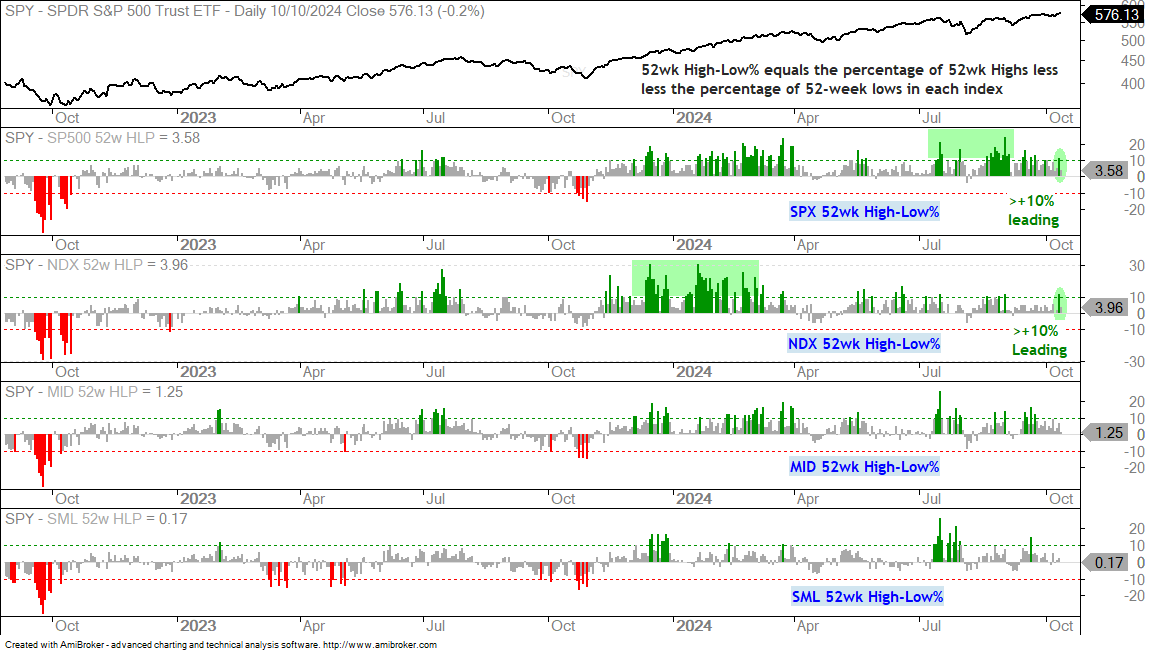
We are seeing renewed interest in large-caps as new highs expanded within the S&P 500 and Nasdaq 100 this week. Notice the 52-week High-Low Percent exceeded +10% for each this week (green ovals). SPX High-Low Percent was stronger from early July to early September (green rectangle). NDX High-Low Percent was stronger from December to March (green rectangle). Even though we are not reaching levels previous seen, this indicator group remains firmly bullish. High-Low Percent for mid-caps and small-caps remains subdued for now, but not bearish. The trouble does not start until the indicators start dipping below -10%.
SPY Tags Another New High
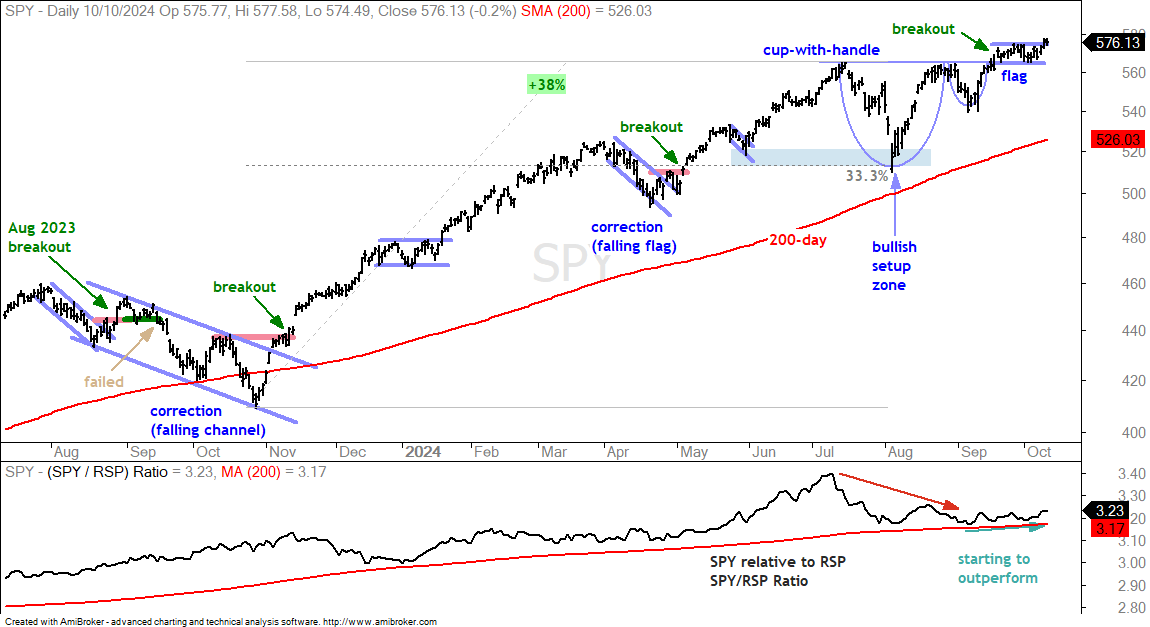
SPY remains in a long-term uptrend. The ETF is well above the rising 200-day SMA and hit another new high this week. Overall, a cup-with-handle pattern formed from mid July to mid September and SPY broke rim resistance with a surge on September 19th. This breakout held as the ETF consolidated above the breakout level. A small flag formed over the last few weeks and Wednesday’s surge broke flag resistance. The flags low now mark short-term support to watch for signs of a failed breakout and pullback. I will revisit pullback targets should SPY break the flag lows.
The bottom window on the chart above shows the SPY/RSP ratio. Large-caps are leading long-term, but showed some relative weakness in July and August. This was not so much based on weakness in SPY, but rather strength in the S&P 500 EW ETF (RSP). The SPY/RSP ratio held above the rising 200-day SMA in September and turned up the last few weeks. Perhaps large-caps are poised to resume their leadership role in the fourth quarter.
QQQ, MAGS and XLK Extend on Triangle Breakouts
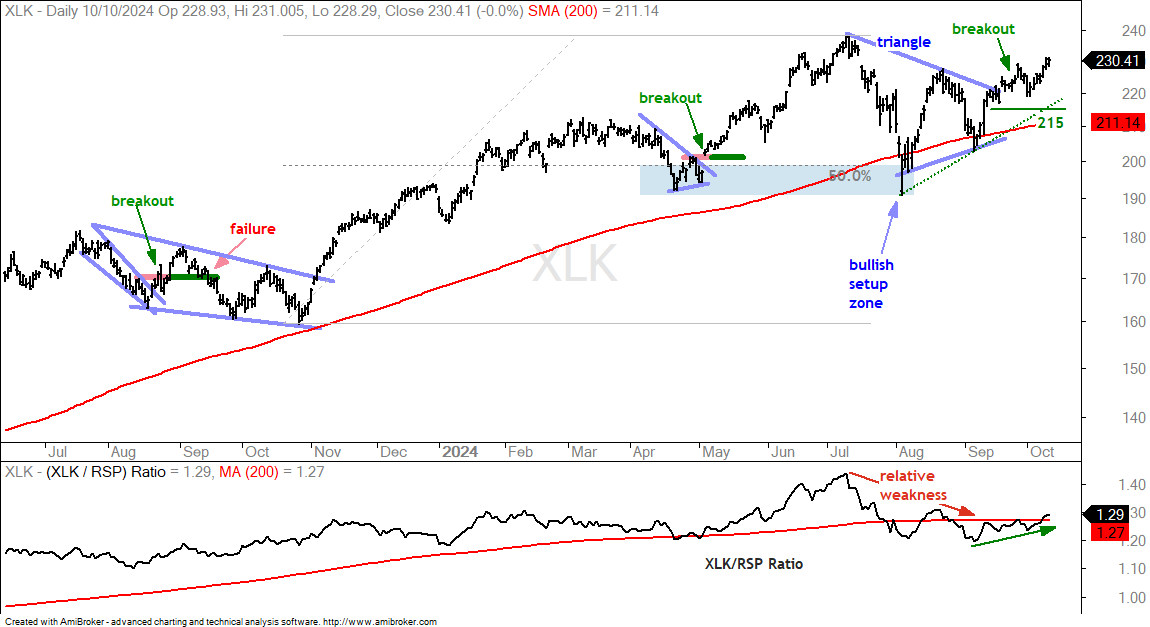
There are no changes on the charts for the Nasdaq 100 ETF (QQQ), Mag7 ETF (MAGS) and Technology SPDR (XLK). All three are in long-term uptrends and well above their rising 200-day SMAs. They formed triangle consolidation patterns from early July to mid September and broke out in the second half of September. After an extended advance, a triangle consolidation is a consolidation within an uptrend. It is a bullish continuation pattern that is the pause the refreshes. The breakouts signal a continuation of the long-term uptrends and new highs are expected. I am marking re-evaluation levels just below the triangle breakouts (green lines).
The first chart shows QQQ with the triangle breakout and re-evaluation support marked at 465. The indicator window shows the QQQ/RSP ratio falling in July and August as QQQ underperformed. It firmed the last few weeks and turned up.
The next chart shows the Mag7 ETF (MAGS) with re-evaluation support marked at 44. The price-relative (MAGS/RSP ratio) fell in July-August, bottomed in early September and moved higher the last few weeks (green arrow).
The next chart shows the Technology SPDR (XLK) with re-evaluation support marked at 215. The XLK/RSP ratio broke its 200-day SMA with an upturn this week.
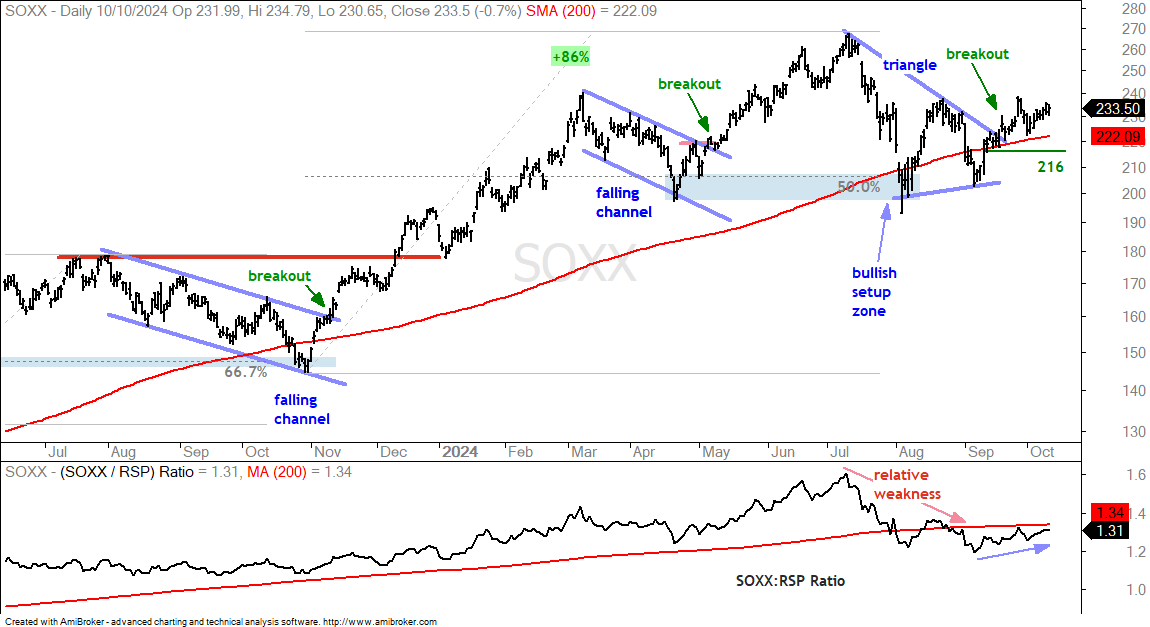
The next chart shows the Semiconductor ETF (SOXX) showing a little less strength because it has yet to clear the mid August high. Even so, the ETF hit a new high in early July, formed a triangle consolidation into mid September and broke out with a surge into late September. I am marking re-evaluation support at 216. A break here would negate the triangle breakout and be negative.
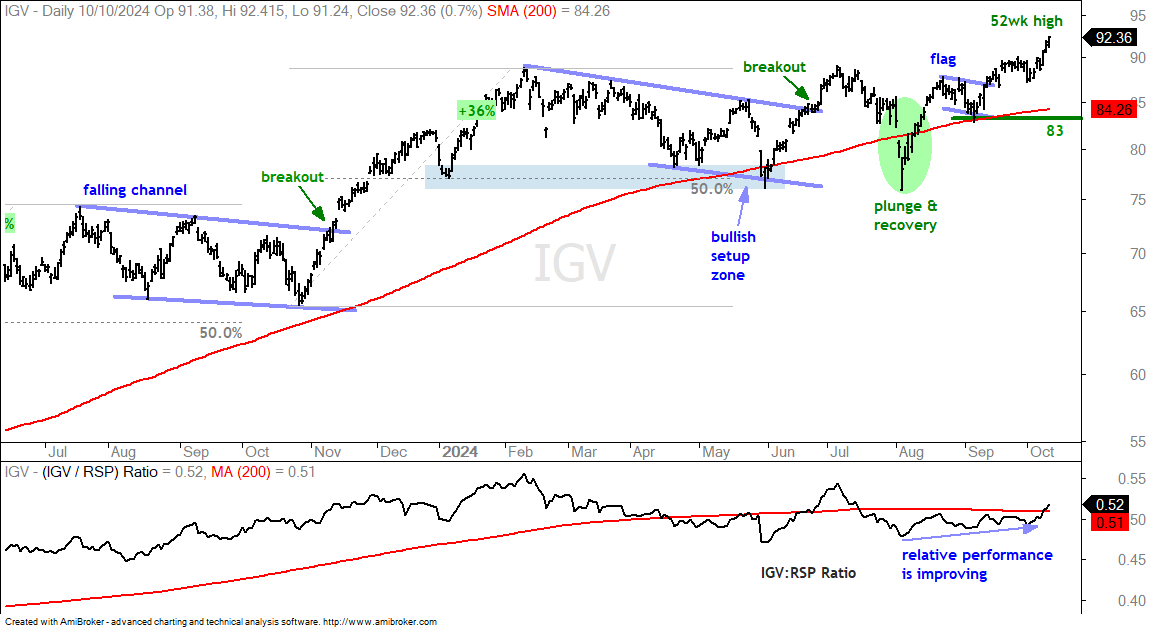
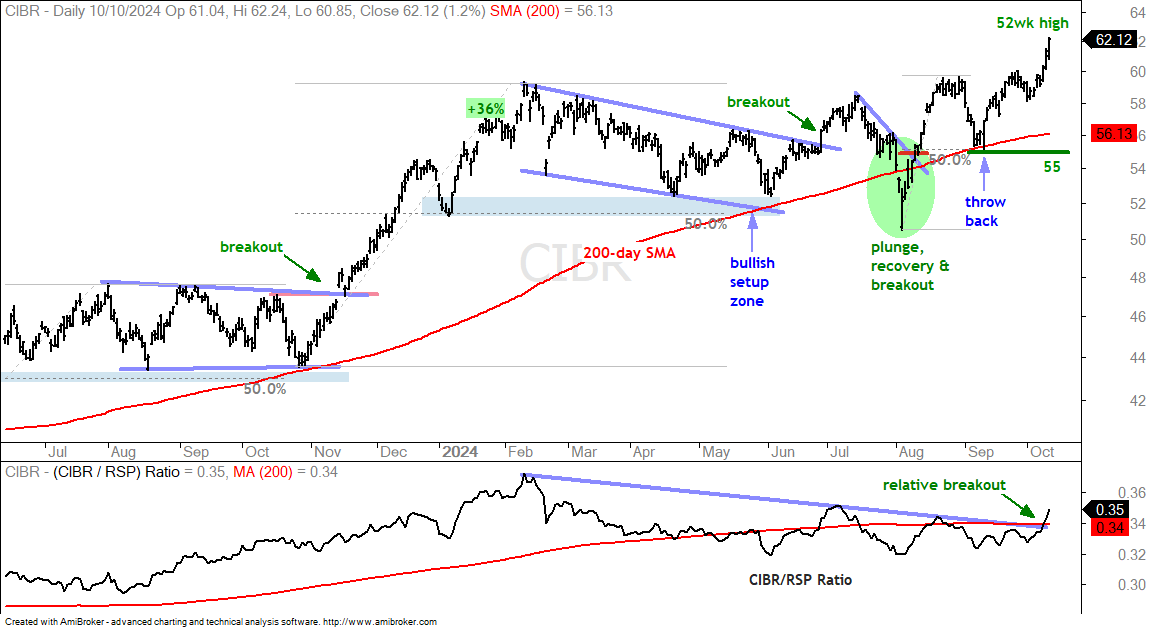
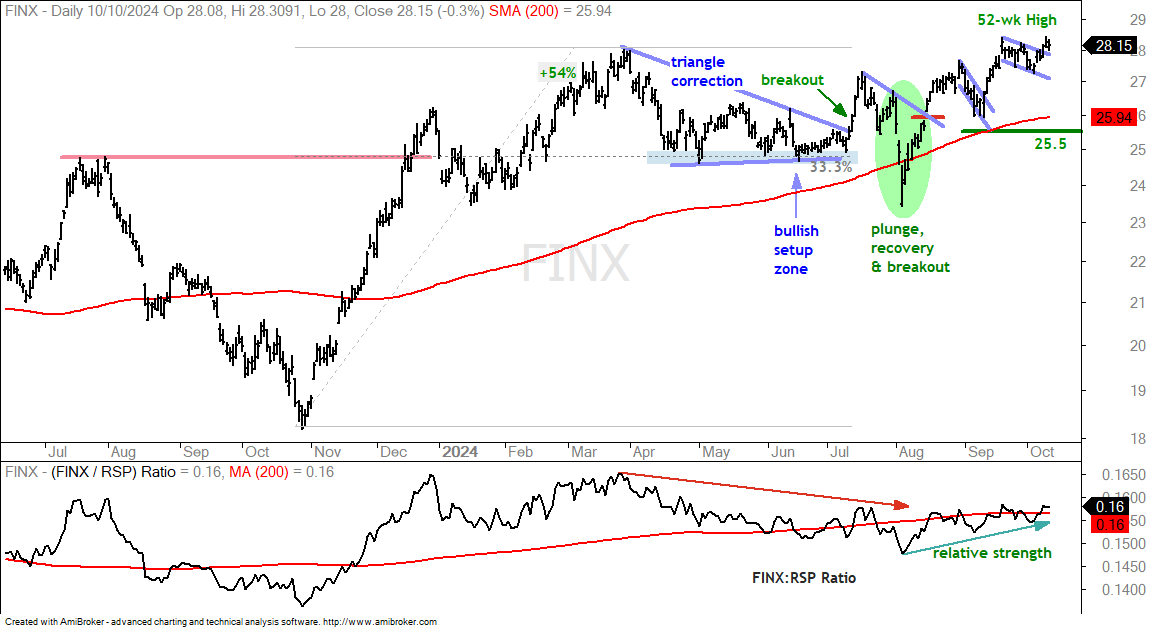
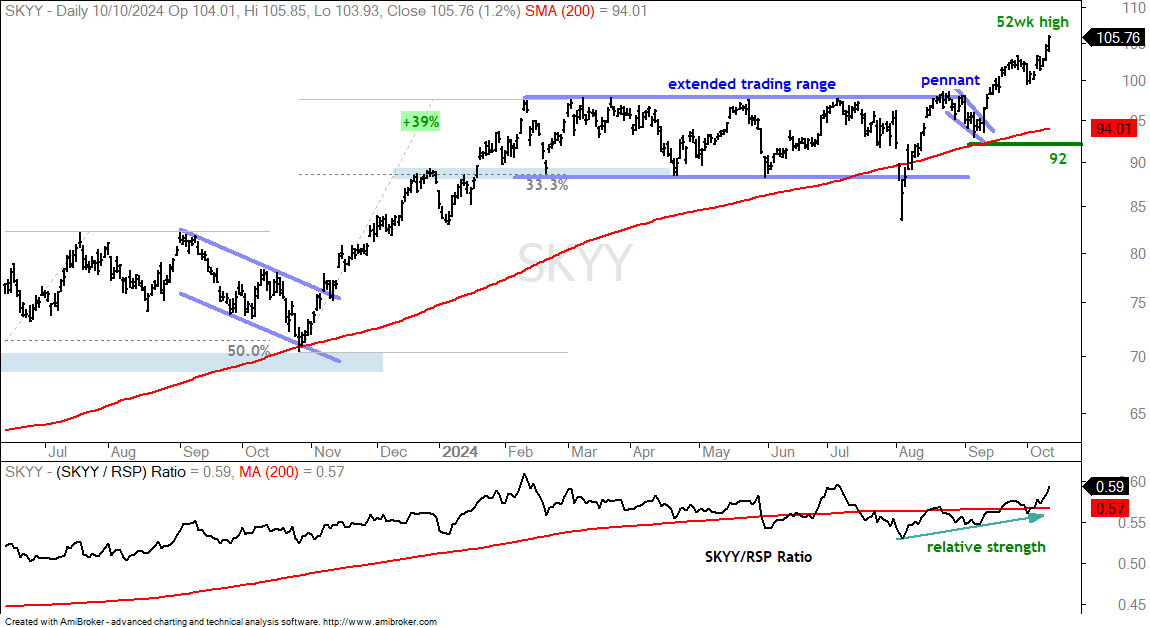
The Software ETF (IGV), Cybersecurity ETF (CIBR), FinTech ETF (FINX) and Cloud Computing ETF (SKYY) hit new highs this week and are leading within the tech sector. They are also starting to lead the broader market as their price-relatives turned up the last few weeks. These charts were quite messy in July-August as we saw a sharp decline into early August and a sharp rebound (green ovals). This appears to be a downside overshoot or shake out as prices firmed into September and the summer breakouts got back on track.
The first chart shows the Software ETF (IGV) with a breakout in late June, a plunge-recovery and then a flag into early September. IGV broke out of the flag and surged to a new high this week. The indicator window shows the IGV/RSP ratio working its way higher since early August and moving above the 200-day SMA this week.
The next chart shows the Cybersecurity ETF (CIBR) with similar characteristics overall. CIBR surged 5% the last five days and hit a new high. The indicator window shows the CIBR/RSP ratio breaking out as CIBR starts to lead.
The next chart shows the FinTech ETF (FINX) with a flag forming in late September, a flag breakout this week and a 52-week high. The indicator window shows the price-relative moving higher since August as FINX shows some relative strength.
The next chart shows the Cloud Computing ETF (SKYY) with an extended trading range, a breakout to new highs in mid September and a surge to new highs here in October. The SKYY/RSP ratio is also turning up as SKYY starts to outperform again.
AKAM Forms Bullish Pattern at 200-day
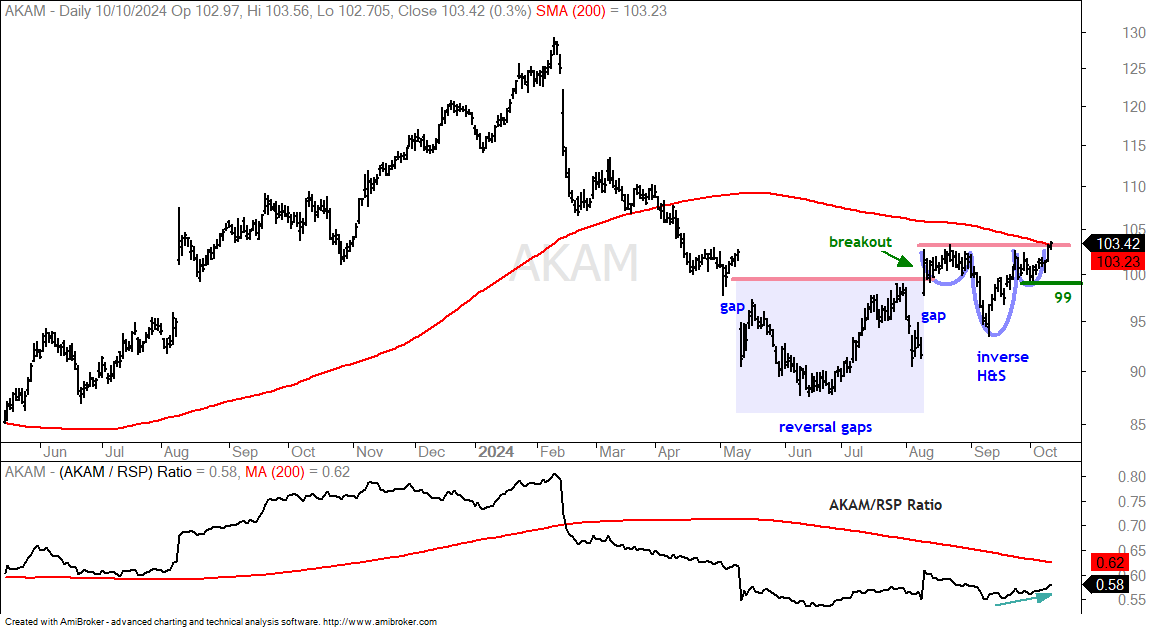
The next two stocks come from the tech sector. The first chart shows Akamai Technologies (AKAM) with a reversal in August and an inverse head-and-shoulders pattern into October. First, note that the long-term trend is still down on this chart, but there are signs of a bottom with the reversal from May to August. It is not quite an island reversal pattern, but has similar characteristics with the gap down in early May and gap up in August. The last gap also triggered a breakout. AKAM then moved into consolidation mode with an inverse head-and-shoulders. This pattern is a bullish continuation pattern when it forms after an advance or within an uptrend. The 200-day SMA and August-September highs mark resistance at 103.5 and a breakout here would be bullish. Upon a breakout, I would mark support at 99.
MU Surges after Throwback
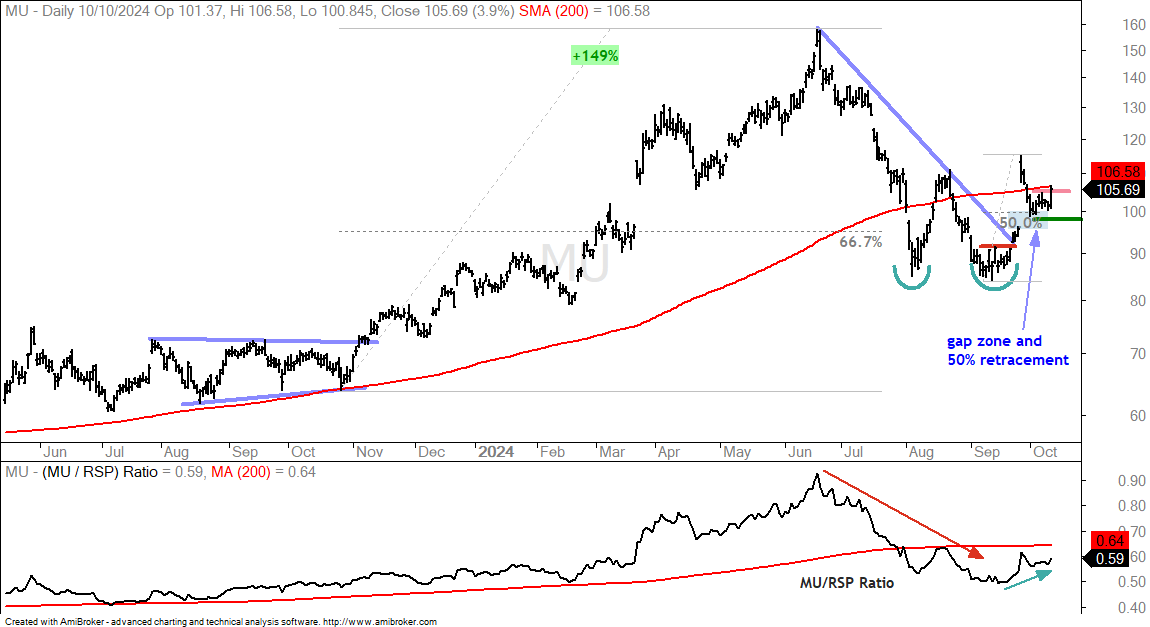
Micron (MU) is no stranger to volatility. The stock advanced 149% from late October to late June and then fell 45% into early August. The stock found support twice in the low 80s (green arcs) and then broke out with a gap-surge in late September. From low to high, MU advanced some 35% in 11 days. This stock is like riding a bull in the rodeo. MU caught my eye because it retraced 50% of the September surge with a throwback. The stock firmed for a few days and then broke short-term resistance with a pop on Thursday. This is the first sign that the breakout is continuing. A close below 98 would call for a re-evaluation.
XLV Remains in Bullish Setup Zone
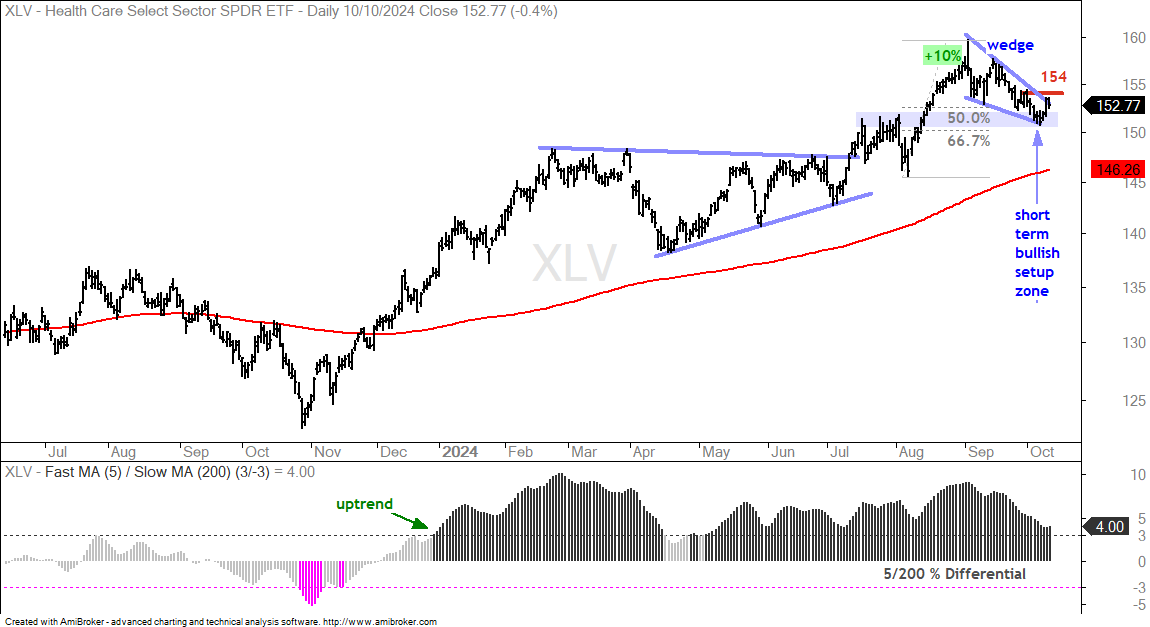
The next chart shows the Healthcare SPDR (XLV) hitting a Bullish Setup Zone (blue shading). I showed this chart last week and will update it because the setup remains in play. First and foremost, XLV is in a long-term uptrend. After a 10% advance, the ETF fell back to the breakout zone in the low 150s. This decline also formed a falling wedge and retraced 50-67% of the 10% advance. Thus, we have a Bullish Setup Zone. I am marking short-term resistance at 154 and a breakout here would be bullish.
IBB Hits Short-term Support
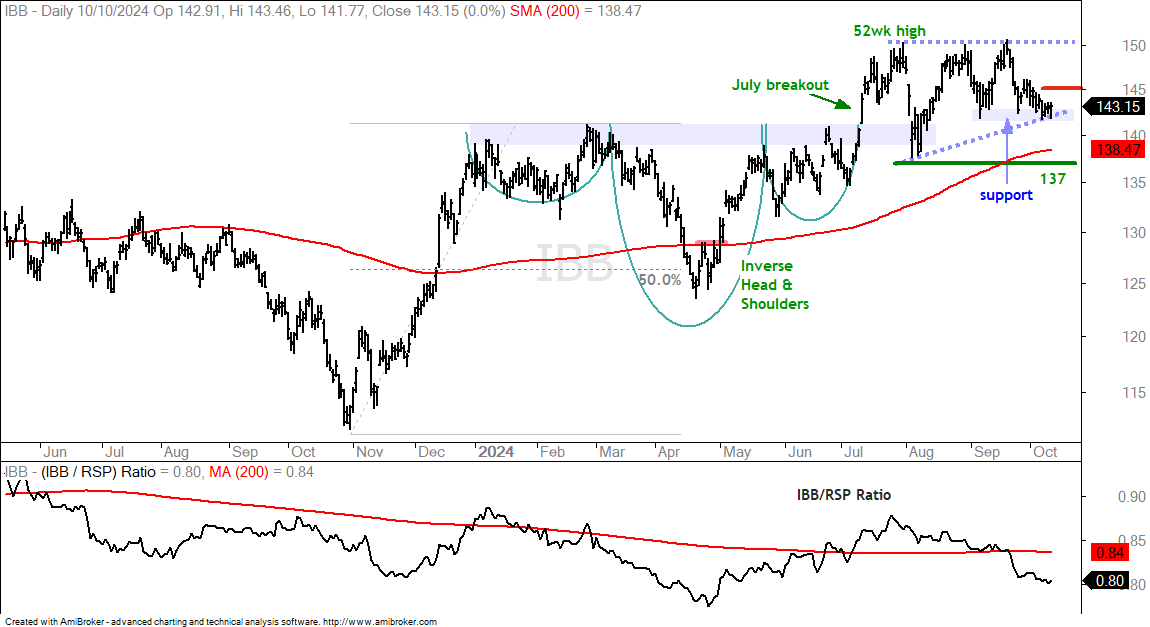
The next chart shows the Biotech ETF (IBB) breaking out with a surge in July and then consolidating after this breakout. First, IBB is in a long-term uptrend with re-evaluation support marked at 137. Short-term, the dashed blue lines show a possible Ascending Triangle taking shape. This is a bullish continuation pattern that would be confirmed with a breakout at 150. Within the pattern, the current price swing is down and IBB is testing support from the early September low (blue shading). A surge off this support zone would provide the first clue that IBB will make a run for resistance.
VRTX Corrects Back to January High
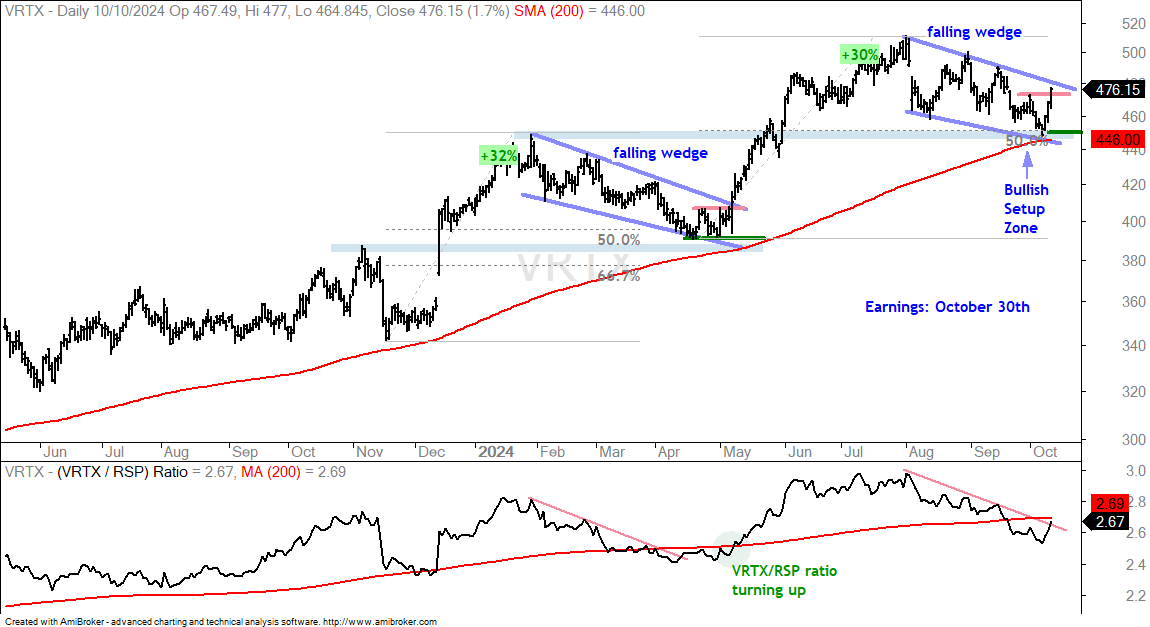
The next two stocks come from the healthcare sector. First, Vertex Pharmaceutical (VRTS) is correcting within a long-term uptrend and bouncing off the rising 200-day SMA this week. The current pattern/setup looks very similar to the falling wedge earlier this year. VRTX advanced 30% into early August and then retraced around 50% with a decline back to the 200-day SMA. This decline also returned to the January high, which was prior resistance. Taken together, we have a Bullish Setup Zone in the 450 area (blue shading). The late September high marks first resistance at 473 and the stock broke this level on Thursday. This mini-breakout is the first sign that VRTX will attempt a bigger wedge breakout. Re-evaluation support is set at 450.
AMGN Finds Support within Triangle
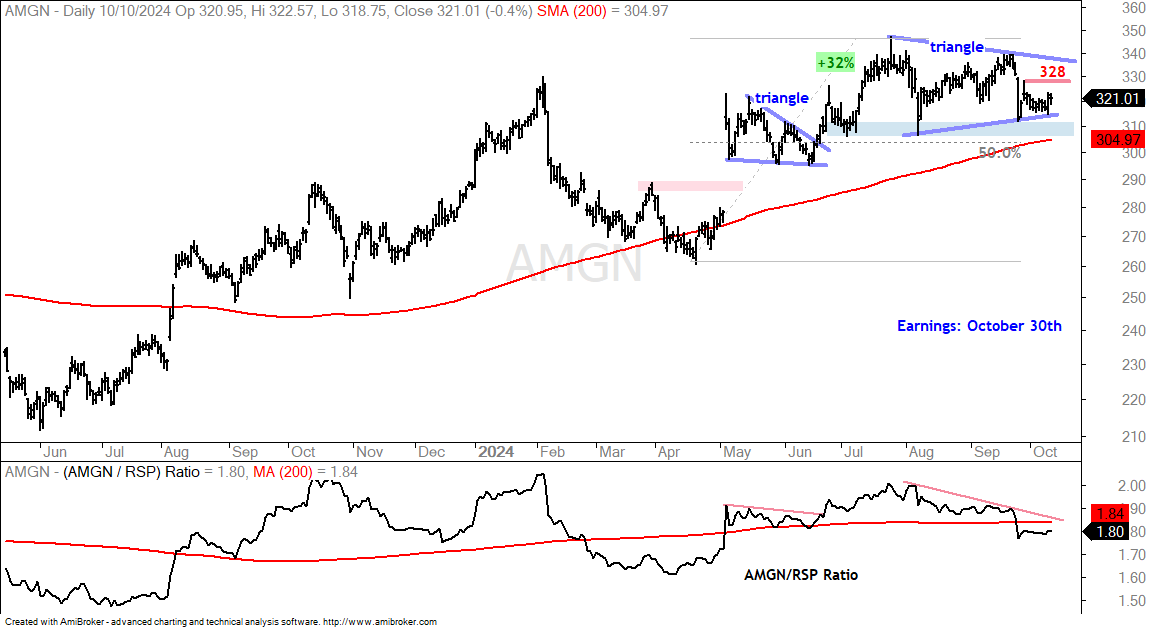
The next chart shows Amgen (AMGN) advancing 32% into July and hitting a new high. The stock then move into a consolidation pattern as a triangle formed. AMGN established support in the 310 area with lows in early July and early August (blue shading). It is also worth noting that the rising 200-day SMA is around 305 and the 50% retracement is around 304. Overall, I view the triangle as a consolidation within an uptrend and a breakout at 340 would be bullish. Within the triangle, the swing is down with first resistance marked at 328. A breakout here would provide the early sign of strength.
Live by the Stimulus, Die By the Stimulus (China)
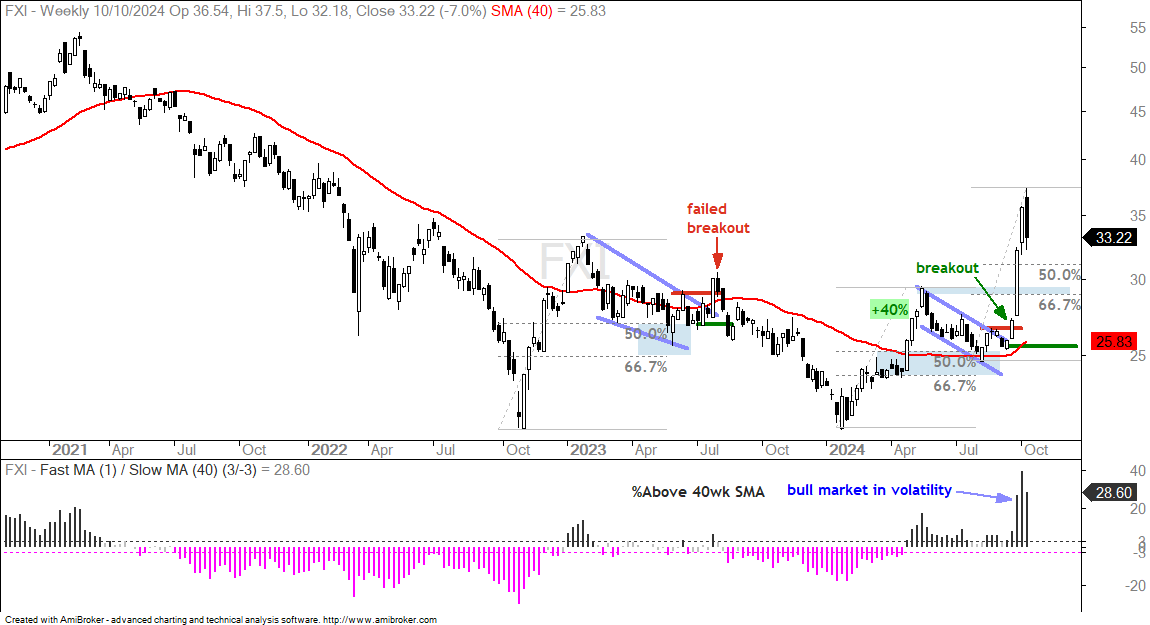
Chinese equities remain with massive breakouts, but we are also seeing some serious volatility around the news flow. News of stimulus triggered a buying binge in September. This week’s lack of detail and some disappointments triggered selling pressure. Volatility is also in a bull market here so prepare for a wild ride. The chart below shows weekly candlesticks for the China Large-Cap ETF (FXI). FXI surged some 40% in four weeks and broke out on the second week of this move. The ETF started the week strong, but selling pressure hit and FXI fell sharply. The breakout is still valid and the long-term trend is up, but volatility could lead to choppy trading and it could be several weeks before we see another tradable pattern. These include falling wedges, falling flags or throwbacks to prior resistance. The blue shading marks broken resistance from the May high. We also have the 50-67 percent retracement zone in the 29-31 area. This is the zone to watch in the coming weeks.
Copper and Base Metals Fall Back
While China is certainly a major player in the global economy, it is not the only player. SPY, the S&P 500 EW ETF (RSP) and the Industrials SPDR (XLI) hit new highs over the last two weeks. US stocks are clearly stronger than Chinese stocks long-term. New highs in XLI also point to broad strength in the old economy, which could be positive for the Copper ETF (CPER) and DB Base Metals ETF (DBB). This, of course, is just narrative. And narratives can be trouble. Truth be told, we cannot be aware of all the supply and demand drivers for copper and based metals. All known information, however, is reflected in price, which means we should follow price for clues. IMHO!
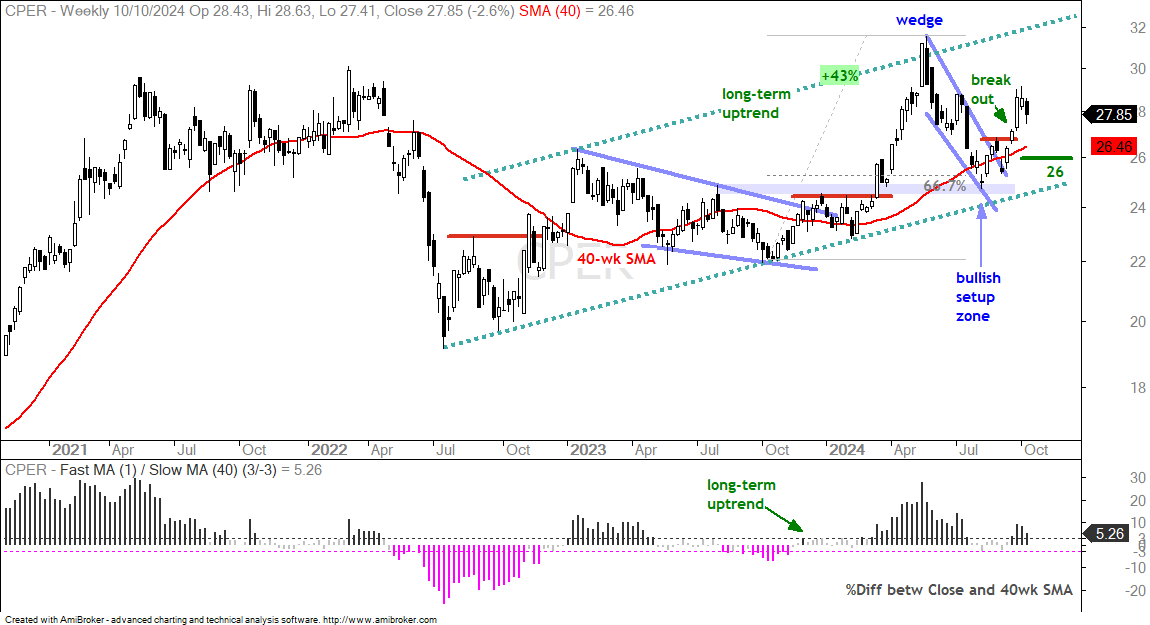
The chart below show CPER in a long-term uptrend. CPER sports a higher low from July 2022 to October 2023 and a higher high from January 2023 to May 2024. These highs and lows mark a rising channel over the last two years (green dashed lines). CPER fell hard from May to August as it retraced 66.7% of the prior advance and returned to the rising 40-day SMA. After battling this long-term moving average, the ETF broke out with a surge in September. This breakout is long-term bullish and argues for a move to new highs in the coming months. The ETF fell back this week, but the breakout remains in play. I will mark re-evaluation support at 26.
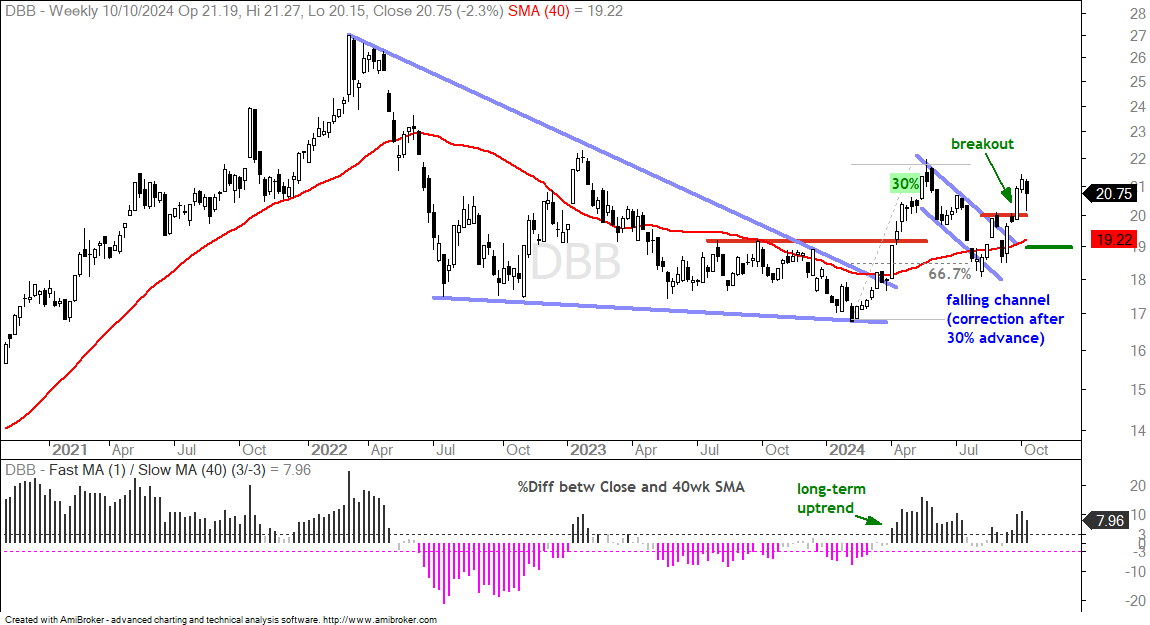
The next chart shows the DB Base Metals ETF (DBB) with a channel breakout three weeks ago. I am marking re-evaluation support at 19.
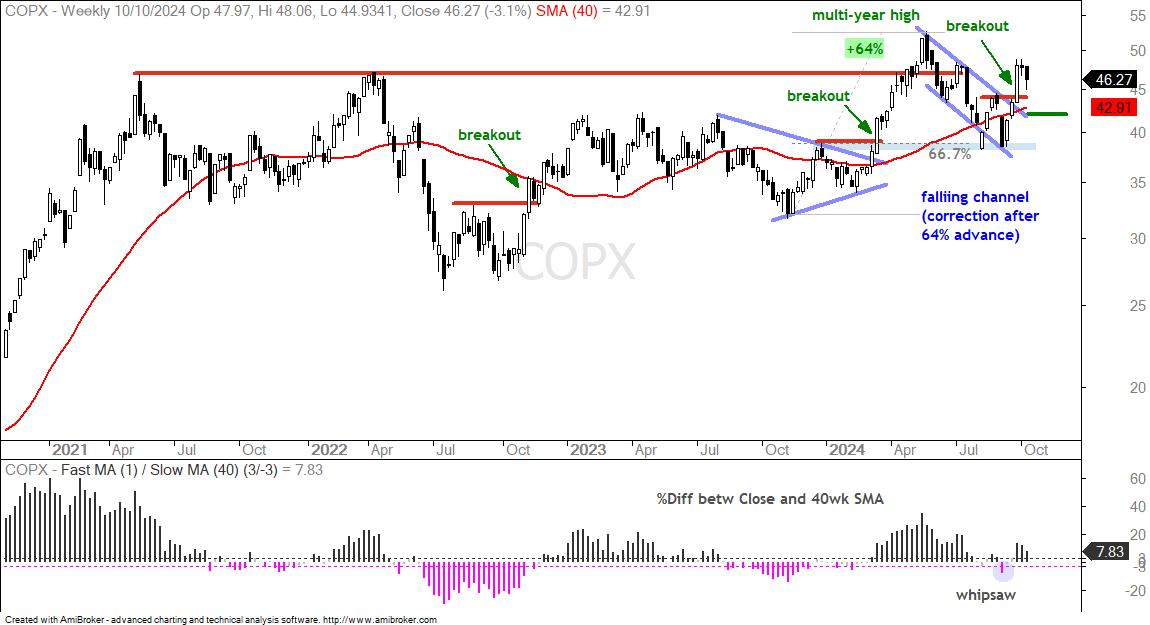
The next chart shows the Copper Miners ETF (COPX) with a breakout and re-evaluation support marked at 42.
Palladium Breaks Flag Resistance
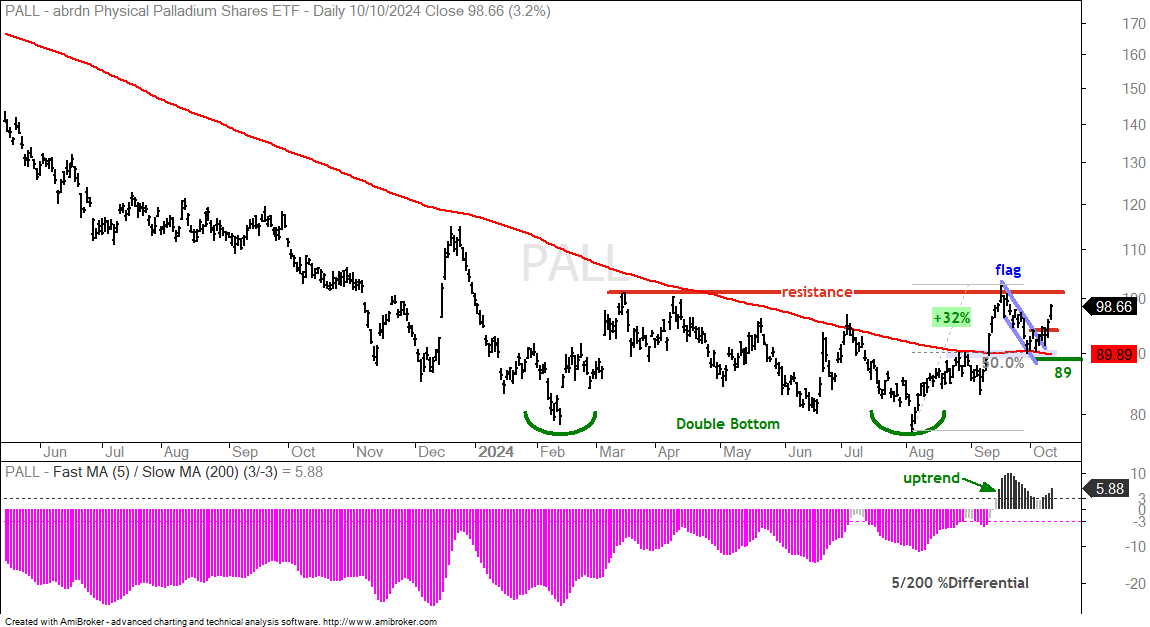
The next chart shows the Palladium ETF (PALL) with an extended double bottom from February to August. This is pretty much one big basing pattern and a breakout would confirm the pattern. More near term, PALL advanced 32% in August-September and broke the 200-day SMA. The indicator window shows the 5/200 %Differential exceeding +3% to signal an uptrend. Thus, the long-term outlook for PALL is bullish. Short-term, the ETF fell back to a bullish setup zone at the end of September (50% retracement, 200-day SMA and prior breakout). A falling flag also formed and the ETF broke out this week. This is a corrective pullback after the 32% surge and the breakout signals a continuation higher, and increases the chances for a bigger breakout. I will mark re-evaluation support at 89.
TLT Plunges to 200-day SMA
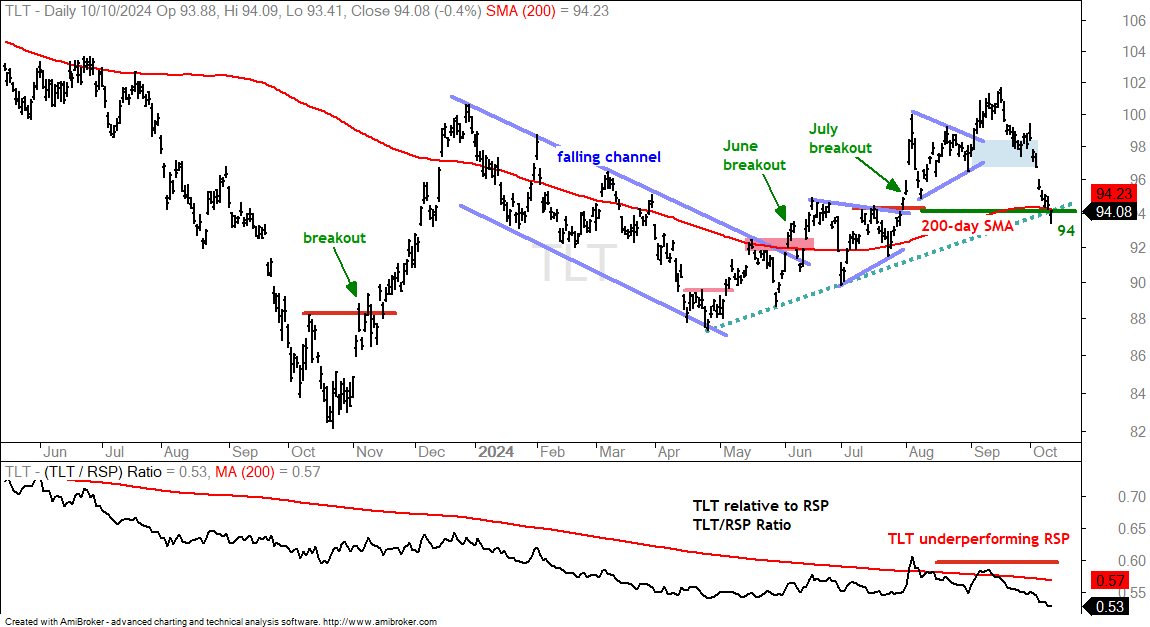
The 20+ Yr Treasury Bond ETF (TLT) hit a support zone in late September (blue shading), but did not firm as it continued sharply lower this week. Overall, TLT fell over 7% in 17 trading days. This is a very sharp decline that looks more like an impulse move, as opposed to a corrective move. Impulse moves are in the direction of the bigger trend. Even so, this decline puts TLT at its make or break level. The ETF is trading near the 200-day SMA, the April trendline and the July breakout. It is also short-term oversold. Taken together, this is a zone that could lead to firmness and a bounce. The indicator window shows TLT underperforming RSP, which is positive for stocks (and negative for bonds). These two represent the ultimate safe-haven/risk pair. Risk is on when TLT lags and RSP leads.
GLD Stalls after Becoming Overbought
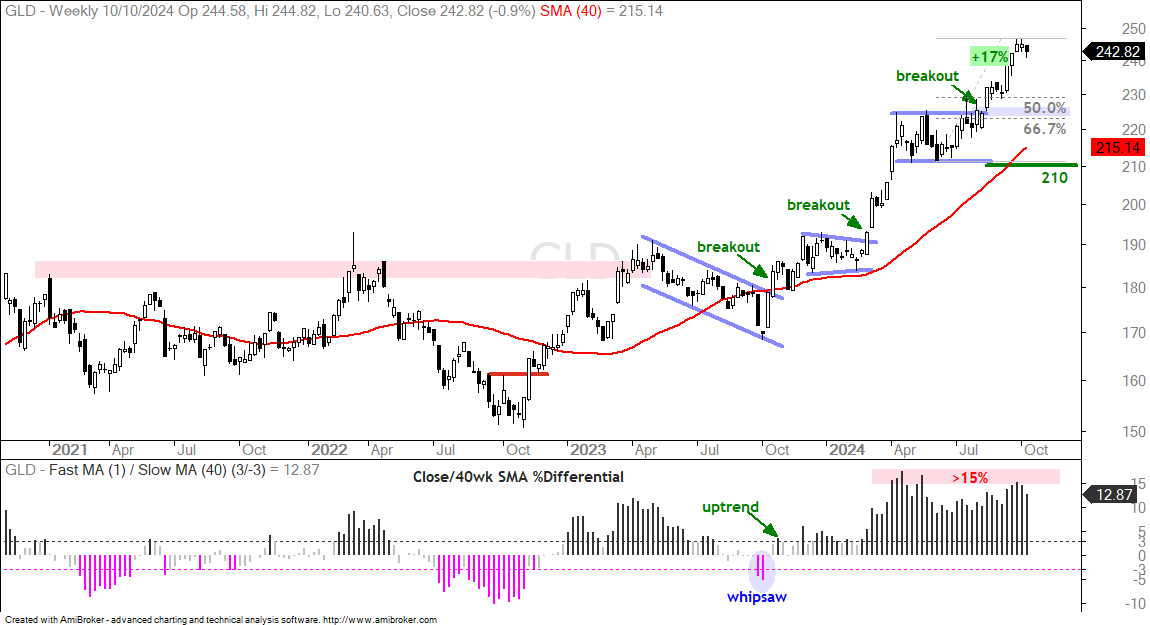
The Gold SPDR (GLD) remains in an uptrend, but it became quite extended three weeks ago and could be poised for a rest. The chart shows weekly candlesticks with GLD hitting a new high three weeks ago. GLD consolidated from mid April to mid July and broke out around 225. Overall, the ETF advanced 17% from the June low to the September high (16 weeks) and the Close/40wk SMA %Differential exceeded +15% (red shading in indicator window). This shows an overbought condition similar to April. Should GLD correct, I would mark a Bullish Setup Zone in the 225 area. This zone stems from broken resistance and the 50-67% retracement zone.
Bitcoin: Long-term Downtrend and Short-term Reversal
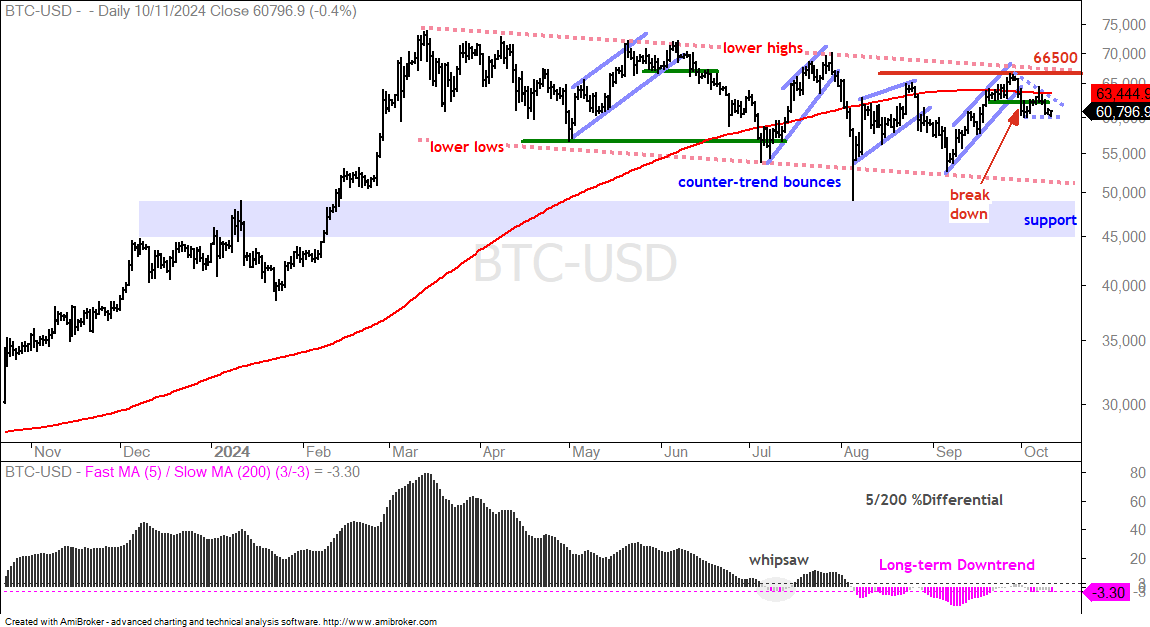
Bitcoin remains in a long-term downtrend with lower lows and lower highs since April. Overall, a falling channel defines this downtrend with resistance marked at 66,500 (September high). BTC rose with the stock market in September and exceeded its 200-day SMA for a few days. This breech did not last as the crypto fell sharply and broke short-term support (red arrow). The swing is down and in the same direction as the long-term trend (down). This argues for a continuation of the long-term downtrend and a target in the low 50,000 area. The dashed lines mark the alternative pattern that would proven this short-term breakout wrong. A pennant of sorts is possible and a breakout at 65000 would be short-term bullish.