Moving from Thrust Signals to a Bull Market

Thrust and 200-day Crosses

The bullish signals stacked up in April and May, but most long-term breadth indicators are still bearish. SPY and QQQ showed signs of capitulation in early April and rebounded into mid April. A Zweig Breadth Thrust triggered on April 24th and several other thrust indicators turned bullish in May. We also saw SPY and QQQ break their 200-day SMAs. TrendInvestorPro is tracking these signals and relevant exit strategies.

Exit strategies are just as important as entries. The Zweig Breadth Thrust and the 5/200 day SMA cross provided entry signals in April and May. Chartists now need an exit strategy. TrendInvestorPro put forth exit strategies for both signals and these are updated in our reports. This week we covered the gap zones in SPY and QQQ, long-term breadth signals, big moves in metals and continued strength in Bitcoin.

Click here to take a trial and gain full access.

These are bullish indications for large-caps and, perhaps, stocks in the top half of the S&P 500. However, I would not call it a bull market until participation broadens. The chart below shows the S&P 500 EW ETF (RSP) and S&P MidCap 400 SPDR (MDY) moving back below their 200-day SMAs. The S&P SmallCap 600 SPDR (IJR) never came close and remains a big laggard.   

The bottom window is perhaps the most telling. It shows the percentage of S&P 1500 stocks above their 200-day SMAs. This long-term breadth indicator did not cross above 50% in May. Except for a 1-day dip on January 10th, this indicator was above 50% from December 2023 to February 2025 (bull market). It broke below 40% on March 10th and has yet to fully recover (bear market). At the very least, a move above 50% is needed to show broadening participation worth of a bull market. This is how the market moves from bullish thrust signals to a bull market.  

The S&P 1500 includes large-caps (500), small-caps (600) and mid-caps (400). Around 2/3 of components NYSE stocks and 1/3 Nasdaq stocks. It is a truly representative of the broader market.

Exit strategies are just as important as entries. The Zweig Breadth Thrust and the 5/200 day SMA cross provided entry signals in April and May. We now need an exit strategy. TrendInvestorPro put forth exit strategies for both signals and these are updated in our reports. This week we covered the gap zones in SPY and QQQ, long-term breadth signals, big moves in metals and continued strength in Bitcoin. Click here to take a trial and gain full access. 

SPY Recaptures 200-day – Tips to Reduce Whipsaws and Improve Performance

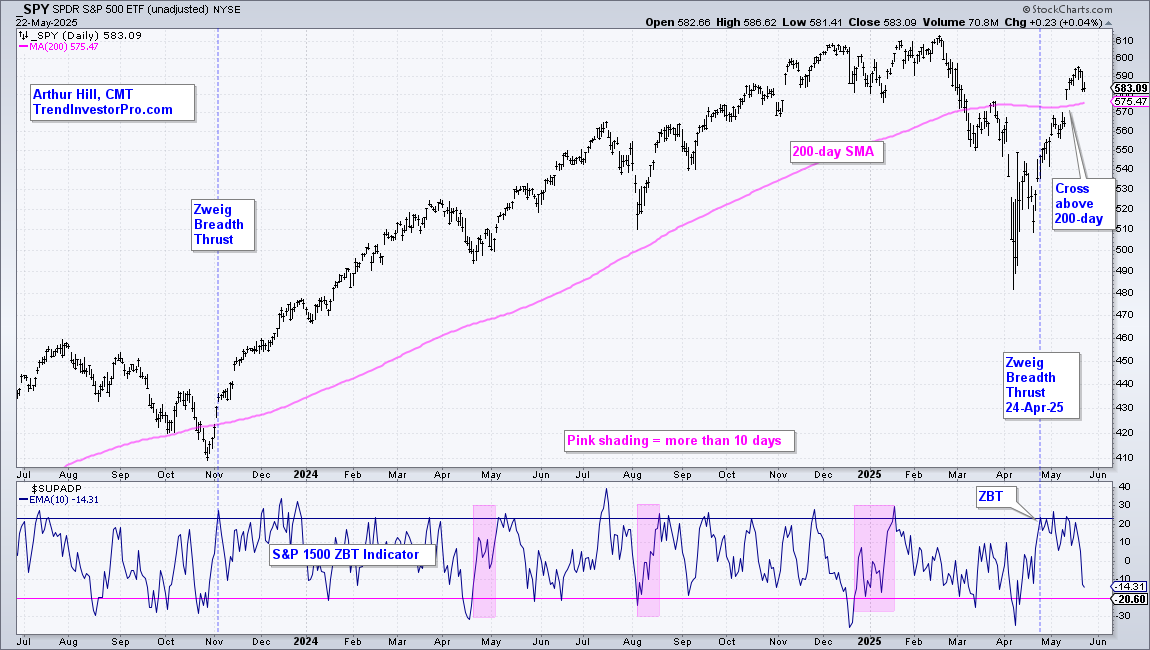
SPY and QQQ crossed above their 200-day SMAs with big moves on Monday, and held above these long-term moving averages the entire week. The V-Reversal was extraordinary and SPY seems short-term overbought, but this cross above the 200 day SMA cross is a bullish signal for the most important market benchmark. Despite a bullish signal, long-term moving averages are

SPY Recaptures 200-day – Tips to Reduce Whipsaws and Improve Performance Read More »

Bottoming Process – Capitulation, Short and Medium Term Thrusts, Regime Change

The market does not always follow the same script or sequence, but bear markets end with a bottoming process that often goes in stages. First, there is the capitulation phase, which suggests that selling pressure reached extremes and a bottom may be close. There was a capitulation setup in early April. Second, short-term thrust indicators mark a sharp recovery after an

Bottoming Process – Capitulation, Short and Medium Term Thrusts, Regime Change Read More »

Equities? Fuhgeddaboudit! Alternative Assets are Leading

Trading is all about the odds. Trade when the odds are in your favor. Exercise patience and stand aside when the odds are NOT in your favor. Stocks are in a bear market and the vast majority of names are trading below their 200-day SMAs. Clearly, the odds are NOT in our favor for equities and equity ETFs. Traders need to look elsewhere. Today’s report will highlight some non-equity leaders and analyze Bitcoin as it sets up.

Equities? Fuhgeddaboudit! Alternative Assets are Leading Read More »

Performance Profile Paints Different Pictures for Commodity and Equity ETFs

The performance profile for 2025 says a lot about the state of the market. Commodity-related ETFs are leading, non-cyclical equity ETFs are holding up the best and cyclical names are performing the worst. Clearly, this is not a positive picture for the stock market. This report will show how to interpret the performance profile and separate the leaders from the laggards using a ChartList.

Performance Profile Paints Different Pictures for Commodity and Equity ETFs Read More »

Commodity and Healthcare Related ETFs Lead in 2025 – Bullish Breakout in Biotechs

2025 is off to a rough start for stocks, but there are still some pockets of strength in the market. Year-to-date, SPY is down 1.73%, QQQ is down around 4% and the S&P SmallCap 600 SPDR (IJR) is down over 6%. ETFs with smaller losses show relative strength (less weakness), but ETFs with year-to-date gains show relative

Commodity and Healthcare Related ETFs Lead in 2025 – Bullish Breakout in Biotechs Read More »

Small-caps Trigger Bearish, but Large-caps Hold Uptrend and Present an Opportunity

The Russell 2000 ETF triggered a bearish trend signal this week and continues to underperform S&P 500 SPDR, which remains with a bullish trend signal. Today’s report shows the Keltner Channel signals in each. SPY is currently correcting within an uptrend and pullbacks within uptrends are opportunities

Small-caps Trigger Bearish, but Large-caps Hold Uptrend and Present an Opportunity Read More »

Stash that Flash Right in the Trash – 3 Prerequisites for Chartists – SPY Bullish Pattern

The news cycle is in high gear lately, leading to some extra volatility. Traders reacting to the news are getting whipsawed, while chartists remain focused on what really matters. Price. Price isn’t everything, it is the only thing. News, rumors, fundamentals, the Fed, government policy and

Stash that Flash Right in the Trash – 3 Prerequisites for Chartists – SPY Bullish Pattern Read More »

Cybersecurity Makes Yet Another Statement

The Cybersecurity ETF (CIBR) has been leading the market for a solid four months and recorded yet another new high this week. Chartists looking to take advantage of this leadership can use two timeframes: one to establish the absolute and relative trends, and another to identify tradable pullbacks along the way. Note that CIBR has been on our radar for four months and was featured in October.

Cybersecurity Makes Yet Another Statement Read More »

Mid-Caps Make a Statement with a Breadth Thrust

Mid-caps show leadership and were the first to trigger a breadth thrust. Stocks surged this week with mid-caps showing the highest participation rate. Chartists can quantify the participation rate and identify breadth thrusts using the percentage of stocks above their 20-day SMAs. We will analyze these indicators for six broad indexes and show the breadth thrust for the S&P MidCap 400

Mid-Caps Make a Statement with a Breadth Thrust Read More »

Market Pullbacks Provide Opportunities to Build your WatchList – Here’s How

The stock market is in pullback mode with the S&P 500 EW ETF down 5.15% over the past month and down 1% year-to-date. This makes it a good time to monitor relative performance and create a relative strength watch list. Stocks and ETFs holding up best during pullbacks often lead when the market regains its footing. Today’s report will show a starter list and analyze the chart for an AI Robotics ETF.

Market Pullbacks Provide Opportunities to Build your WatchList – Here’s How Read More »

How to Trade Erratic Uptrends – An Example and Setup using IWM

The Russell 2000 ETF managed a double digit gain in 2024, but did it the hard way with several deep pullbacks along the way. Pullbacks within uptrends are opportunities and we can find such opportunities using %B. The chart below shows the Russell 2000 ETF (IWM) with the Zigzag(8) indicator. This indicator changes direction when there is a move greater than 8%, which means it ignores price moves that are less than 8%.

How to Trade Erratic Uptrends – An Example and Setup using IWM Read More »

Three Big Negatives Overshadow the Uptrends in SPY and QQQ

SPY and QQQ remain in long-term uptrends, but three big negatives are hanging over the stock market right now. Two negatives are tied to important cyclical groups and the third is reminiscent of summer 2022. This report will analyze the recent breakdown in housing, continued weakness in semiconductors and the big breakout in the 10-yr Treasury Yield.

Three Big Negatives Overshadow the Uptrends in SPY and QQQ Read More »

Scroll to Top