Software and BlockChain ETFs Extends after Breakouts
Stocks Extend on Thrust Signals
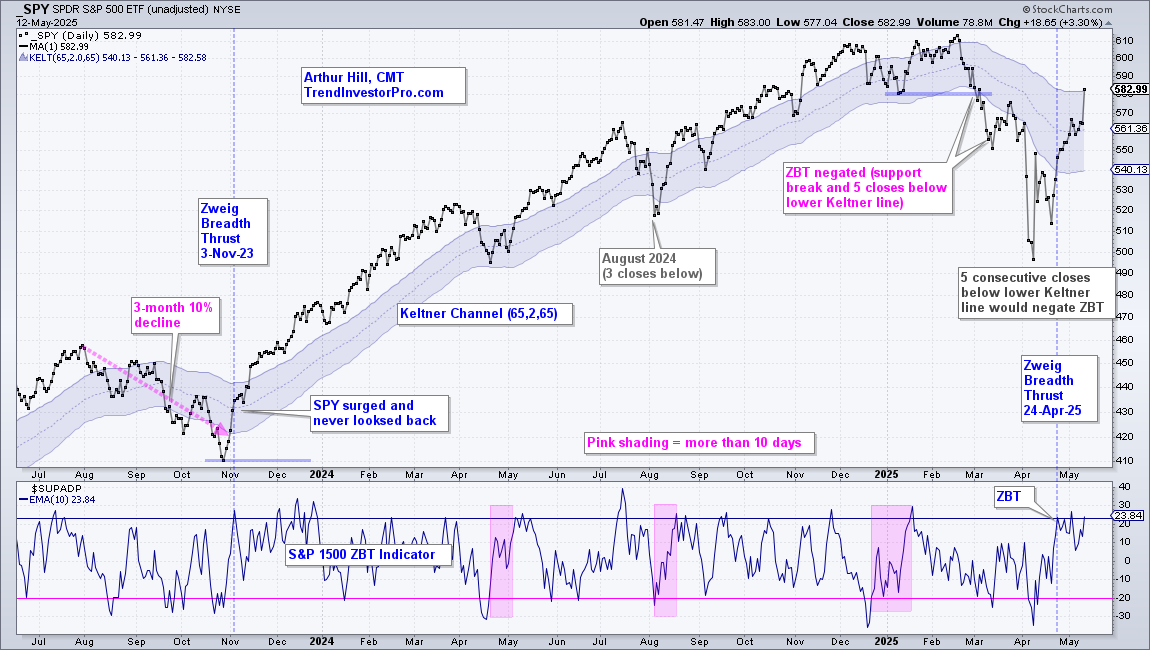
The thrust continued on Monday with SPY surging 3.3% and the percentage of S&P 1500 stocks above their 50-day SMA hitting its highest level since December 2nd. The chart below shows an update for the S&P 1500 Zweig Breadth Thrust strategy. A bullish thrust triggered on April 24th and SPY extended above the upper Keltner line on Monday. There was also a bullish thrust on 3-Nov-2023 and SPY crossed the upper Keltner line on November 14th.
An exit signal triggers when SPY closes below the lower Keltner line for five consecutive days. I require a five day close to reduce whipsaws, such as the one that occurred in early August 2024 (Yen carry-trade fiasco). The lower Keltner line is currently at 540 and will rise should SPY continued to rise. In this manner, it acts as a trailing stop. See this report for details and performance metrics for the Zweig Keltner Strategy.
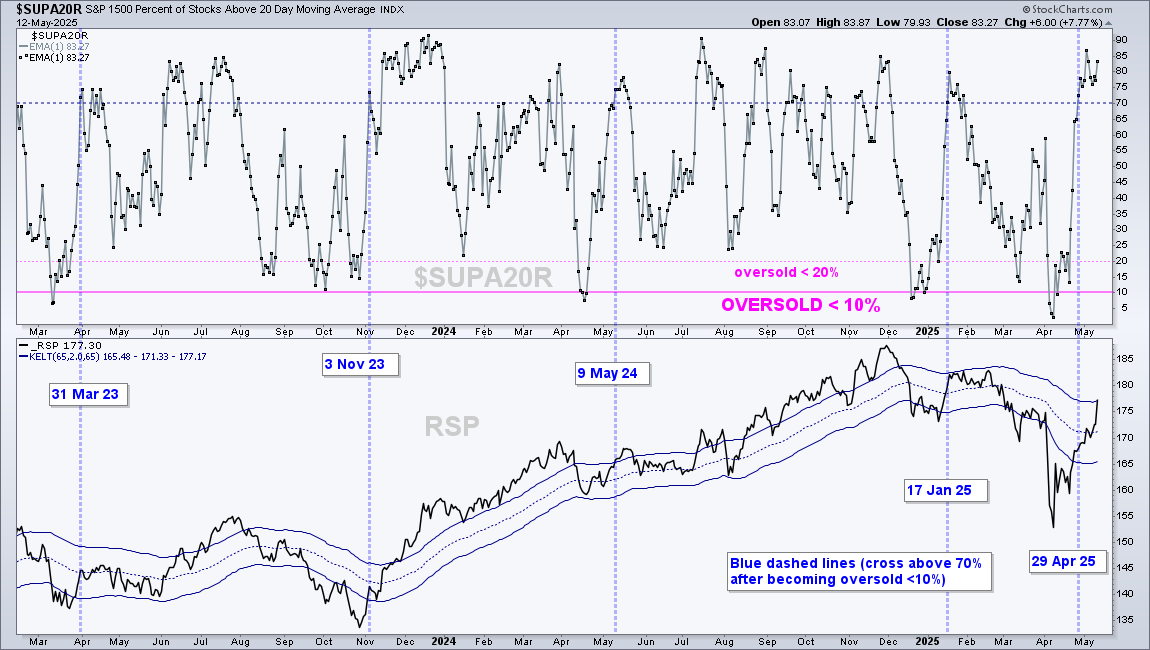
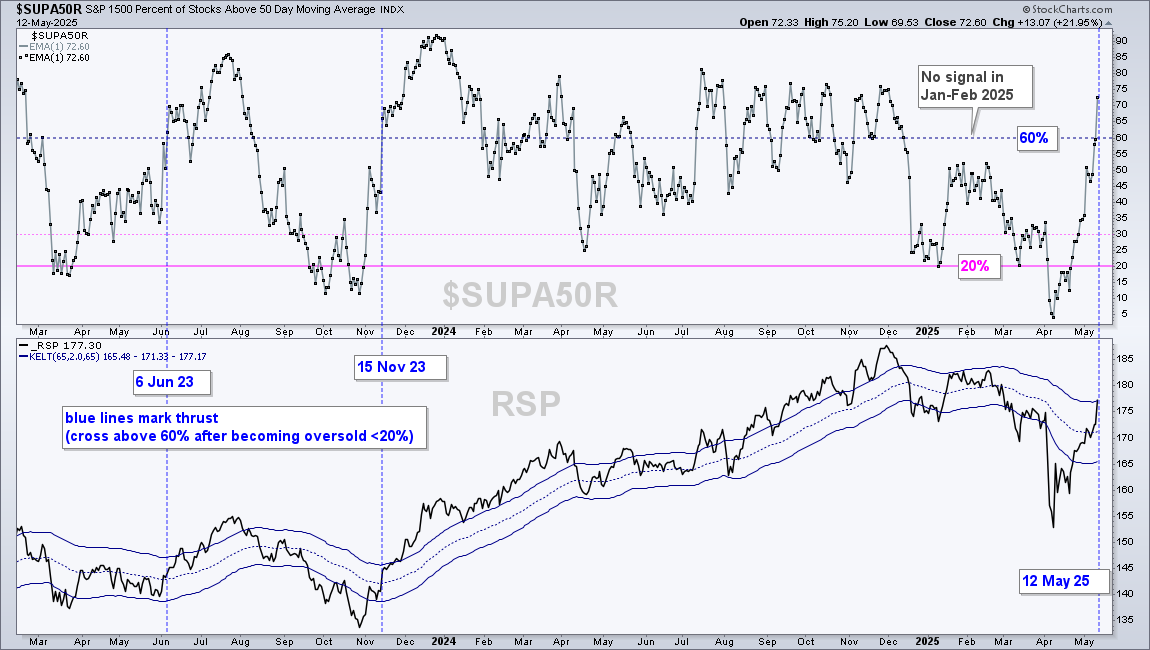
In addition to the ZBT, S&P 1500 %Above 20-day SMA ($SUPA20R) surged above 70% on April 29th for a thrust signal and S&P 1500 %Above 50-day SMA ($SUPA50R) surged above 60% on May 12th. See this report for more on these signals.
Long-term Breadth Indicators Remain Net Bearish
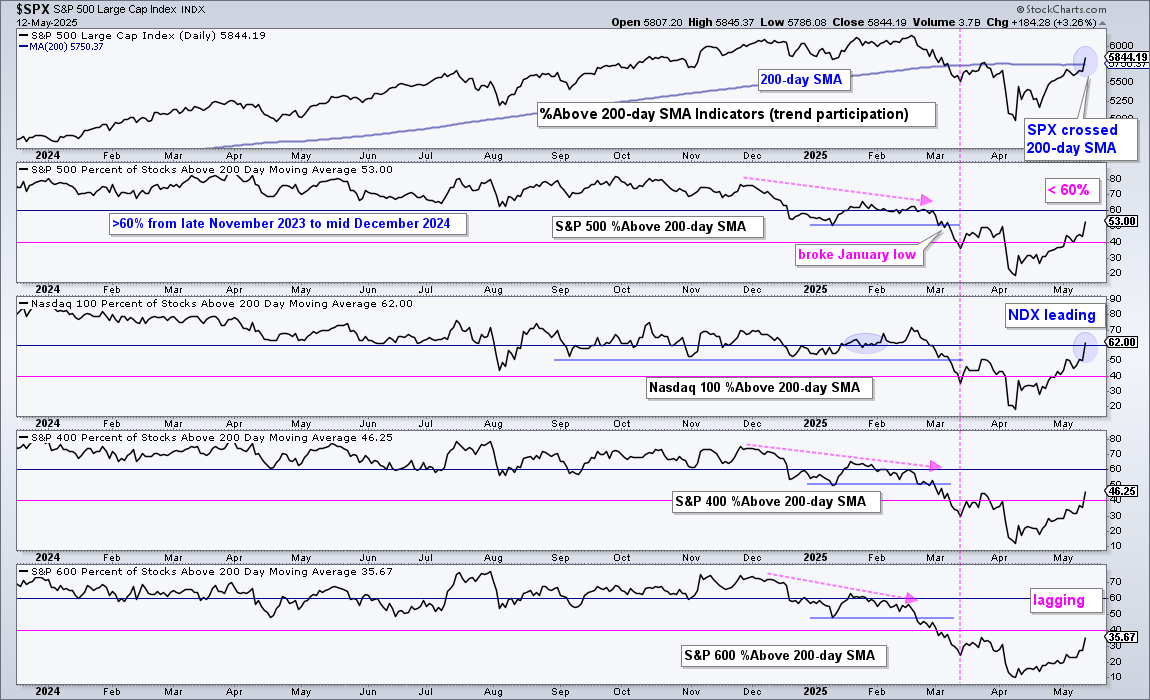
Despite these thrust signals and big moves, the long-term trends and breadth indicators remain bearish. The chart below shows the S&P 500 with the %Above 200-day SMA indicators for the S&P 500, Nasdaq 100, S&P MidCap 400 and S&P SmallCap 600. The S&P 500 crossed above its 200-day SMA with Monday’s close (blue circle). NDX %Above 200-day crossed above 60% and is the leading index. SPX %Above 200-day is at 53% and needs to cross above 60% for a long-term bullish signal. Mid-cap and small-cap stocks are lagging the S&P 500 and Nasdaq 100 stocks. It is still a large-cap world out there.
Mind the Gaps
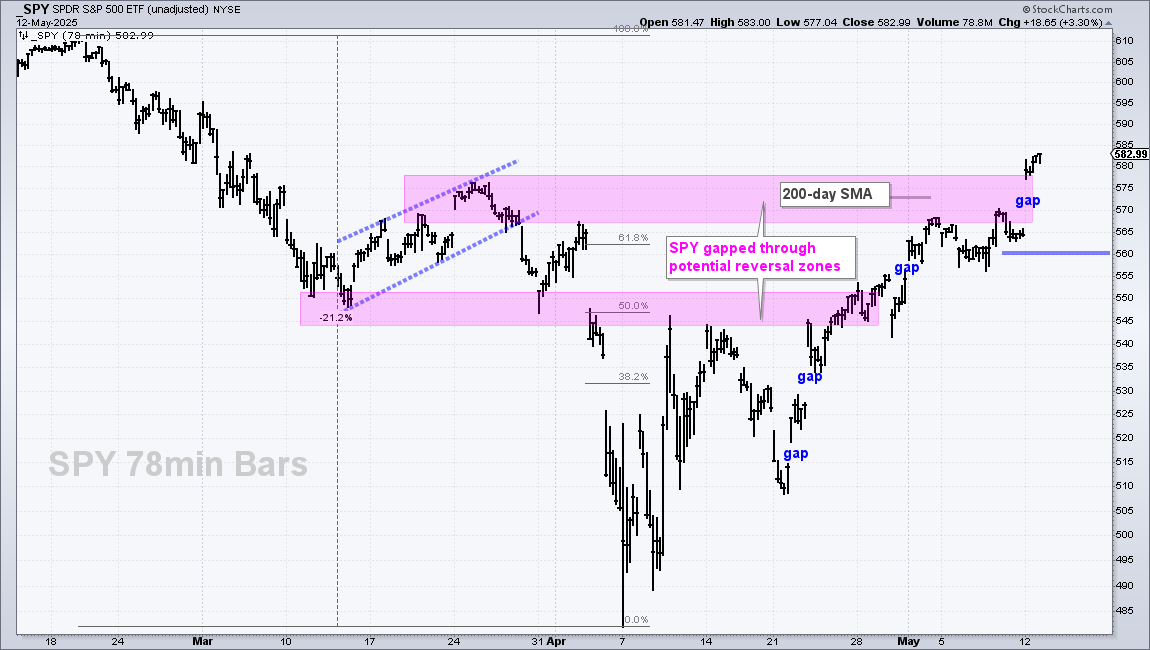
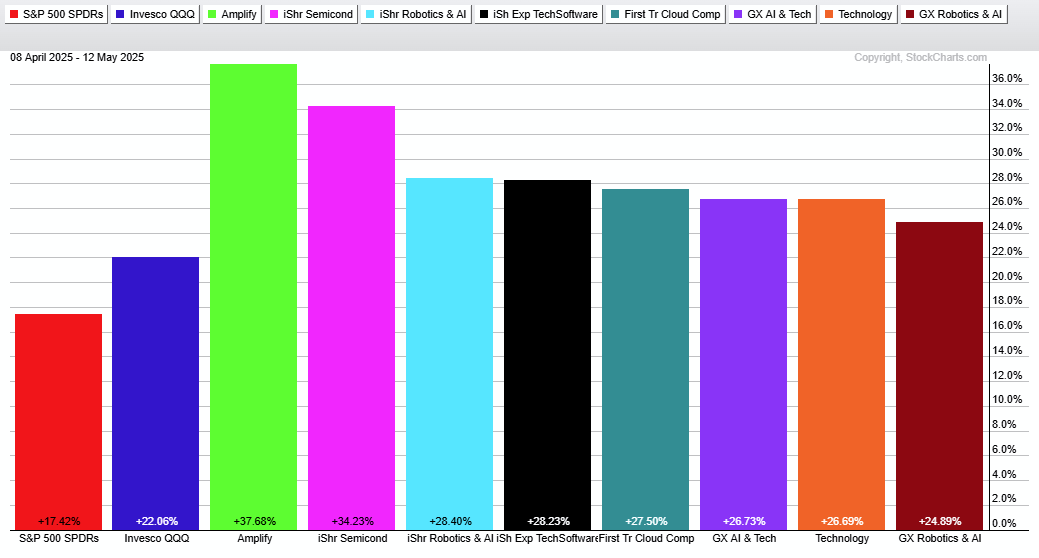
As noted in Friday’s report, we are currently in the V portion of a V-Reversal as stocks plunged on tariff fears and surged on tariff hopes. It is almost as if this tariff stuff never happened because SPY and QQQ are back near their early March levels. SPY is up 17% the last 23 days and QQQ is up 22%. These monster moves are comparable to the surges off the March 2020 lows. The 78min chart below shows four gaps since April 22nd and each gap held. Gaps reflect strong pent-up demand and the ability to hold a gap shows continued buying pressure. A move below 560 would fill the current gap.
SPY and QQQ Negate March Support Breaks
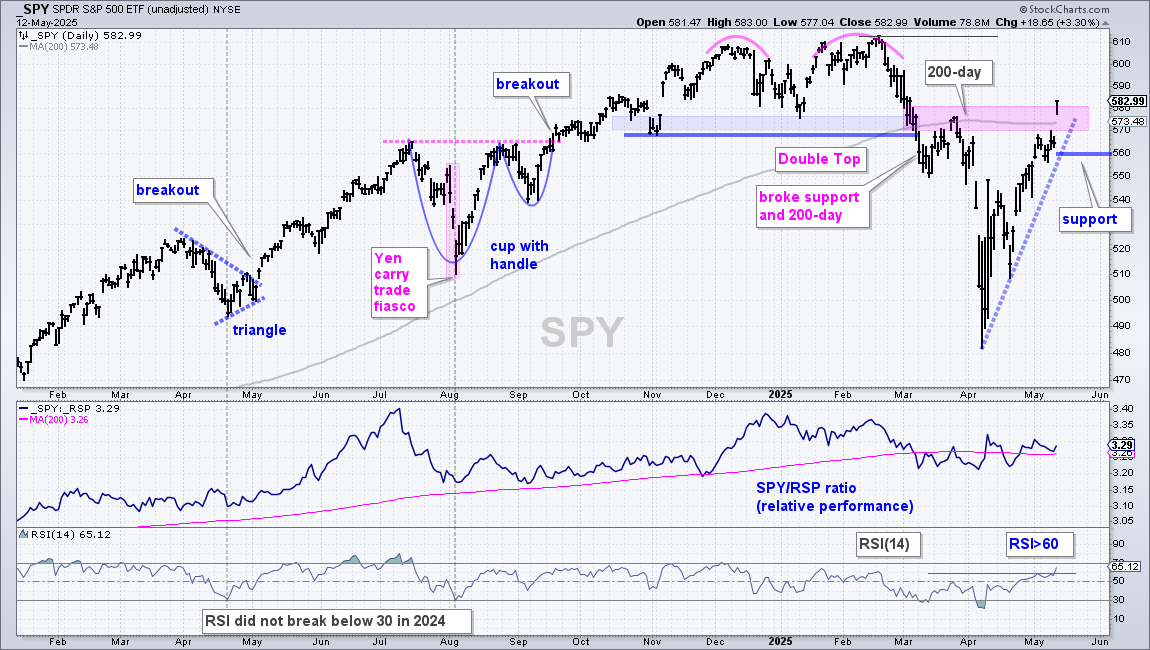
With the surge above 580, SPY negated the Double Top support break in the 570-580 area. The ETF also closed above the 200-day SMA and the late March high. SPY is quite overbought short-term, but returning to bull form as long as it holds the 200-day and the gap. A close below 560 would fill the gap and put SPY back below the 200-day SMA. At the very least, such a move would argue for a pullback that could lead to a bullish setup.
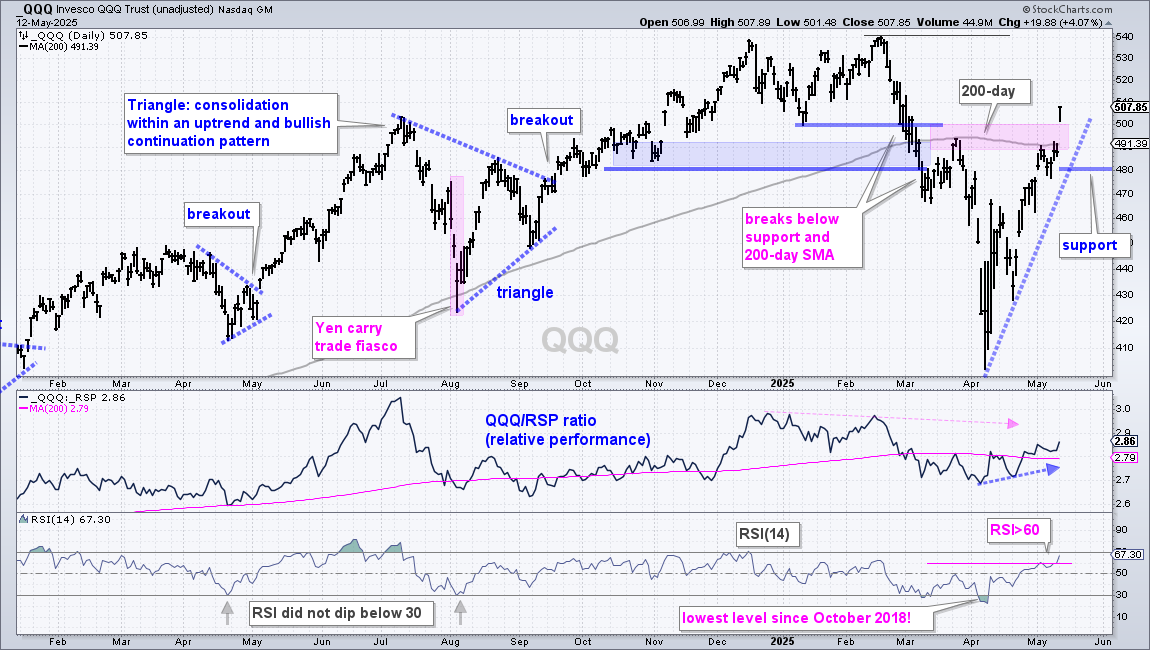
QQQ is keeping pace with SPY as it too negated the prior support break with a gap-surge above 500. QQQ is returning to bull form as long as the 200-day SMA and gap-surge hold. A close below 480 would break the 200-day SMA and fill the gap. This could lead to a tradable pullback.
A Tale of Two Periods (Defensive vs Offensive)
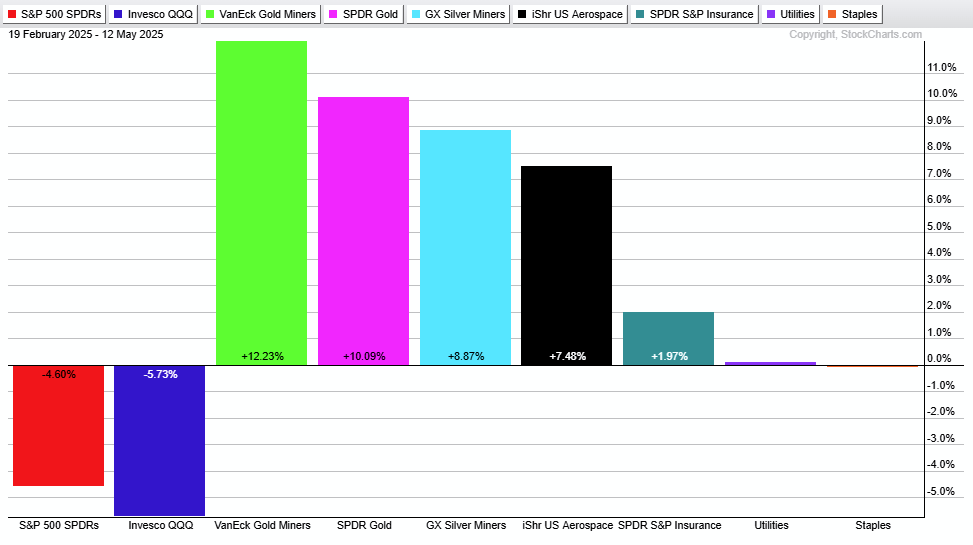
There are two important periods in the stock market. First, there is the February high and performance since this high (57 days). SPY and QQQ are down 4.6% and 5.7% the last 57 days, respectively. The performance leaders are the Gold Miners ETF (GDX), Gold SPDR (GLD), Silver Miners ETF (SIL), Aerospace & Defense ETF (ITA) and Insurance ETF (KIE). The Consumer Staples SPDR (XLP) and Utilities SPDR (XLU) are largely flat.
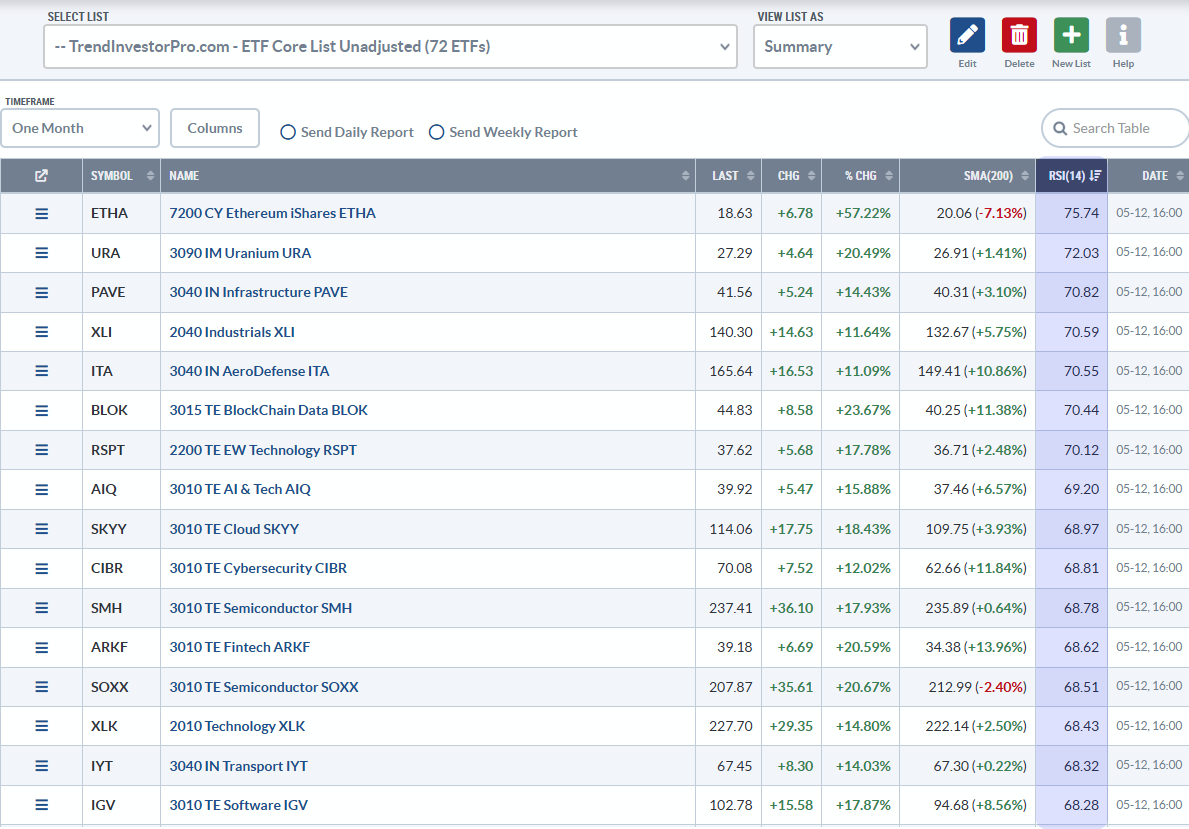
The second period is marked by the April low and performance since this low. Here we see a completely different leadership group. The Transformational Data Sharing ETF (BLOK) and Semiconductor ETF (SOXX) are up more than 30%. We are also seeing short-term leadership from the Robotics AI ETF (ARTY), Software ETF (IGV), Cloud Computing ETF (SKYY) and other tech related ETFs (AIQ, XLK, BOTZ).
Big Moves in Tech-Related ETFs
Overbought is a sign of strength because it takes strong buying pressure to push prices to overbought levels. This can be longer-term bullish (3-6 months), but short-term negative because it increases the odds for a pullback or consolidation. Using QQQ as an example, RSI(14) reached 23.32 on April 8th and surged to 67.32 over the last 23 days (+44).
Currently, QQQ and most tech-related ETFs are leading the last five weeks, but short-term overbought after big moves. Most RSI(14) values are in the upper 60s. This increases the chances for a correction, which can involve a pullback or consolidation. An RSI(14) dip into the 40 area would show a modestly oversold condition that could lead to a bounce. As the charts below show, the 23 day surges are impressive, especially after Monday’s gap-gain. Tactically, the short-term overbought conditions make it prudent to wait for a tradable pullback.
Price-relatives Turning up (XLK, MAGS)
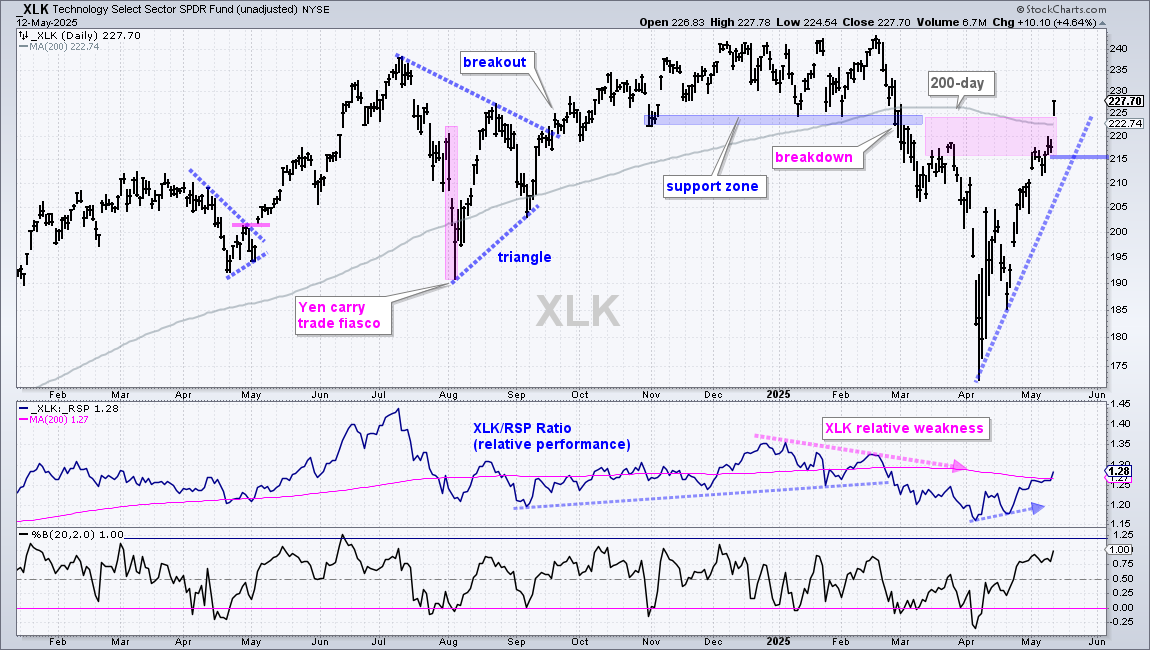
The chart below shows the Technology SPDR (XLK) surging above its 200-day SMA and negating the early March support break. As with QQQ, XLK gapped up on Monday and this gap holds the first key. A close below 215 would fill the gap and break the 200-day SMA. The indicator window shows the price-relative (XLK/RSP ratio) falling from January to March and then turning up in April. This relative performance line broke the 200-day SMA on Monday as relative performance improved.
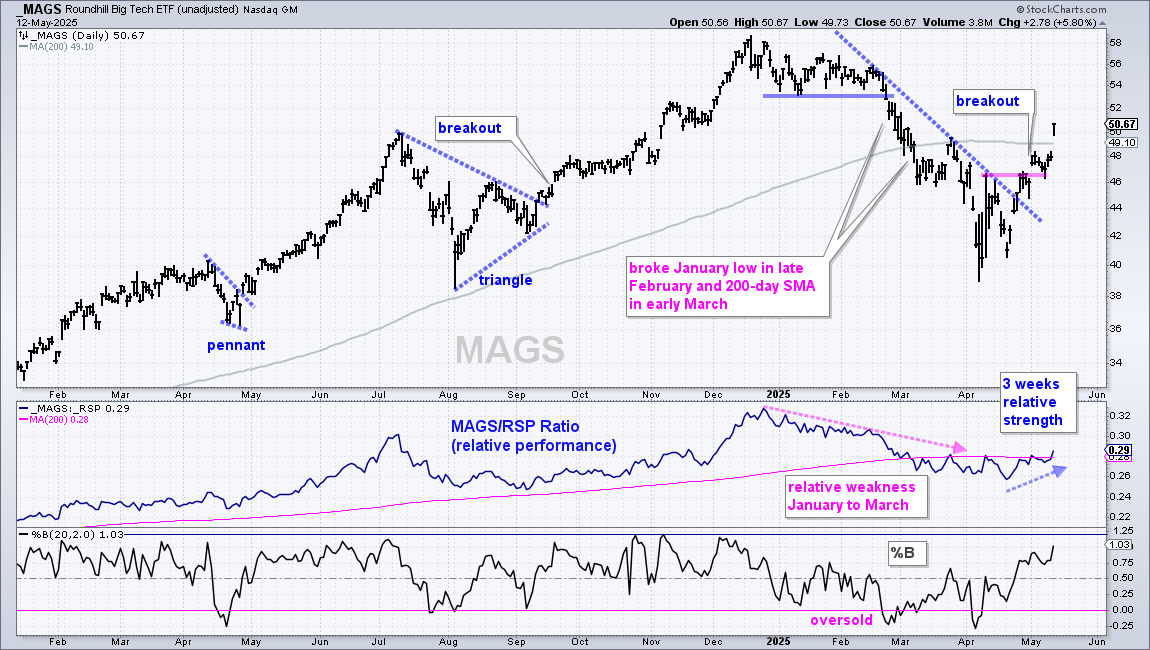
The next chart shows the Mag7 ETF (MAGS) breaking the February trendline in late April and the April highs in early May. MAGS continued higher on Monday with a gap-surge above the 200-day SMA. The ETF also exceeded its late March high. The indicator window shows the price-relative falling from January to mid April and turning up the last three weeks. This relative performance ratio exceeded its April highs and 200-day SMA, which means MAGS is starting to outperform again.
Semiconductor ETF Recaptures 200-day SMA
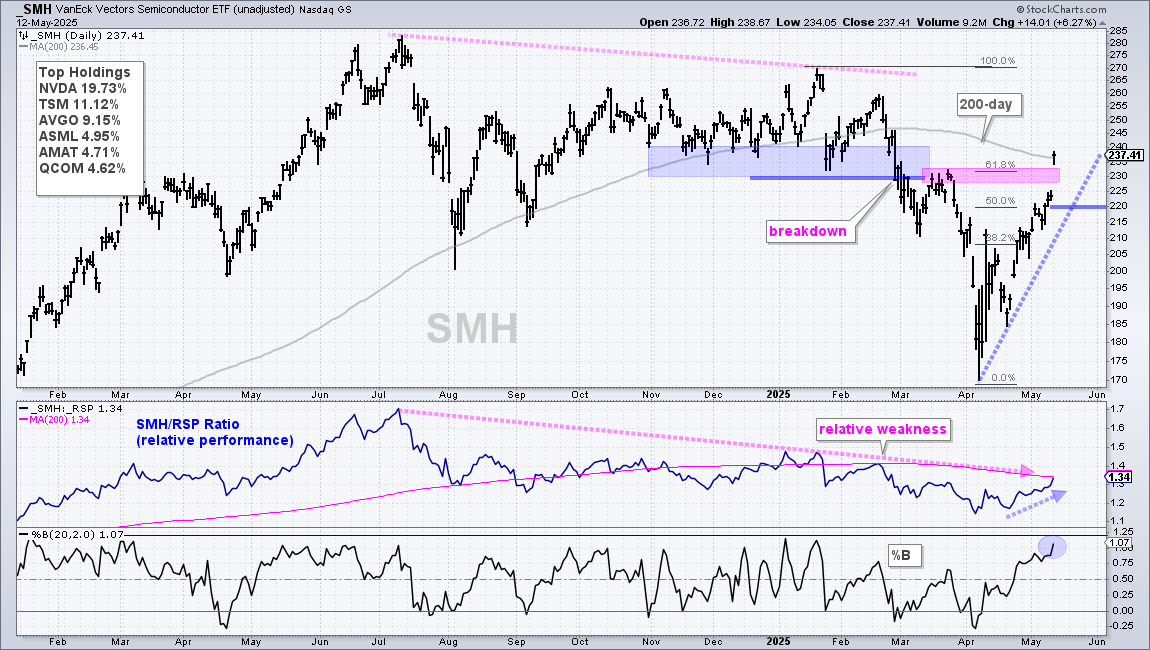
The next chart shows the Semiconductor ETF (SMH) closing above its 200-day SMA for the first time since mid February. SMH also exceeded its 61.8% retracement and late March high. As with most tech-related ETFs, SMH is short-term overbought after a 13.8% advance in 23 days. Also notice that %B(20,2) is above 1, which means the close was above the upper Bollinger Band. This also confirms short-term overbought conditions. The middle window shows the price-relative turning up the last few weeks and nearing its 200-day SMA.
Software and BlockChain ETFs Extend after Breakouts
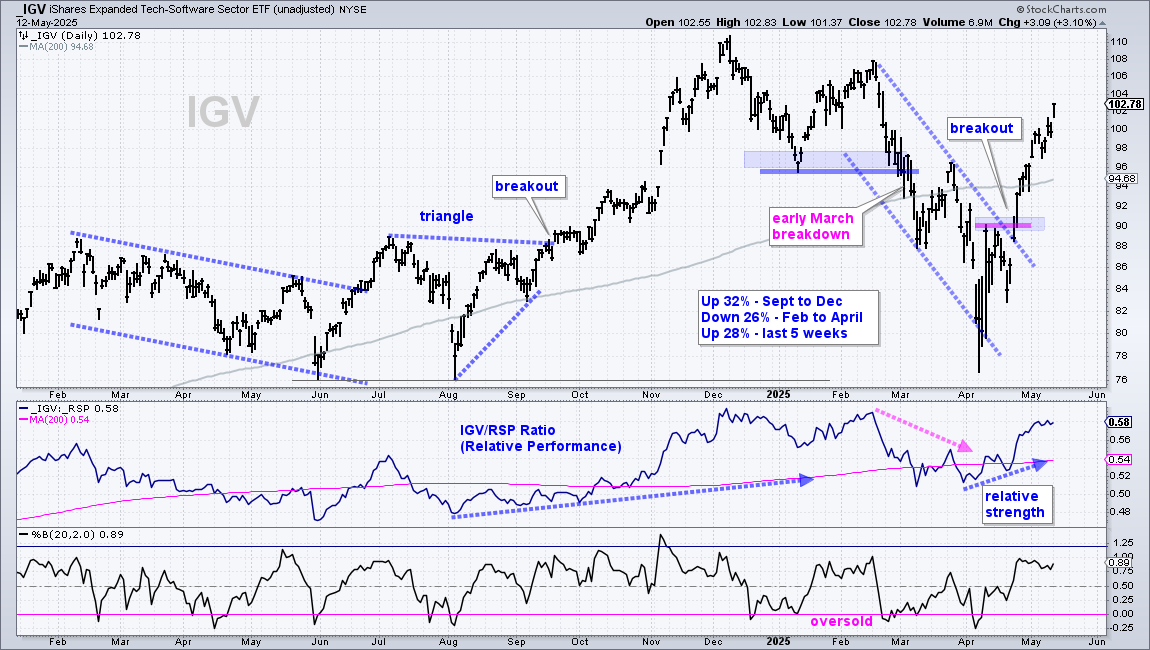
The next chart shows the Software ETF (IGV) with a plunge in early April, a recovery into mid April and a breakout in late April. IGV continued above the 200-day SMA and exceeded the mid March high. This exceptionally strong breakout created a short-term overbought condition because IGV is up 28% in 23 days. The middle window shows the price-relative turning up in April as IGV outperforms the last five weeks.
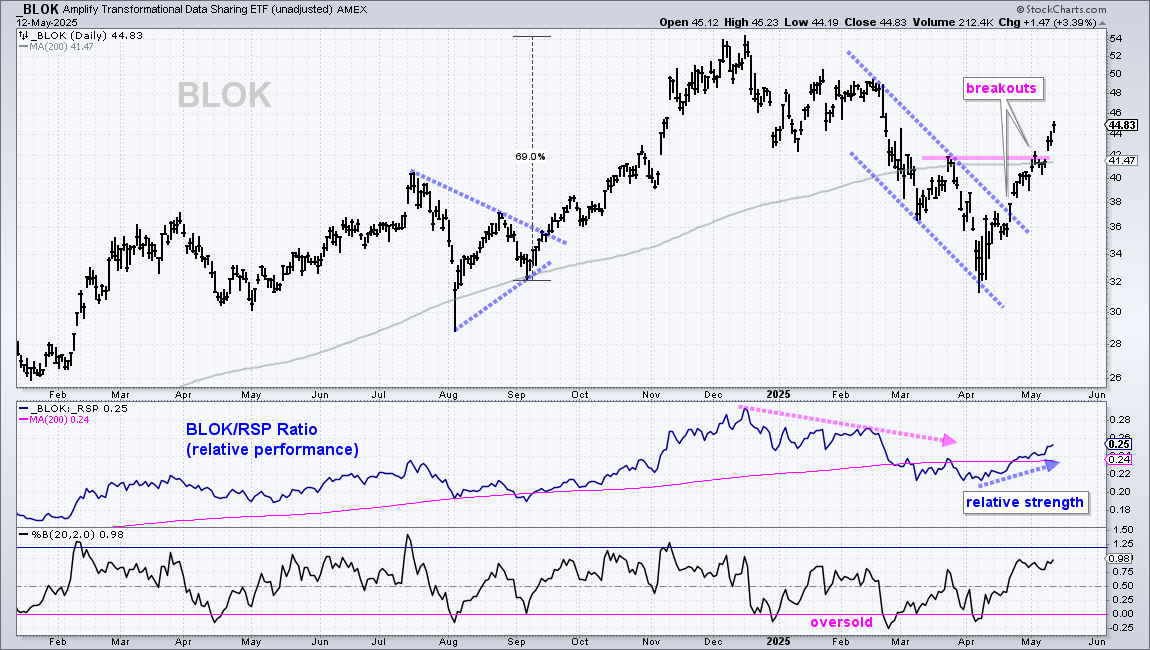
The next chart shows the Transformational Data Sharing ETF (BLOK) with a channel line breakout in late April and follow through surge above the 200-day SMA, and the late March high. The middle window shows the price-relative falling from mid December to early April and turning up the last four weeks as BLOK outperforms.
Send feedback to support(at)trendinvestorpro.com or use the contact form.