Can’t Predict a Pullback (Oversold Indicators Revisited)
QQQ Extends on Triangle Breakout (Plus XLK, MAGS)
Semiconductor ETF Advances within Rising Wedge
Robotics & Artificial Intelligence ETF Breaks to New Highs
Taiwan Semi Pulls Back after Earning Surge
Broadcom Tests Breakout Zone
META Corrects back to Breakout Zone
VRTX Renews Breakout with Second Surge
Freeport Triggers a Breakout
Commodity Related ETFs with Setups (CPER, DBB, COPX, DBA)
GLD becomes Moderately Oversold
TLT Extends Downtrend
Bitcoin Surges to New High
The next Weekly Report will be posted on Friday morning, November 15th.
Market is Looking Ahead to 2025
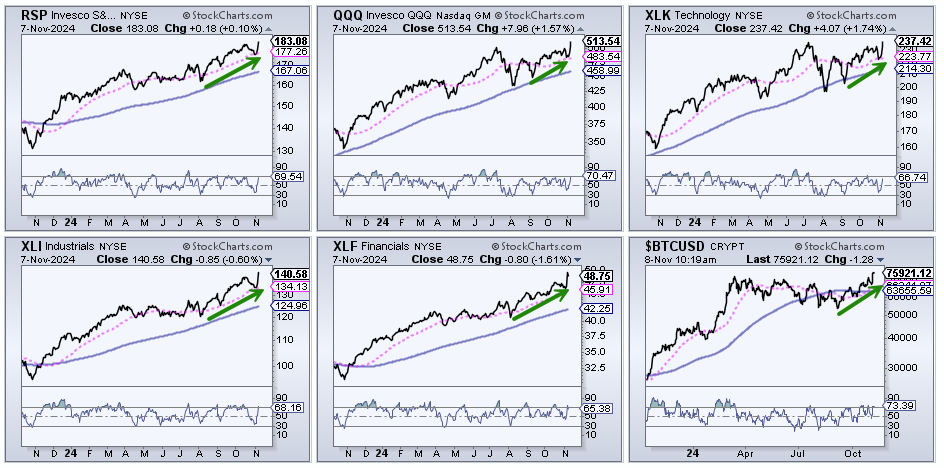
Stocks made a move with nice gains on Tuesday and then surged on Wednesday with even bigger advances. These advances simply extended trends and breakouts that were already in place. SPY, QQQ and the tech-related ETFs broke out in mid-late September, moved higher in October and extended these gains into early November.
Bitcoin and stocks associated with the Trump trade moved higher in October and extended their gains after the election. The market is a forward-looking beast that reflects future fundamentals with current price action. While nobody can really forecast the future, we can look at the odds and make educated guesses. My next educated guess is that there will be more deregulation and more tax cuts in 2025. I will not weigh in on deficits, tariffs, interest rates or inflation because these issues are simply too complicated.
Keep in mind that all information is reflected in the price charts and the markets are looking forward, not backward. Follow the message on the charts. Stocks are clearly in bull mode right now with the major index ETFs hitting new highs on strong breadth. Yield spreads narrowed further with the BBB spread hitting a new low. Tech stocks are back as QQQ, XLK and several tech-related ETFs hit new highs.
S&P 500 Breadth Reflects Broad Strength
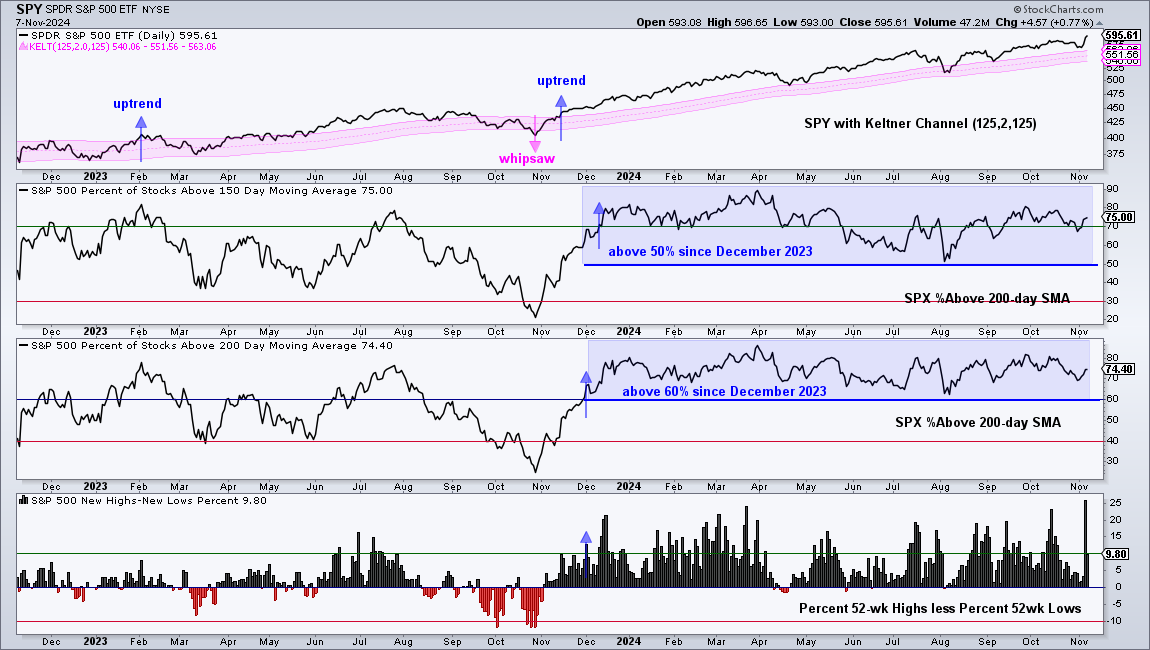
The chart below shows SPY with the Keltner Channels (125,2,125). The middle line is a 125-day EMA and the outer lines are 2 ATR(125) values above and below. An uptrend starts with a break above the upper line and remains until a break below the lower line. There was a whipsaw in late October 2023 and then an uptrend signal in mid November 2023. The long-term trend is clearly up here.
The indicator windows show %Above 150-day SMA, %Above 200-day SMA and High-Low Percent for S&P 500 stocks (High-Low% = % 52wk highs – % 52wk Lows). Over 70% of S&P 500 stocks are above their 150 and 200 days SMAs. This means the vast majority of stocks are in long-term uptrends and this supports a bull market. The bottom window shows High-Low Percent surging to 25% on Wednesday and hitting its highest level since May 2021. Basically, 25% of stocks in the S&P 500 hit new highs and this shows broad strength. This indicator first moved above 10% on December 1st and has regularly punched above the 10% level this year.
QQQ Breadth is Strong Enough
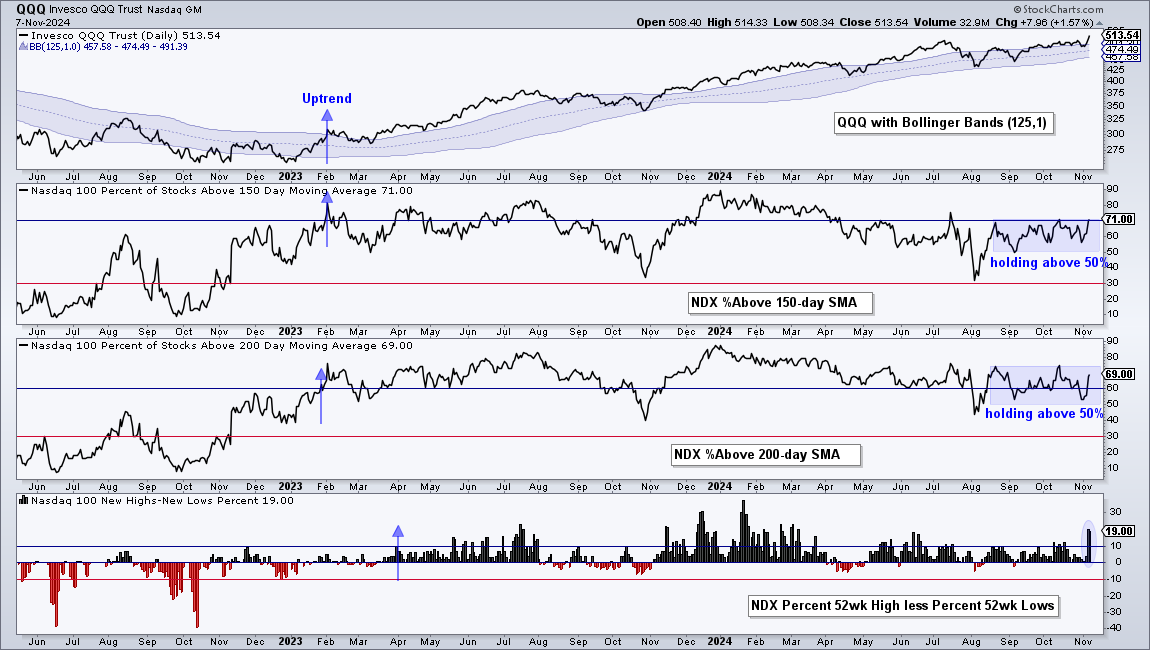
The next chart shows QQQ with Bollinger Bands (125,1). This middle line is a 125-day SMA and the outer bands are 1 standard deviation above and below. An uptrend starts with a move above the upper band and remains until a move below the lower band. QQQ kicked off an uptrend with a breakout in February 2023 and has remained in an uptrend since then.
In the indicator windows, we can see NDX %Above 150-day SMA plunging into early August and recovering into September. It has held above 50% the last two months and is currently at 70%. Strong enough. NDX %Above 200-day SMA dipped below 50% in early August, but quickly recovered and has held above 50% since this recovery. It is currently at 68% and strong enough to support a bull market for QQQ. The bottom window shows High-Low Percent surging to 20% on Wednesday, the highest level since March. This means 20% of Nasdaq 100 stocks hit new highs and this is also very bullish.
BBB Spread Falls to New Lows (Narrows)
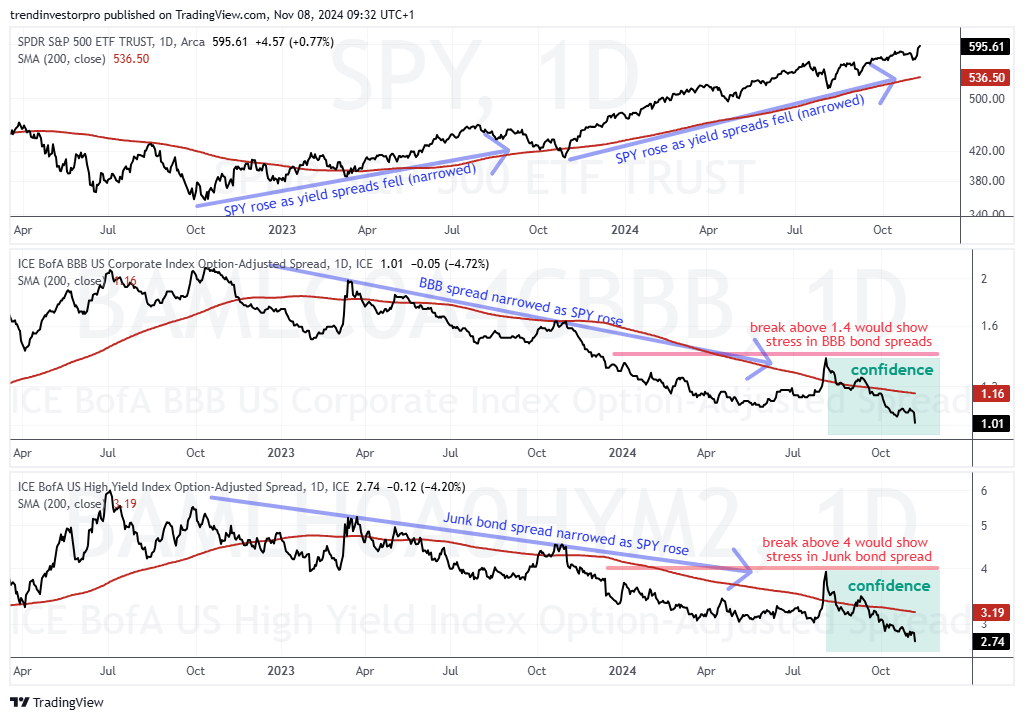
There is no change in the yield spread charts. The BBB and Junk bond spreads fell to new lows again in November and show confidence in the corporate bond market. This is bullish for stocks. Confidence in the credit markets is also reflected in the Finance SPDR (XLF), which is one of the strongest sectors right now.
These spreads show the difference between a corporate bond yield (BBB) and the equivalent US Treasury bond yield. BBB bonds are the lowest rated investment grade bonds. US Treasuries are the ultimate safe-haven bonds. The spread between these two widens (rises) when stress builds in the corporate bond market. This is negative for stocks. The spread narrows (falls) when stress levels are low or subsiding. This is positive for stocks.
Can't Predict a Pullback
Predicting the start, the length and the duration of a pullback is very difficult, if not impossible. I am talking about a pullback within an uptrend. The long-term uptrend is the dominant force and it can overrule the pullback at anytime. Pullbacks within uptrends present opportunities, but we cannot really anticipate these opportunities, try as I may.
In an effort to anticipate a pullback, theory suggests that chartists can use overbought conditions, short-term support breaks, momentum divergences, breadth divergences and seasonal patterns. More often than not, anticipation is futile. Admittedly, I am sometimes guilty of this anticipation.
I tried to anticipate a pullback in October because of seasonal patterns, but we never got one. I tried to anticipate a pullback based on short-term support breaks last week, but stocks immediately firmed and surged the last two days. The bigger trends overruled the pullback after just one day. Anticipation can lead to missed opportunities.
Instead of anticipating, it is often better to simply wait for an oversold condition or a chart setup. We never know when they will present themselves, we just need to have some patience. The chances of catching an oversold bounce are higher than the chances of predicting a pullback. The challenge with oversold conditions is twofold. defining oversold levels and timing the bounce.
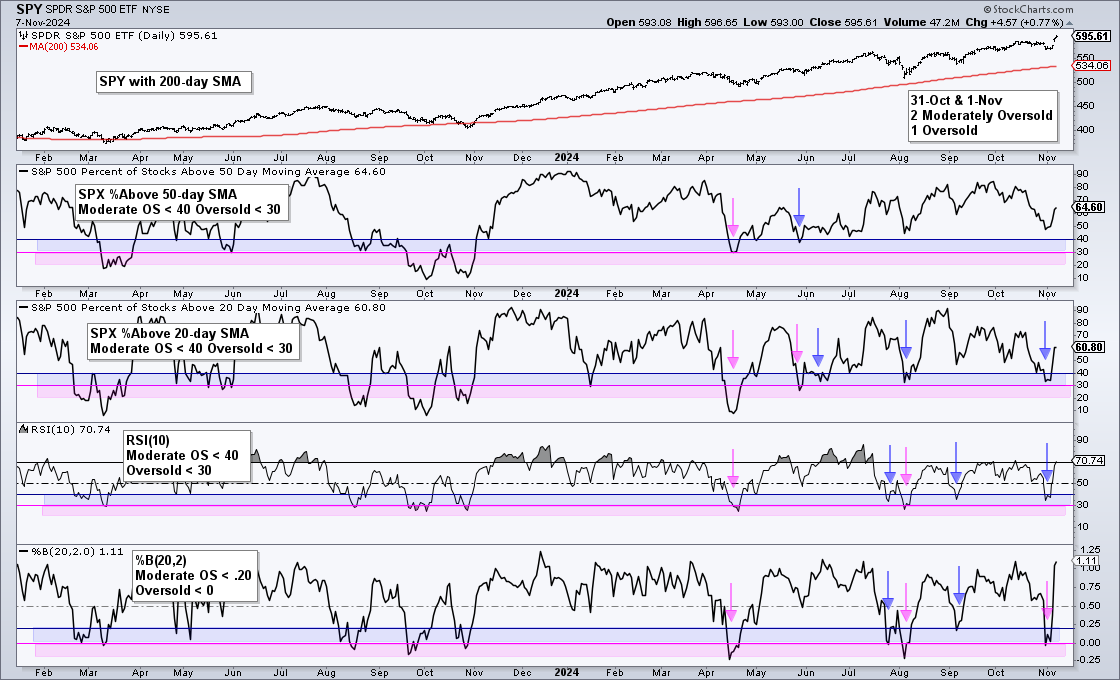
The next chart shows SPY with two short-term breadth indicators and two momentum oscillators to identify oversold conditions within a bigger uptrend. These are SPX %Above 50-day SMA, $SPX %Above 20-day SMA, RSI(10) and %B(20,2). There are different degrees for oversold conditions. To keep in simple, I will use two: moderately oversold (blue shading) and oversold (pink shading).
Sometimes we get real oversold conditions, such as in April when all four indicators were oversold (pink arrows). Sometimes we just get moderately oversold conditions (blue arrows) and sometimes we get a combination. Most recently, SPX %Above 20-day and RSI(10) were moderately oversold late last week (blue arrows), and %B was oversold (pink arrow).
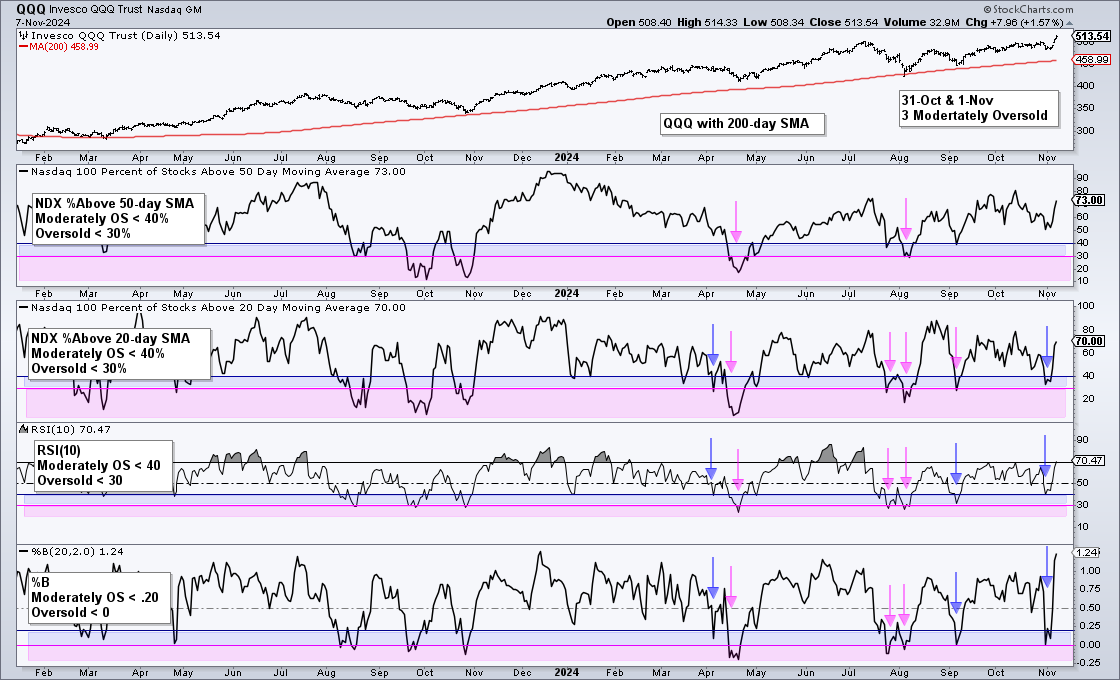
The next chart shows QQQ with the same indicators. Three of the four were moderately oversold late last week. NDX %Above 20-day dipped below 40%, RSI dipped below 30 and %B dipped below .20 (blue arrows).
SPY Surges to a New High
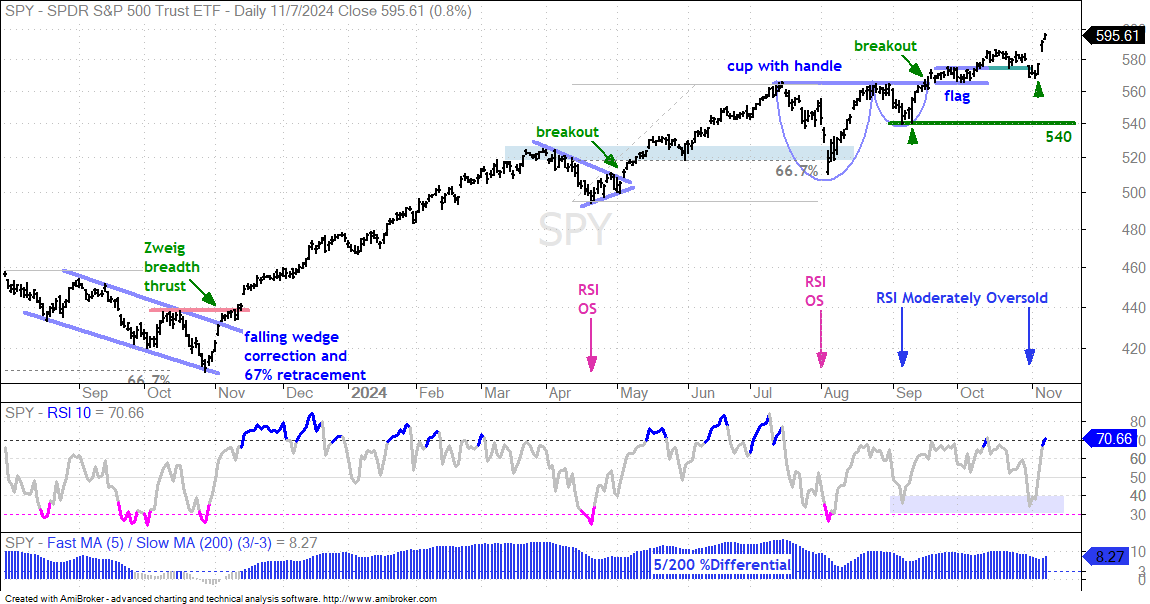
SPY is in a long-term uptrend as the ETF hit another new high this week. Overall, the 5/200 %Differential has been bullish for over a year and SPY broke rim resistance of a cup-with-handle pattern on September 19th. I do not see a tradable pattern or oversold condition on the chart right now. SPY is simply in a confirmed uptrend.
Now let’s look at timing the oversold bounces. Sometimes we get a pattern, such as the triangle into early May. This means we can use the breakout to time the bounce. RSI was oversold in mid April and got a breakout in early May. RSI became oversold again in early August, but there was no pattern at work. Without a pattern, we can look for RSI to break above 50 to show an upturn in momentum.
The blue arrows show the modestly oversold readings in early September and late October. There was no pattern at work, but we saw SPY surged on 11-Sept and 5-Nov. Also note that the short-term support break on 31-Oct did not lead to a pullback. Instead, RSI became moderately oversold. RSI then moved above 50 on Monday.
QQQ Extends on Triangle Breakout (Plus XLK, MAGS)
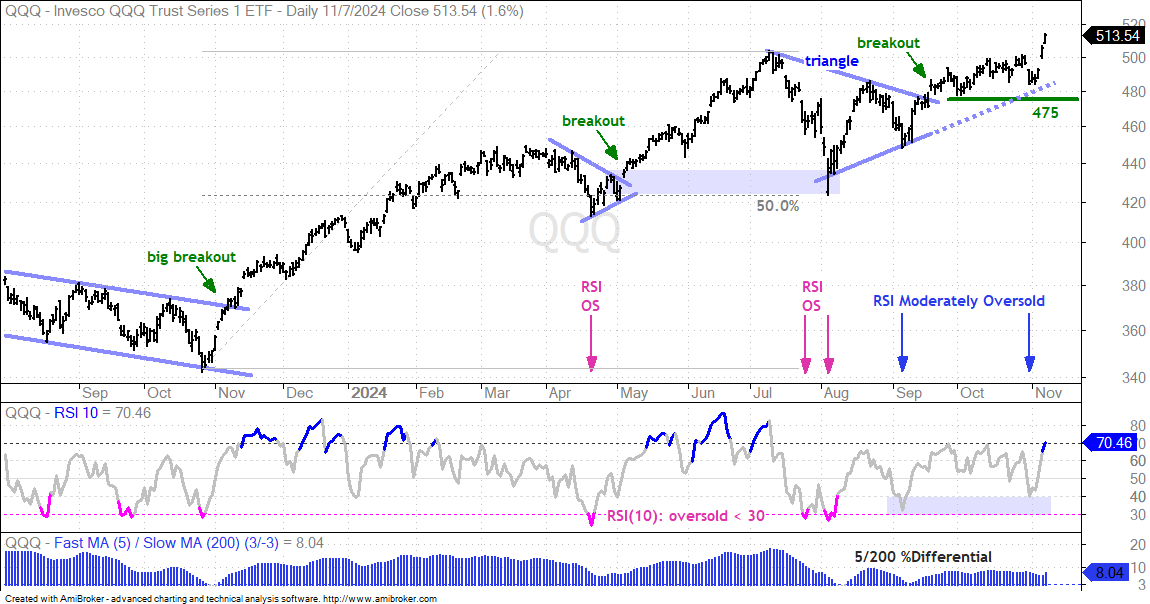
QQQ broke triangle resistance with a surge on September 19th, worked its way higher into late October and surged to a new high this week. Triangles are bullish continuation patterns that represent consolidations within the trend. This pattern formed within a long-term uptrend and the breakout signaled a continuation of this uptrend. I am marking re-evaluation support at 475. This week’s new high simply affirms the ongoing uptrend and there is no setup on this chart right now.
The pink arrows mark short-term oversold conditions for RSI and the blue arrows mark moderately oversold conditions. These setups are similar to what we saw in SPY. QQQ got a triangle breakout in early May. RSI became oversold in late July and early August, and then surged above 60 to signal an upturn in momentum. Most recently, RSI dipped to 39.87 on 31-Oct and surged above 50 on 5-Nov.
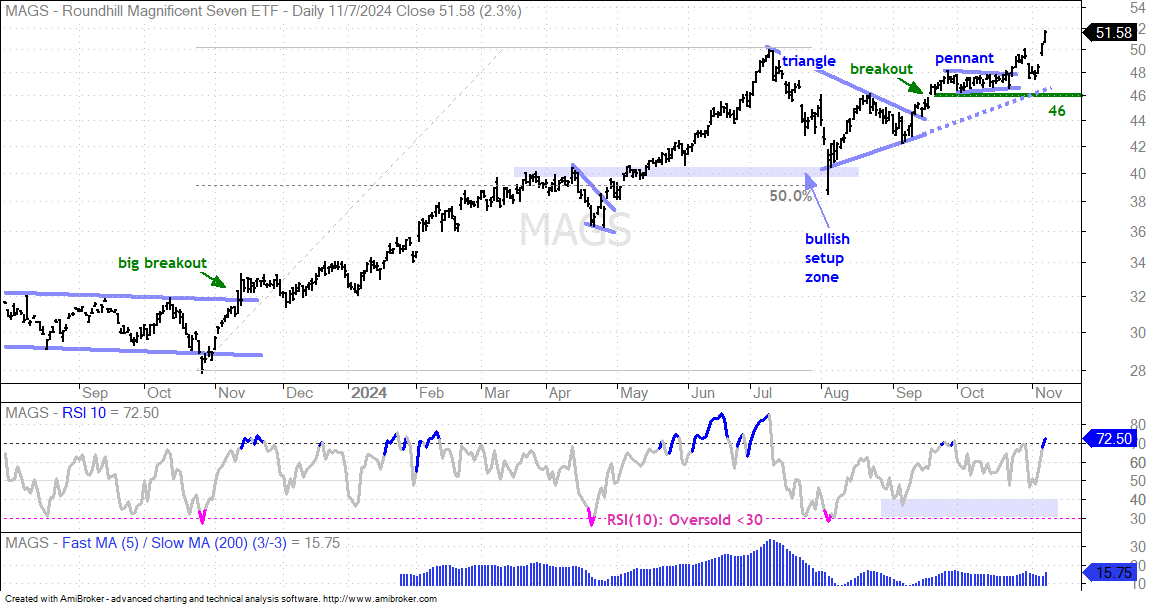
The next chart shows the Mag7 ETF (MAGS) surging to a new high and re-evaluation support marked at 46.
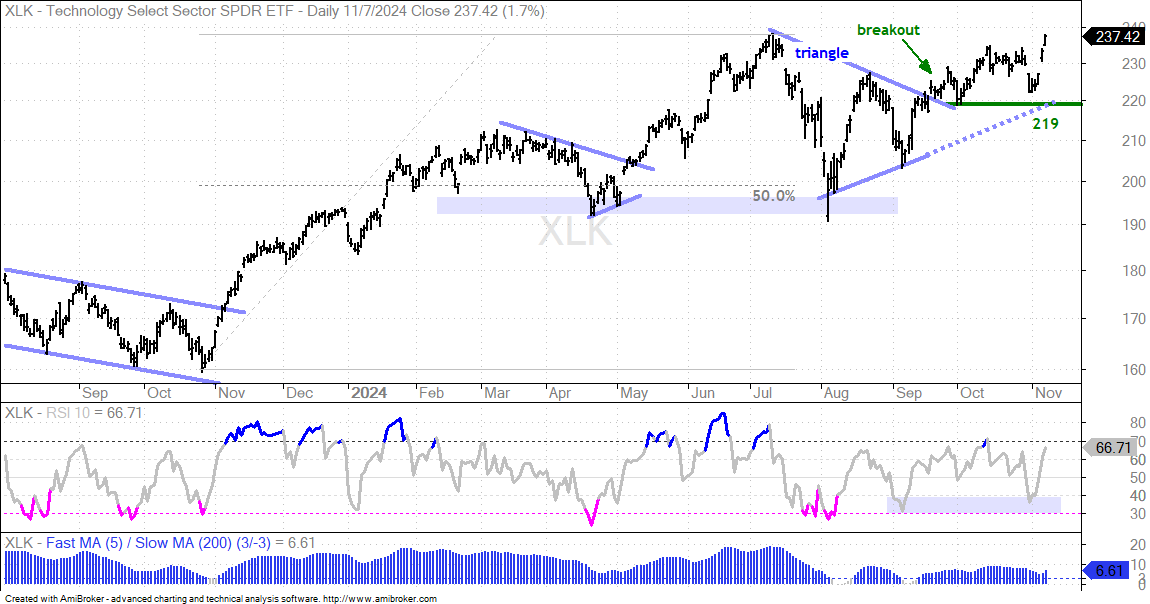
The next chart shows the Technology SPDR (XLK) with similar characteristics and re-evaluation support marked a 219.
Semiconductor ETF Surges to Confirm Support
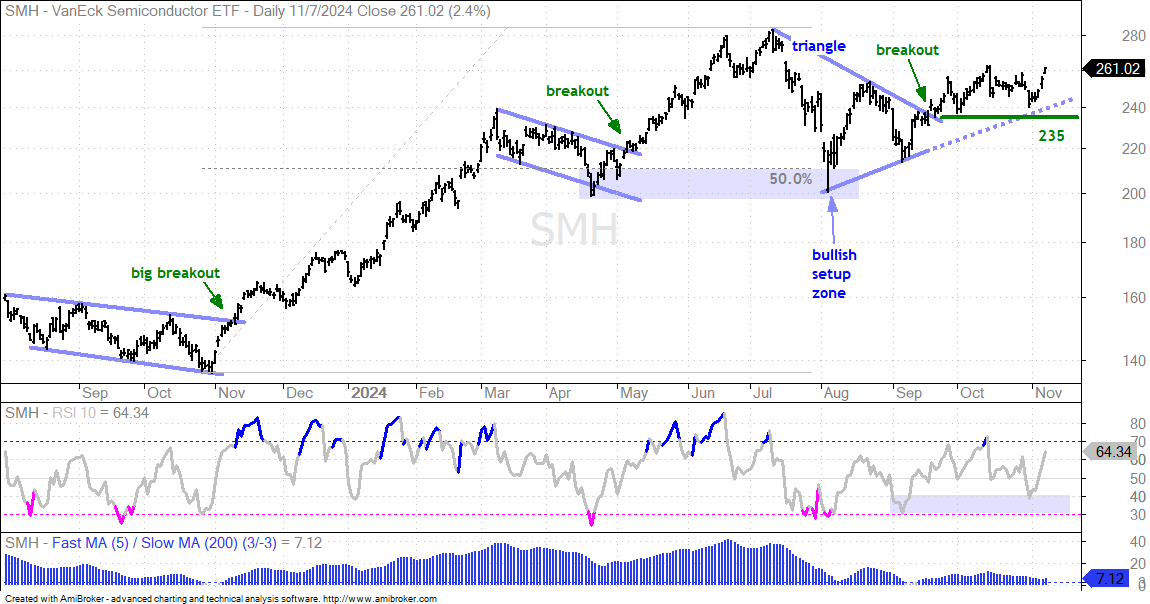
The next chart shows the Semiconductor ETF (SMH) with a triangle breakout around 240 and further gains to 260. This triangle breakout remains the dominant chart pattern and the breakout held. I showed a possible rising wedge last week, but removed this pattern for three reasons. We are in a bull market, XLK is in a strong uptrend and SMH has a triangle breakout working. A wedge is still possible, but less likely given the circumstances. Key support is set at 235.
IGV, CIBR, FINX and SKYY
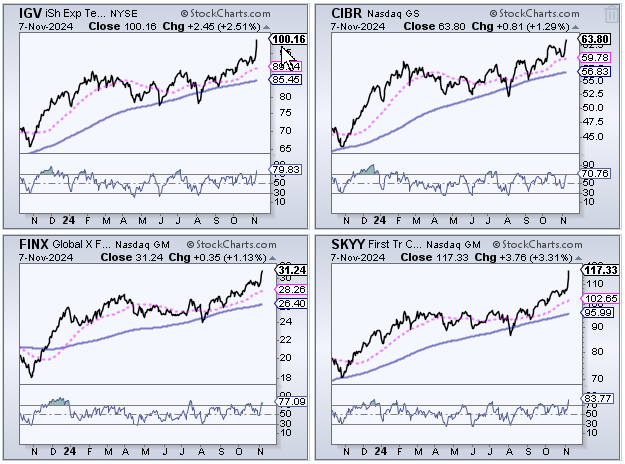
The Software ETF (IGV), Cybersecurity ETF (CIBR), FinTech ETF (FINX) and Cloud Computing ETF (SKYY) surged to new highs this week. These charts were covered last week.
Robotics & Artificial Intelligence ETF Breaks to New Highs
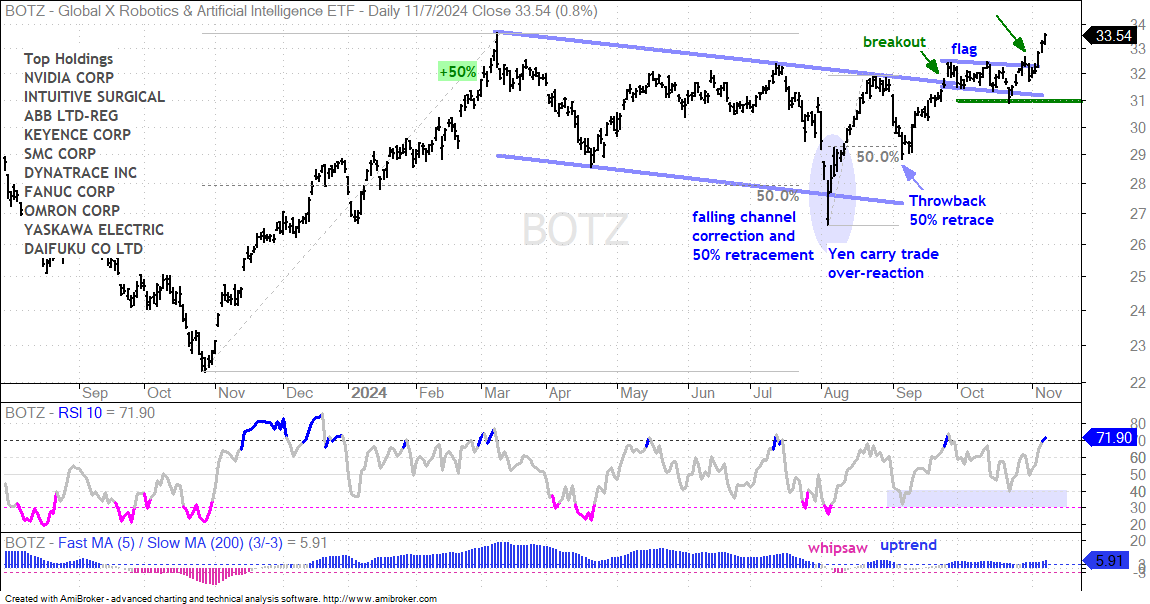
The next chart shows the Robotics & Artificial Intelligence ETF (BOTZ) with a channel breakout in late September and a flag breakout this week. Overall, the ETF advanced 50% into March and then corrected into August with a long falling channel. This decline retraced 50%, but the 5/200 %Differential (bottom window) dipped below -3% to signal a downtrend. This turned out to be a whipsaw as this trend indicator turned bullish a few weeks later with a move above +3%. Whipsaws are unavoidable. BOTZ then broke out of the falling channel, consolidated with a bull flag and broke out of the flag with a surge the last five days. The bigger channel breakout signals a continuation of the October-March advance and further gains are expected. Re-evaluation support is set at 31.
Taiwan Semi Pulls Back after Earning Surge
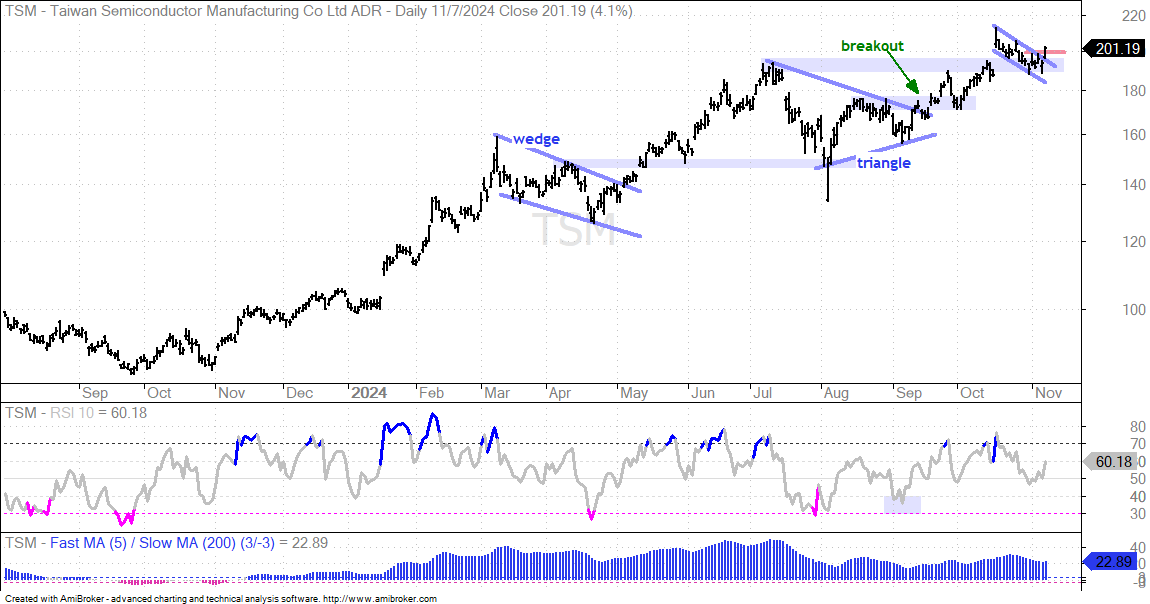
Taiwan Semi (TSM) is one of the leaders when it comes to the AI trade and semiconductor manufacturing. Note that TSM was featured on October 4th (here), along with Nvidia (NVDA), Broadcom (AVGO) and Ma rvell (MRVL). On the price chart, TSM is in a long-term uptrend with a new high after the earning pop in mid October. The stock gapped up and then filled this gap with a pullback into early November. Even though this pullback is very short-term, I view it as a bull flag and a return to broken resistance from the prior high. This area turns into support in the 190-200 area. Also notice that RSI dipped below 50 during this pullback. This is a very mild oversold condition. TSM broke flag resistance at 200 with a surge on Thursday and I view this as short-term bullish, within a long-term bullish environment.
Broadcom Tests Breakout Zone
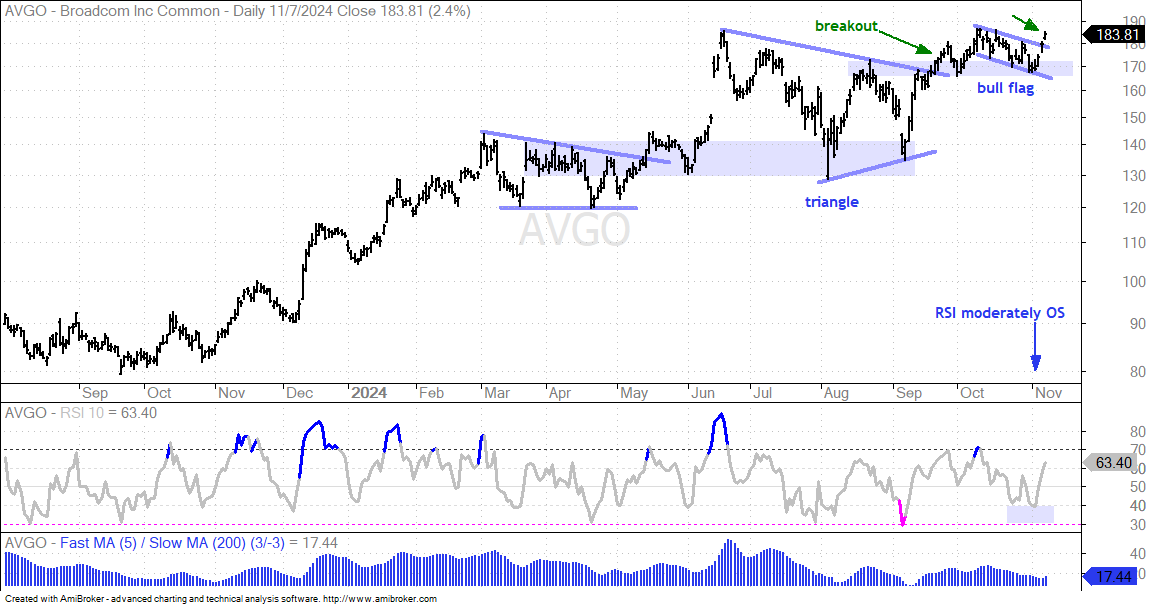
The chart below shows Broadcom (AVGO) forming a triangle from mid June to mid September and breaking out with a surge into late September. AVGO is clearly in a long-term uptrend and this triangle was a consolidation within that uptrend. Triangles represent a rest within the trend and the breakout signals a continuation higher. The breakout zone around 170 turns into first support and the stock fell back to this zone in late October. A falling flag formed and AVGO is breaking out of this flag. Notice that RSI became moderately oversold with a dip below 40 on 31-Oct. The flag breakout is bullish and signals a continuation of the September surge.
META Corrects back to Breakout Zone
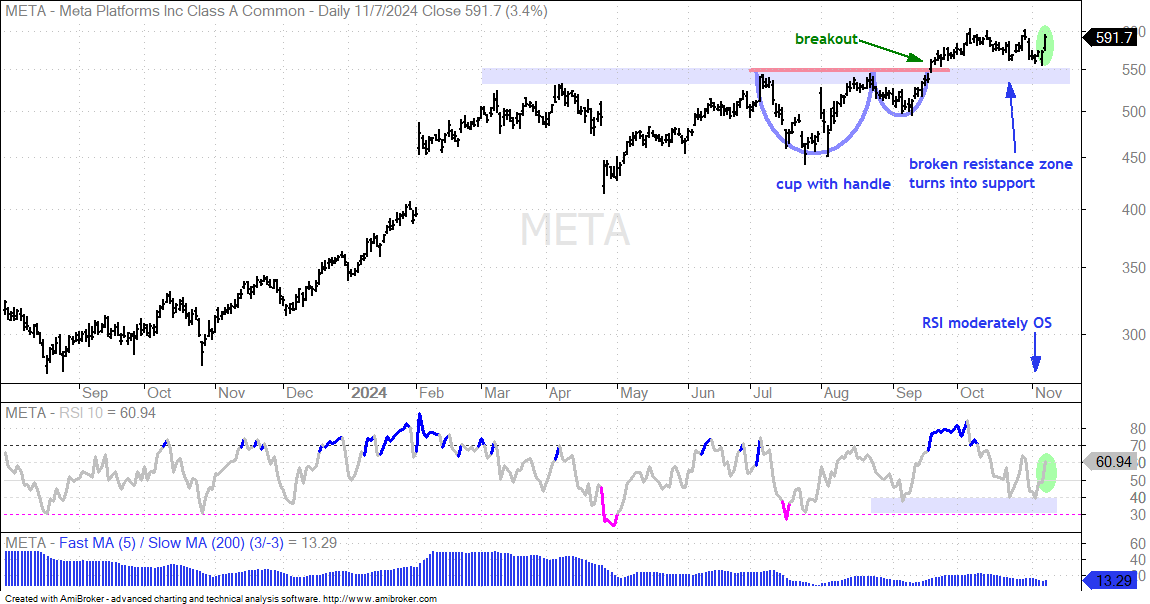
The next chart shows META with a cup-with-handle breakout in mid September and new highs into October. Overall, I see a long consolidation from March to September and a breakout to signal a continuation of the long-term uptrend. The breakout zone in the 540-550 area turns into first support, which META tested with the pullback to around 550. Overall, META is consolidating above the breakout zone and the breakout is holding. The indicator window shows RSI becoming moderately oversold with a dip below 40 on 4-Nov. This suggests that META corrected over the last five weeks and I view this as a correction within a bigger uptrend. The stock surged on Thursday and pushed RSI back above 50. This is the first sign that the pullback is ending and the upward trajectory is resuming.
Vertex Renews Breakout with Second Surge
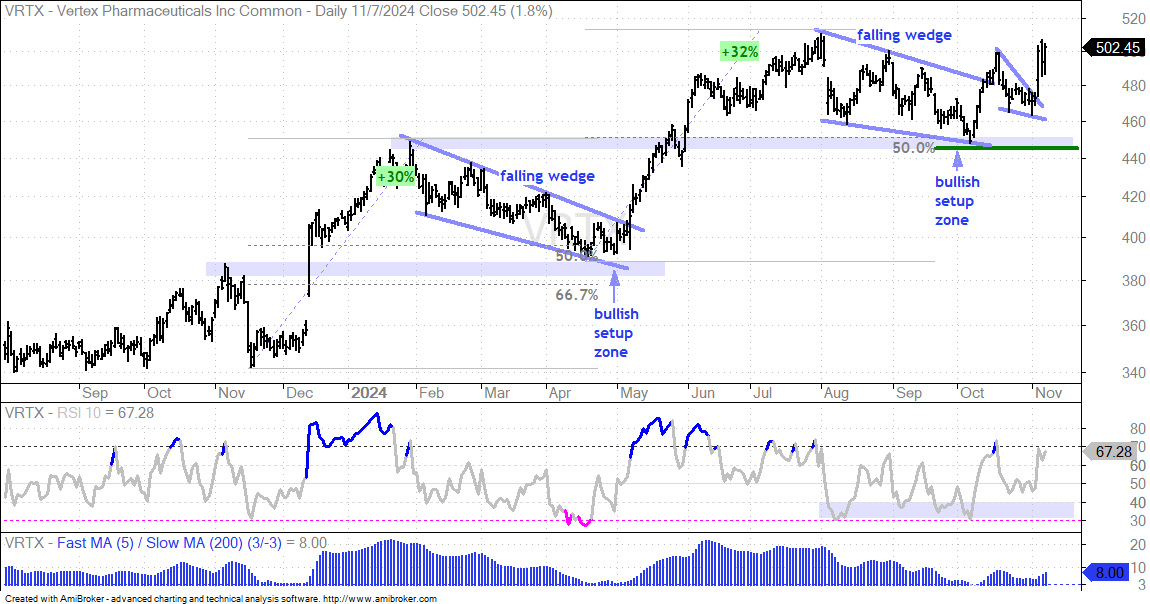
The next chart shows Vertex Pharmaceuticals (VRTX) two similar setups. VRTX was first featured on 11-Oct (here). The stock surged some 30%, formed a falling wedge that retraced around 50% of the prior advance and found support near the prior breakout (blue shading. This sequence occurred from November to April with a breakout in May, and from May to September with a breakout in October. After the October breakout, the stock fell back with a smaller falling wedge, also known as a pennant. This is a short-term bullish continuation pattern and VRTX broke out with a surge this week. I view the October and November breakouts as bullish, and VRTX is also in a long-term uptrend. These breakouts signal a continuation of the long-term uptrends and new highs are expected. Re-evaluation support is set at 445.
Freeport Triggers a Breakout
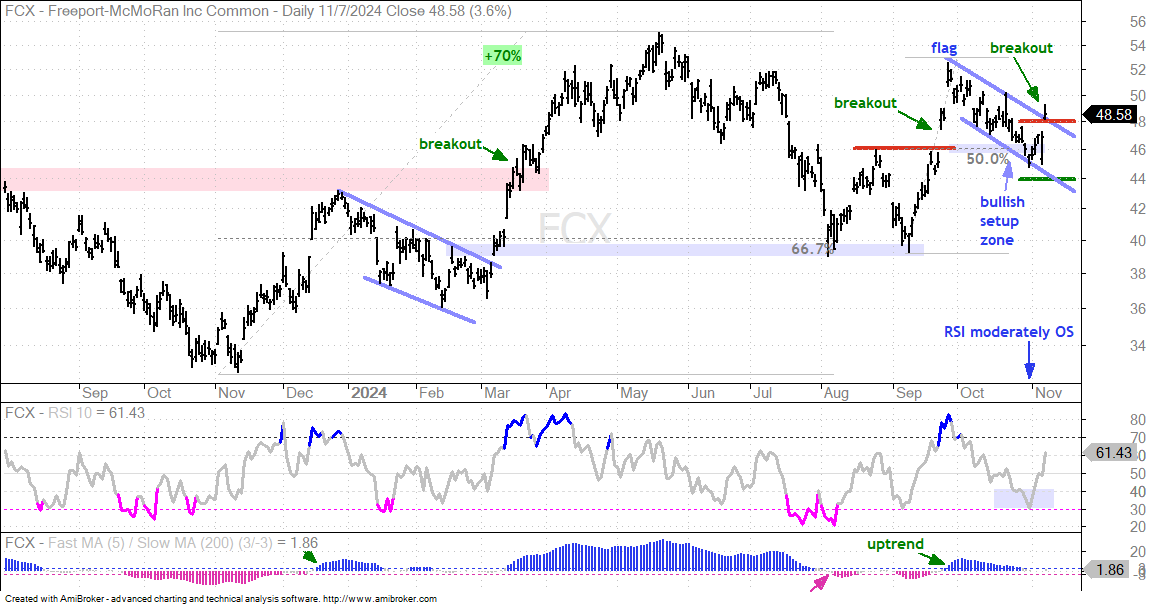
The next chart shows Freeport McMoRan (FCX), which is part of the copper miners group. Note that I featured FCX on October 25th (here) and am showing them again today because the stock broke out. Overall, the stock is in a long-term uptrend because the 5/200 %Differential exceeded +3% in late September. The bottom window shows the indicator bars turning blue with the move above +3% (uptrend). On the price chart, FCX surged in September and corrected into early November with a falling flag. This pullback retraced around 50%, returned to the prior breakout and RSI became moderately oversold (30.43). Thus, FCX hit a bullish setup zone around 46 and firmed the last six days. After a weak open and strong close on Wednesday, the stock surged on Thursday and broke resistance at 48. I view this breakout as bullish and will mark re-evaluation support at 44.
Commodity Related ETFs with Setups (CPER, DBB, COPX, DBA)
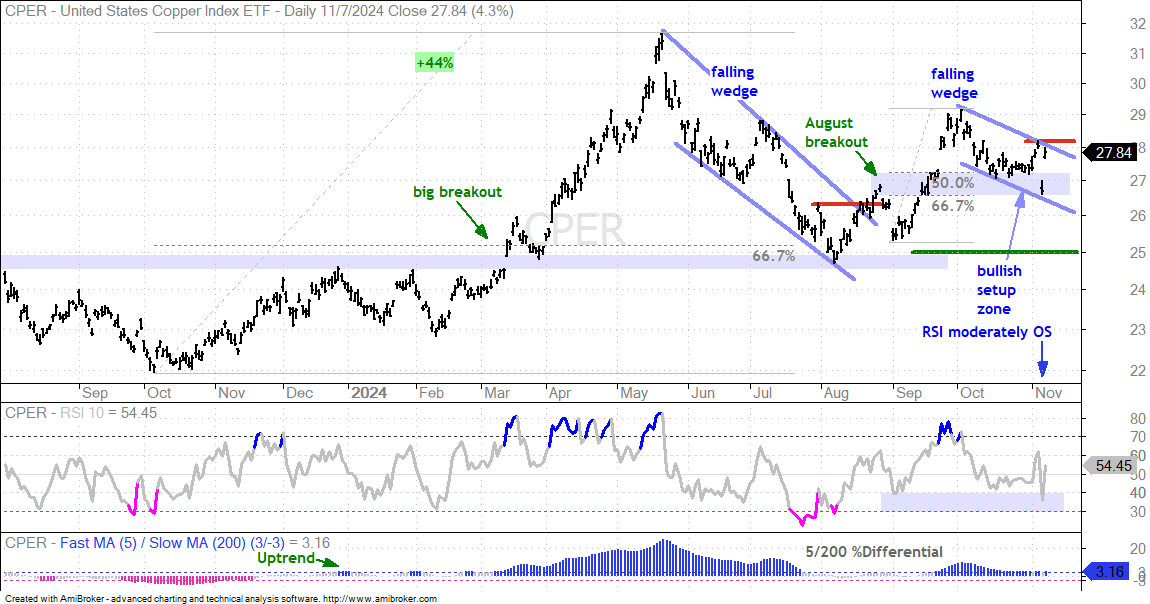
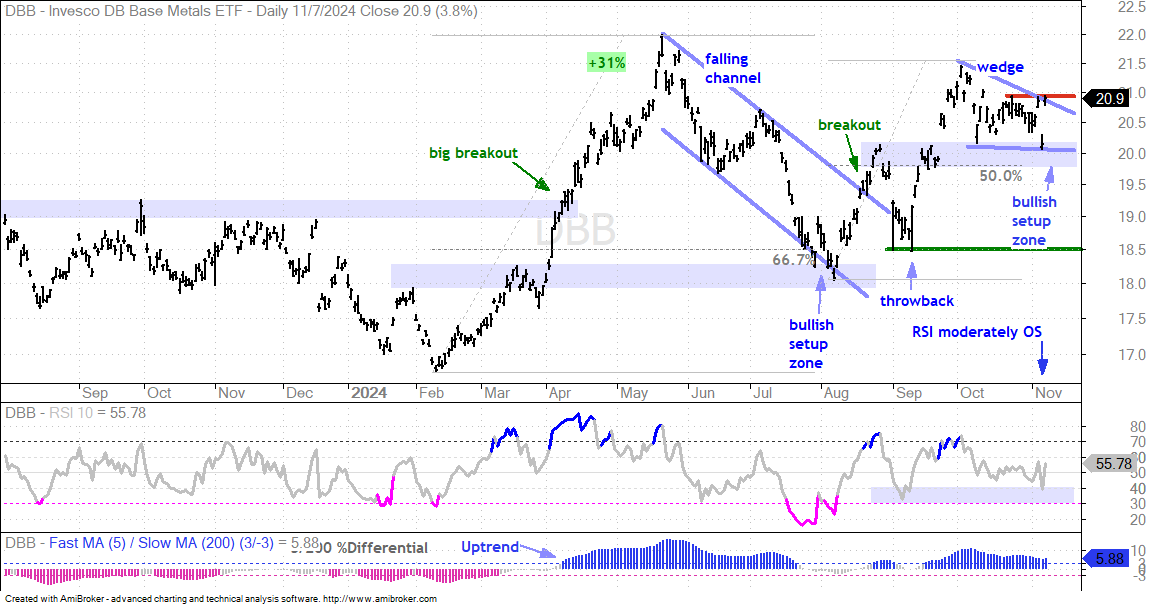
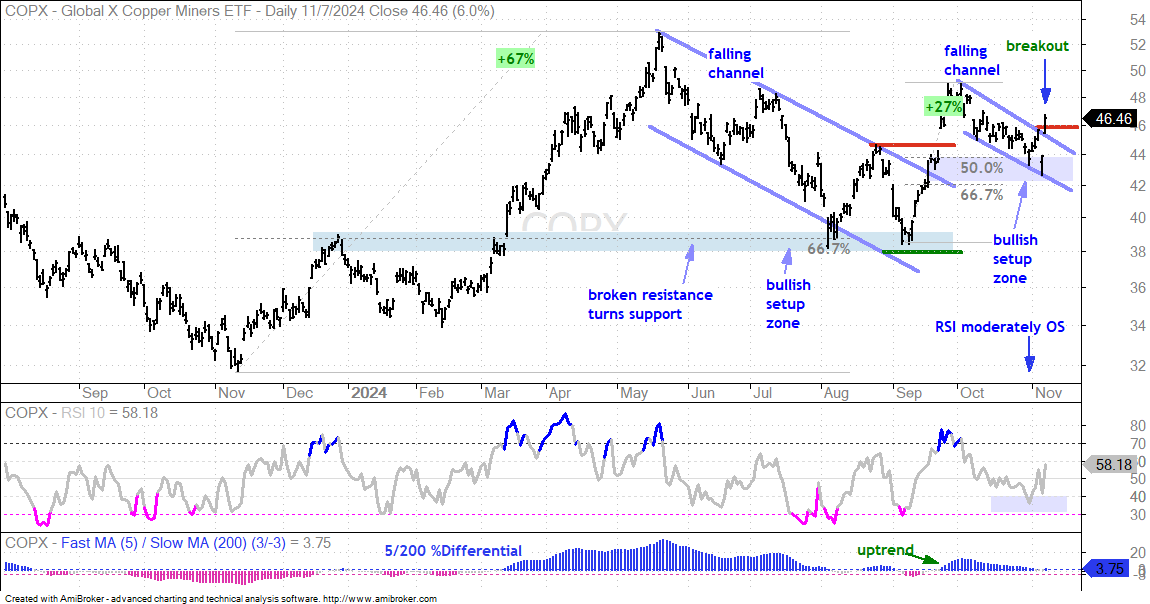
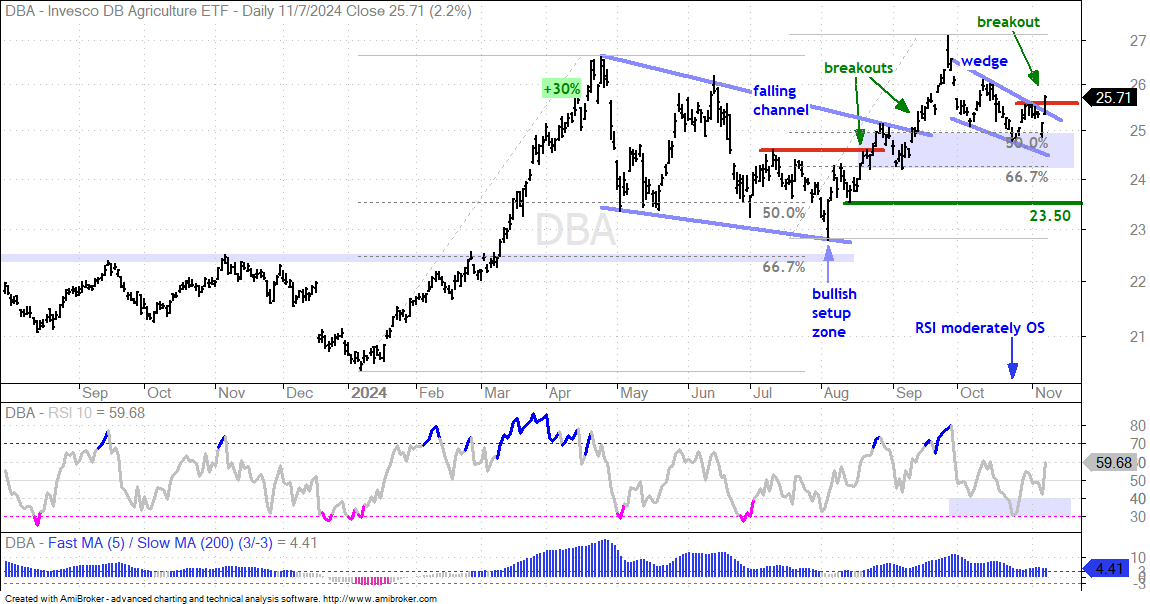
I will again show the charts for the Copper ETF (CPER), Copper Miners ETF (COPX) and DB Base Metals ETF (DBB) because all three surged in September and corrected into early November. Commodities were hit hard on Wednesday as the Dollar surged. Even so, these commodity ETFs quickly recovered and still have bullish setups, RSI was moderately oversold and there are tradable patterns at work. Note that a bullish setup zone is a zone marked by key retracements and support levels from broken resistance.
GLD becomes Moderately Oversold
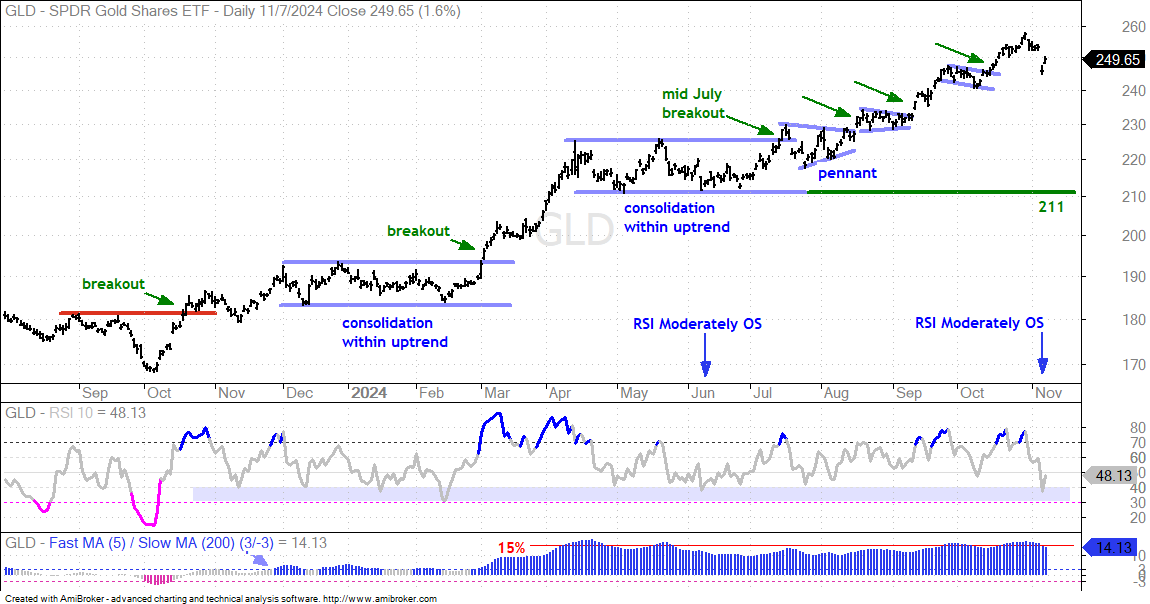
The Gold SPDR (GLD) has been in a strong uptrend since the breakout in mid July. There were then smaller consolidations and breakouts over the last few months. GLD became overbought in late September and in mid October when its 5-day SMA was over 15% above the 200-day SMA (bottom window). As noted at the beginning of this report, timing pullbacks within an uptrend is near impossible and our chances of timing the oversold bounce are better. Well, GLD is moderately oversold as RSI(10) dipped below 40 for the first since June. I do not see a setup on the price chart so we must watch for an RSI pop above 50 to signal the start of a bounce.
TLT Extends Downtrend
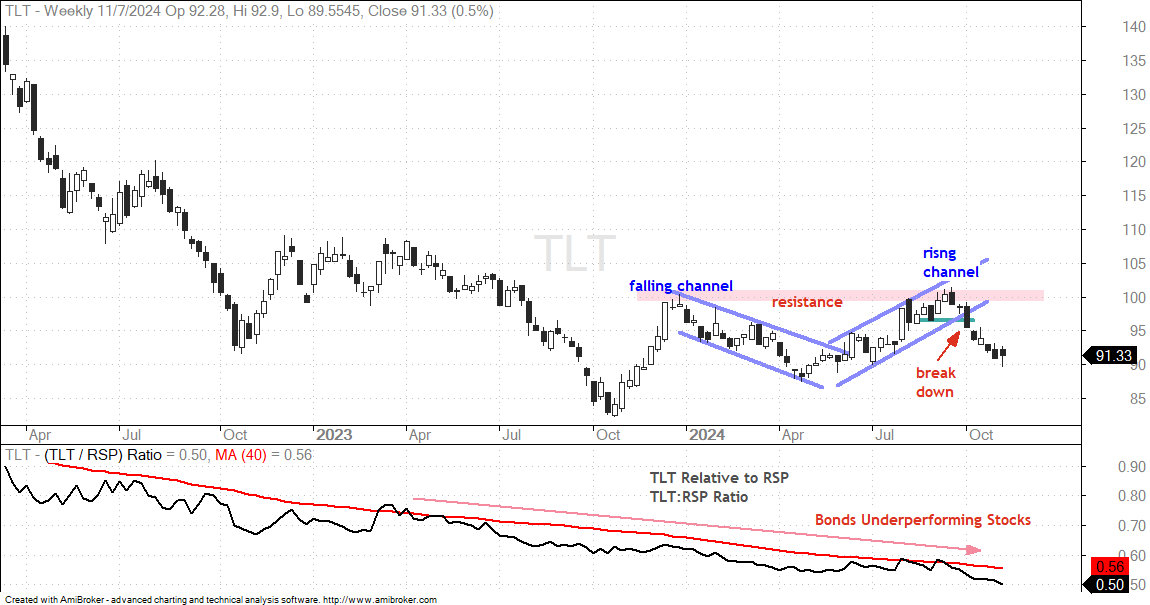
The 20+ Yr Treasury Bond ETF (TLT) hit resistance in the 100 area in late September and broke channel support in early October. This break down signaled the start of a downtrend and TLT fell further the next five weeks. TLT was even short-term oversold last week, but failed to bounce this week. The bond vigilantes are not happy about something and this is reflected in TLT.
Bitcoin Surges to New High
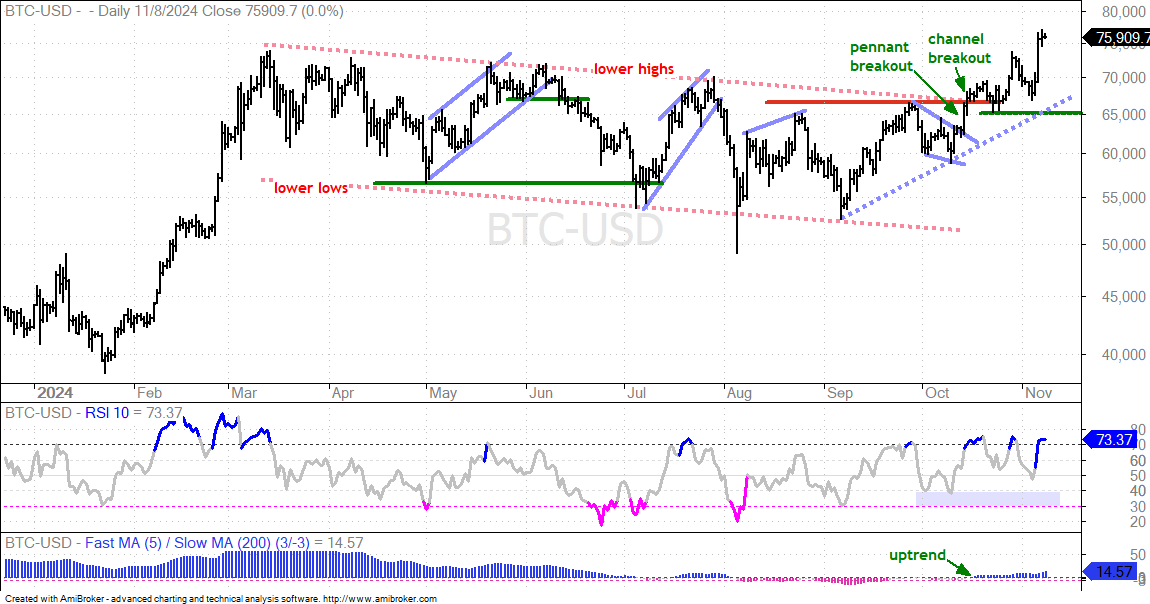
There is no change on the Bitcoin chart as it broke out in the second half of October and surged to new highs this week. Overall, Bitcoin worked its way lower with a large falling channel from March to September. It advanced to resistance in late September, formed a pennant pullback into October and broke out with a surge in mid October. After stalling around the breakout zone for two weeks, Bitcoin surged again the last two weeks and hit new highs. Broken resistance turns into first support and I am marking key support at 65000.