The next Weekly Report will be posted on Friday morning, October 25th.
Broad Strength and Fatigue in Large-cap Tech
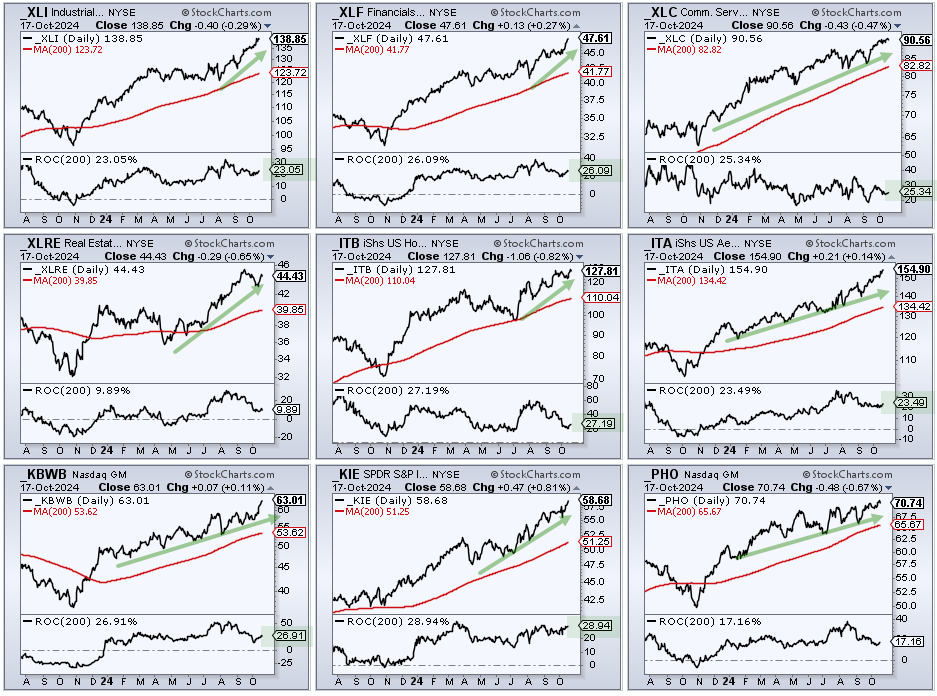
Stocks remain strong overall as large-caps (SPY), mid-caps (MDY) and equal-weights (RSP) hit new highs this week. We also saw new highs in several key groups: industrials (XLI), finance (XLF), housing (ITB) and communication services (XLC). The chart below shows nine leading ETFs with strong uptrends.
The indicator windows on the charts above show the 200-day Rate-of-Change, which chartists can use to compare performance. Seven of the nine are above 20%. These include the Industrials SPDR (XLI), Finance SPDR (XLF), Communication Services SPDR (XLC), Home Construction ETF (ITB), Aerospace & Defense ETF (ITA), KBW Bank ETF (KBWB) and Insurance ETF (KIE).
Overall, I am seeing broad strength in the stock market and the weight of the evidence is clearly bullish. The Composite Breadth Model is bullish, breadth is strong and yield spreads show confidence in the credit market.
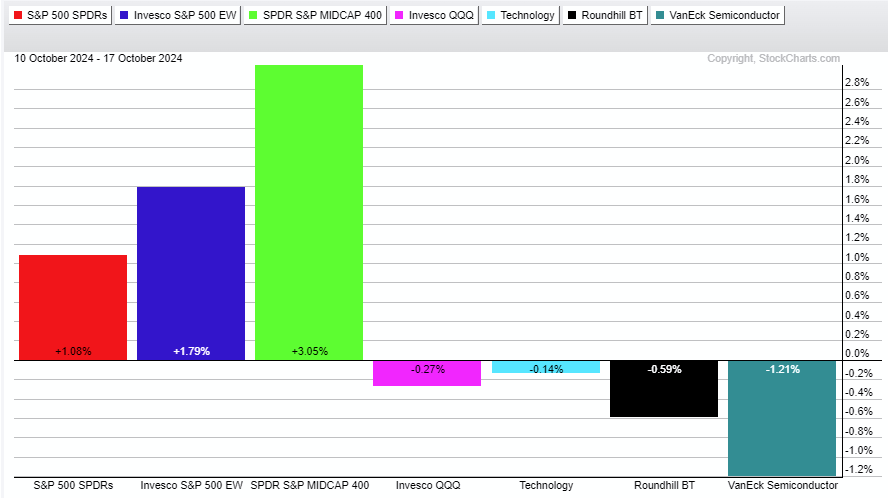
Despite a bullish backdrop, I am also seeing some weariness in large-cap tech. QQQ remains just below its July high and is actually down slightly this week. Ditto for SMH. These two also opened strong and closed weak on Thursday. The Mag7 ETF stalled the last three weeks, even as Nvidia surged over 15%. The PerfChart below shows performance over the last five days. SPY, RSP and MDY are up 1-3% (left side), while QQQ, XLK, MAGS and SMH are down (right side).
Composite Breadth Model is Bullish
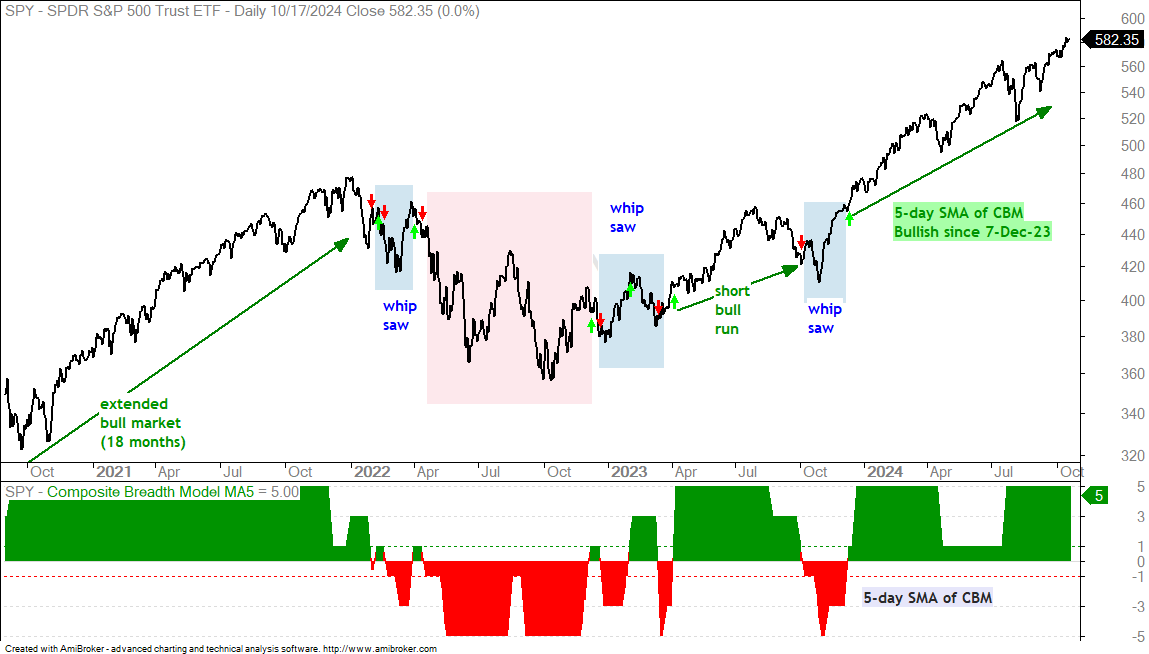
The chart below shows SPY with the 5-day SMA of the Composite Breadth Model at +5. This model turned bullish on December 7th and remains bullish. A positive CBM signals a favorable environment for stocks (bull market). Even within a bull market, we can still see pullbacks, corrections, volatility, rotations and trading ranges.
The Composite Breadth Model aggregates signals in over a dozen breadth indicators from the S&P 500 and S&P 1500. This means it covers large-caps, mid-caps, small-caps, NYSE stocks and Nasdaq stocks. It ranges from +5 to -5. A bull market is present when the 5-day SMA of the CBM is at +1 or higher. A bear market is present when below +1.
SPX Leads with Most Long-term Uptrends
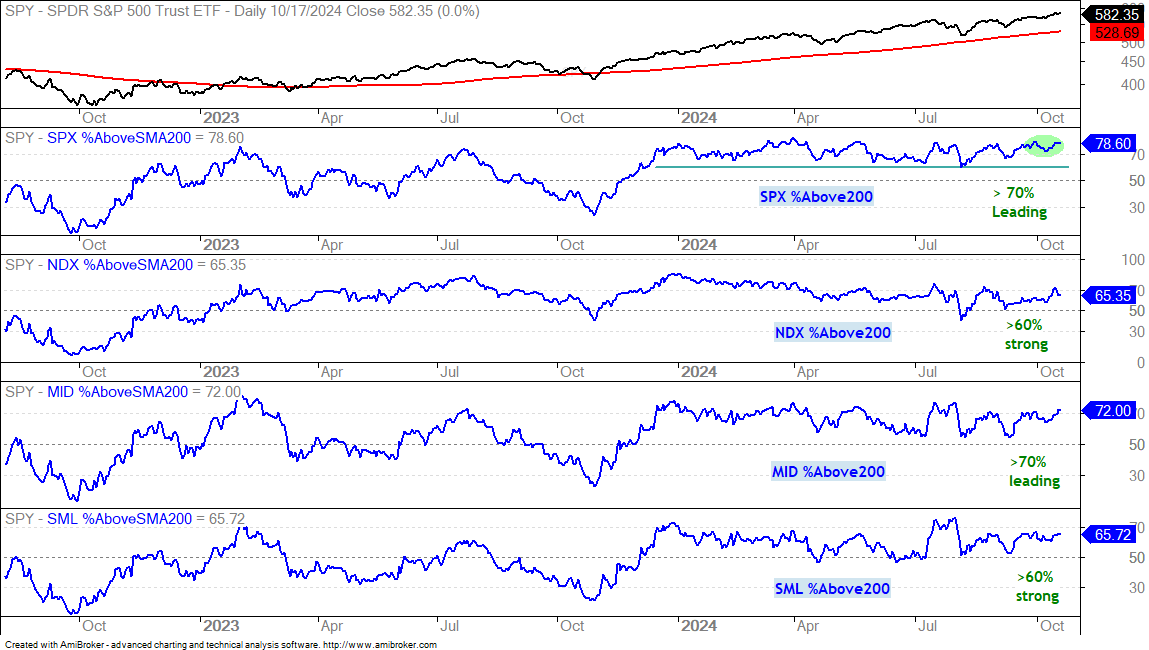
The S&P 500 continues to lead the major indexes with the most stocks in long-term uptrends (Percentage of stocks above 200-day SMA). The chart below shows this indicator for the S&P 500, Nasdaq 100, S&P MidCap 400 and S&P SmallCap 600. Over 70% of S&P 500 and S&P MidCap 400 stocks are above their 200-day SMAs. These strong breadth readings reflect broad participation in the current bull market. Over 65% of stocks in the Nasdaq 100 and S&P SmallCap 600 are above their 200-day SMAs. This is certainly not weak, but not as strong as the S&P 500 and S&P MidCap 400.
New Highs Expand in Mid-caps and Small-caps
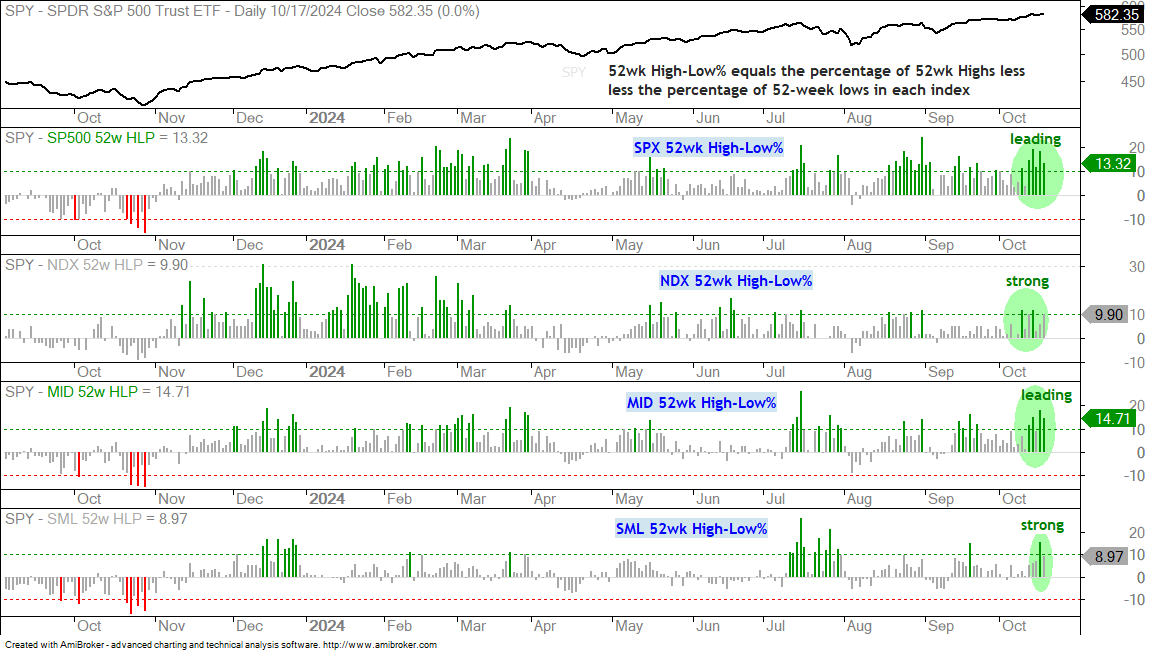
We are seeing renewed interest in mid-caps and small-caps as their High-Low Percent indicators exceeded +15% earlier this week. High-Low Percent is the percentage of new highs less the percentage of new lows. The chart below shows High-Low Percent for the same four indexes. SPX and NDX High-Low Percent first exceeded +10% on October 9th. Meanwhile, MID and SML High-Low Percent remained below +10%. All four moved above +10% this week as the rally broadened into mid-caps and small-caps. Of note, stocks in the S&P 500 and S&P MidCap 400 are leading as their High-Low Percent indicators exceeded +18% earlier this week. Stocks hitting 52-week highs are in leading uptrends and this is bullish for the broader market.
BBB Spread Extends to New Lows (narrows)
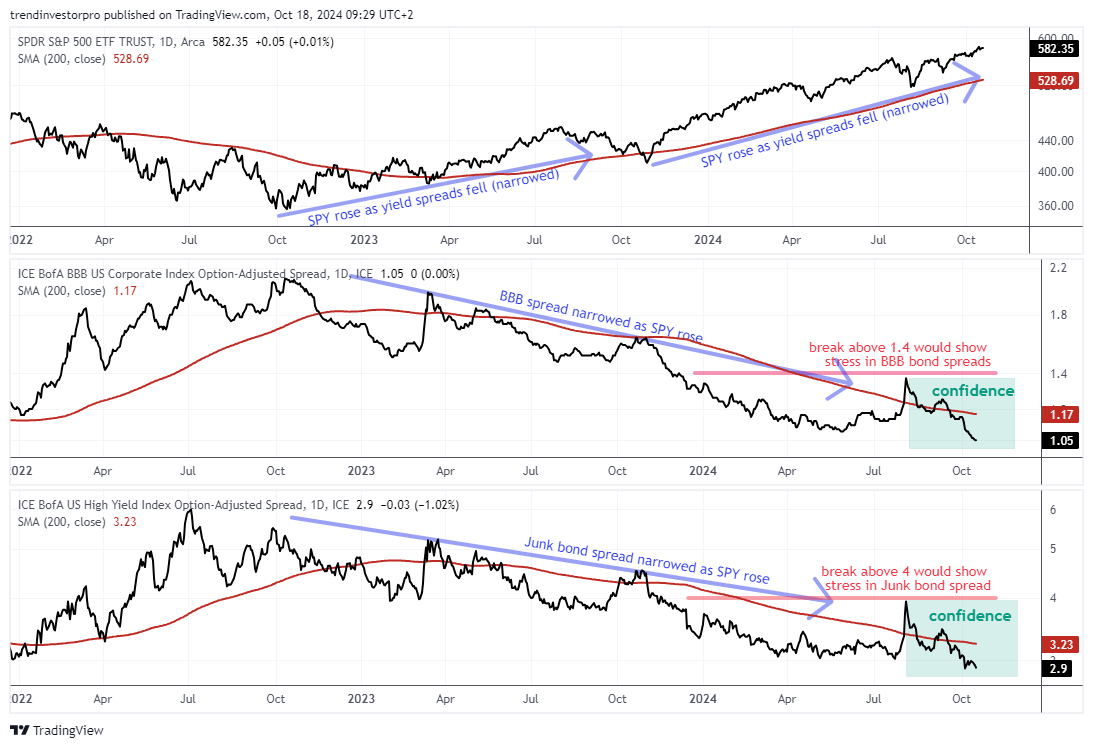
The next chart shows SPY, the BBB spread and the Junk bond spread with their 200-day SMAs. The BBB and Junk bond spreads widened sharply with a pop in early August, but quickly fell back and narrowed to new lows here in October (green shading). This narrowing shows increasing confidence in the corporate credit markets and this is positive for stocks.
These spreads show the difference between a corporate bond yield (BBB) and the equivalent US Treasury bond yield. BBB bonds are the lowest rated investment grade bonds. US Treasuries are the ultimate safe-haven bonds. The spread between these two widens (rises) when stress builds in the corporate bond market. This is negative for stocks. The spread narrows (falls) when stress levels are low or subsiding. This is positive for stocks.
SPY Tags Another New High
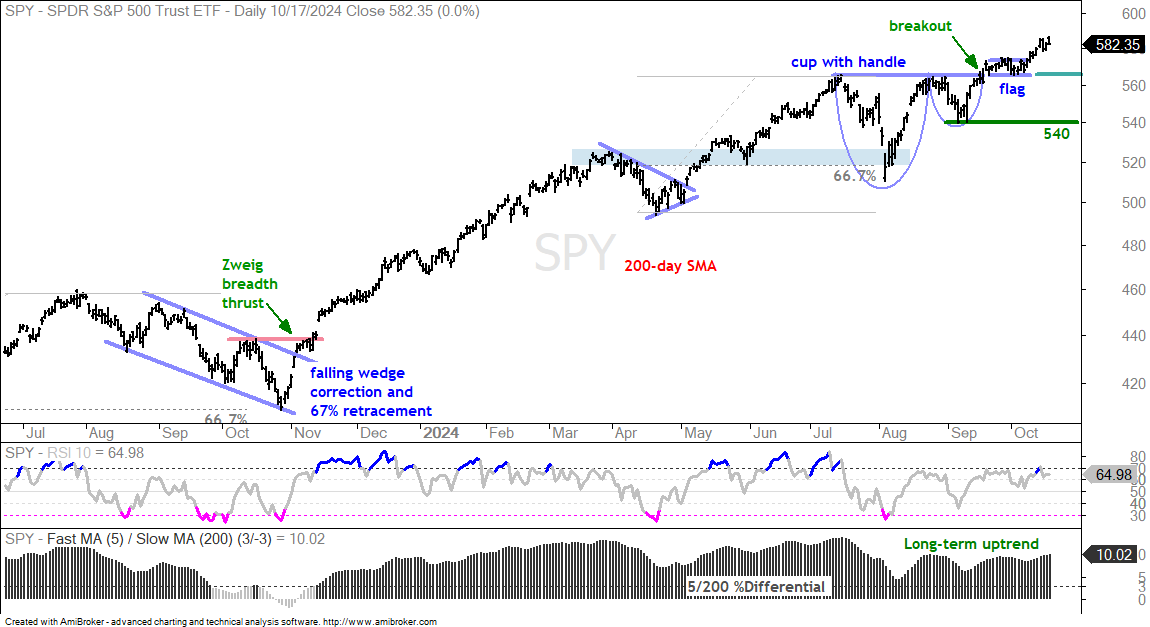
There is no change in SPY as the ETF hit another new high this week. Overall, a cup-with-handle pattern formed from mid July to mid September and SPY broke rim resistance with a surge on September 19th. This breakout held as the ETF consolidated above the breakout level. A small flag formed into early October and SPY broke out of the flag last week. Flags are short-term continuation patterns. This one formed after an advance so it is a bullish continuation pattern. The flags low now mark short-term support to watch for signs of a failed breakout and pullback. Long-term support is set at 540 for now.
The indicator window shows RSI(10) and the 5/200 %Differential. The latter tells us the direction of the long-term trend. It turns bullish with a move above +3% and remains bullish until a move below -3%. This long-term trend indicator has been bullish since February 2023. It dipped into negative territory in October, but did not exceed -3%. This signal threshold helps to reduce whipsaws and stay with the bigger trend. RSI is used to identify oversold conditions during a long-term uptrend. It turns pink with a move below 30. I typically ignore overbought readings because overbought conditions are normal in strong uptrends.
QQQ, MAGS and XLK Remain with Triangle Breakouts
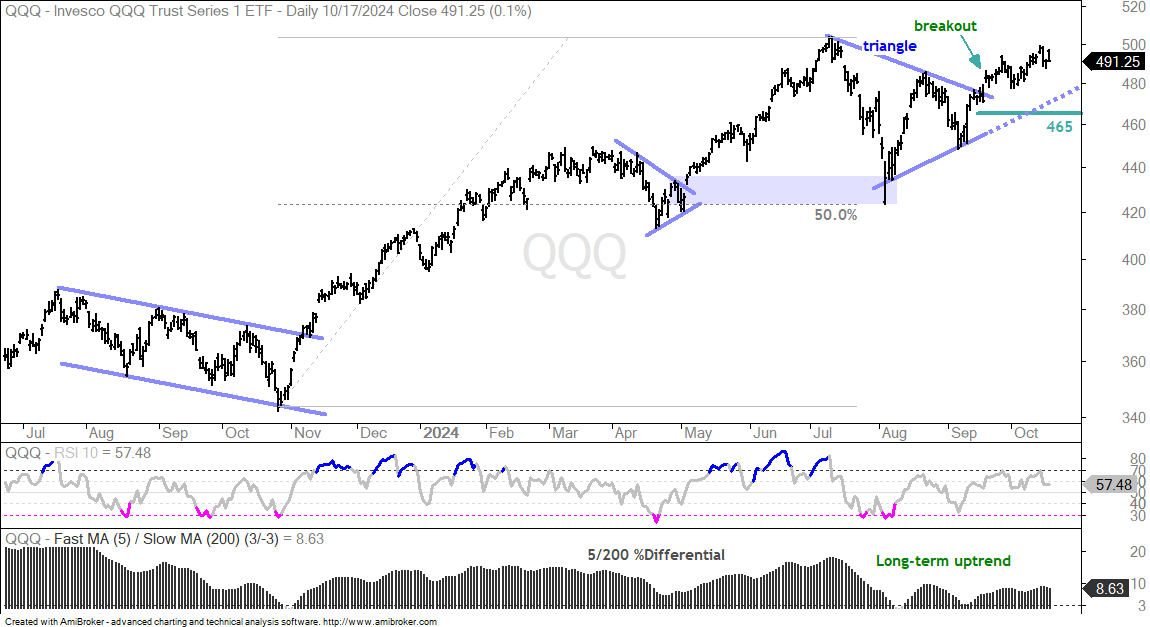
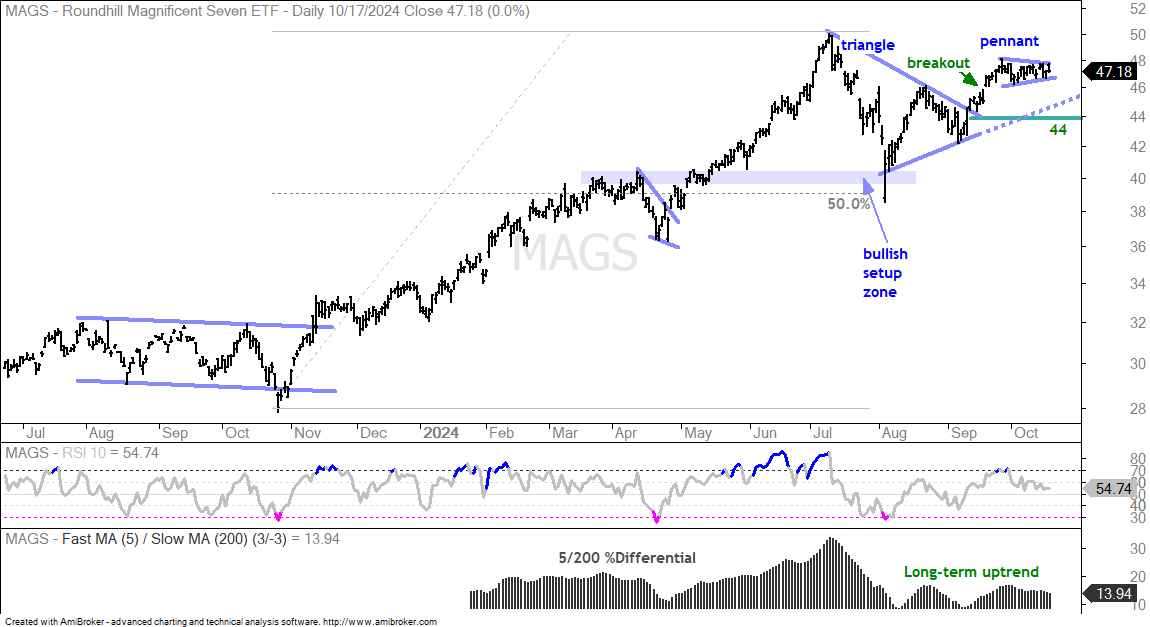
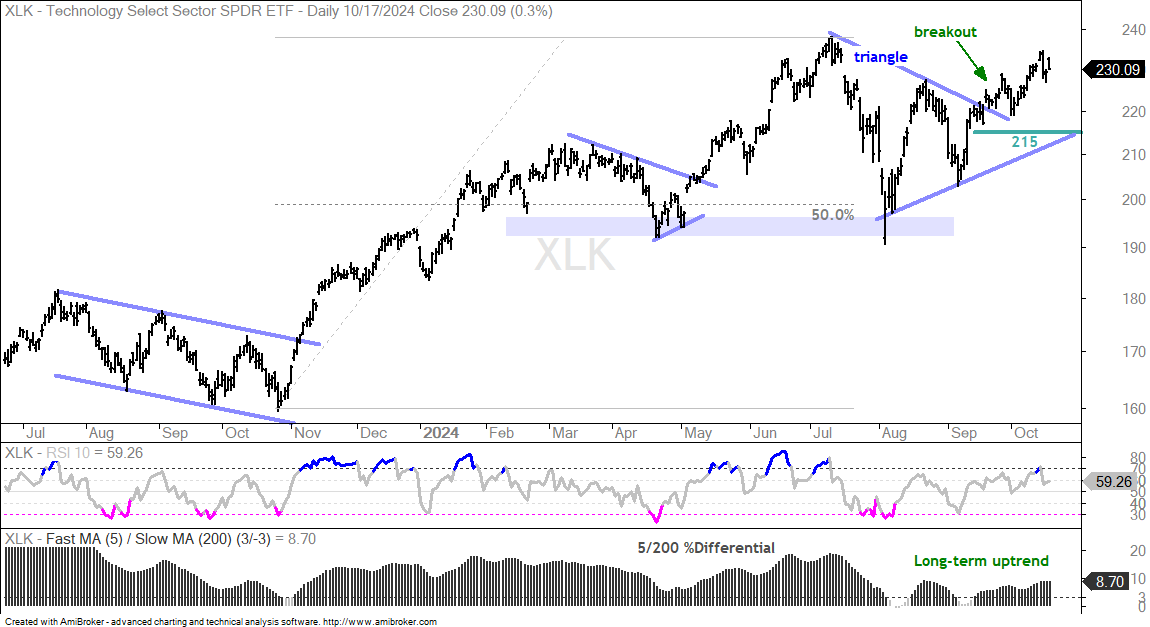
There are no changes on the charts for the Nasdaq 100 ETF (QQQ), Mag7 ETF (MAGS) and Technology SPDR (XLK). Their 5/200 % Differentials are firmly positive (> +8%). These ETFs formed triangle consolidation patterns from early July to mid September and broke out in the second half of September. After an extended advance, a triangle is a consolidation within an uptrend. It is a bullish continuation pattern that is the pause the refreshes. The breakouts signal a continuation of the long-term uptrends and new highs are expected. I am marking re-evaluation levels just below the triangle breakouts (green lines).
The first chart shows QQQ with the triangle breakout and re-evaluation support marked at 465.
The next chart shows the Mag7 ETF (MAGS) with re-evaluation support marked at 44. While SPY moved higher the last three weeks and notched a new high, MAGS traded flat and formed a pennant. Technically, this is a short-term bullish continuation pattern and a breakout would target a move to new highs. A break below the pennant lows would be short-term negative, but possibility lead to a short-term oversold opportunity in the 45 area.
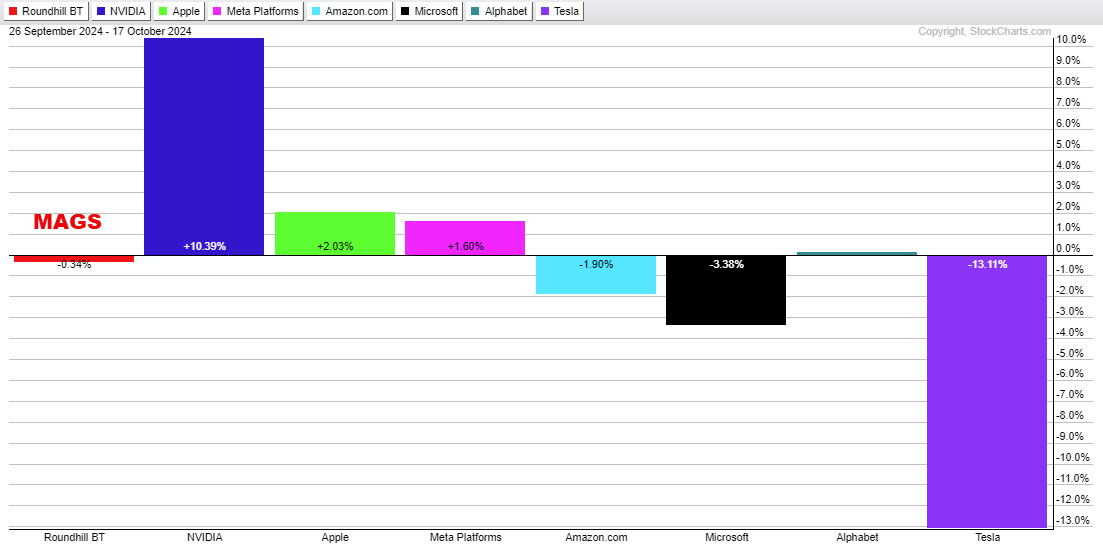
Note that MAGS is not as homogenous as one might think. NVDA is the king of AI chips. MSFT, GOOGL, AMZN and META are in an arms race and buying these chips like there is no tomorrow. TSLA is also part of the AI push as they tout robo taxis and awe-inspiring rocket booster catches. AAPL released its “AI Enabled” iPhones, but is not spending a fortune on chips. Seems NVDA and APPL are in enviable positions (benefitting from the AI arms race without spending on AI). The PerfChart below shows 15-day performance for MAGS and its components. MAGS is flat, NVDA is up big (+10.39%) and TSLA is down big (-13.11%). The other five stocks are mixed. Mixed performance could mean choppy trading for this ETF.
The next chart shows the Technology SPDR (XLK) with re-evaluation support marked at 215.
SOXX or SMH?
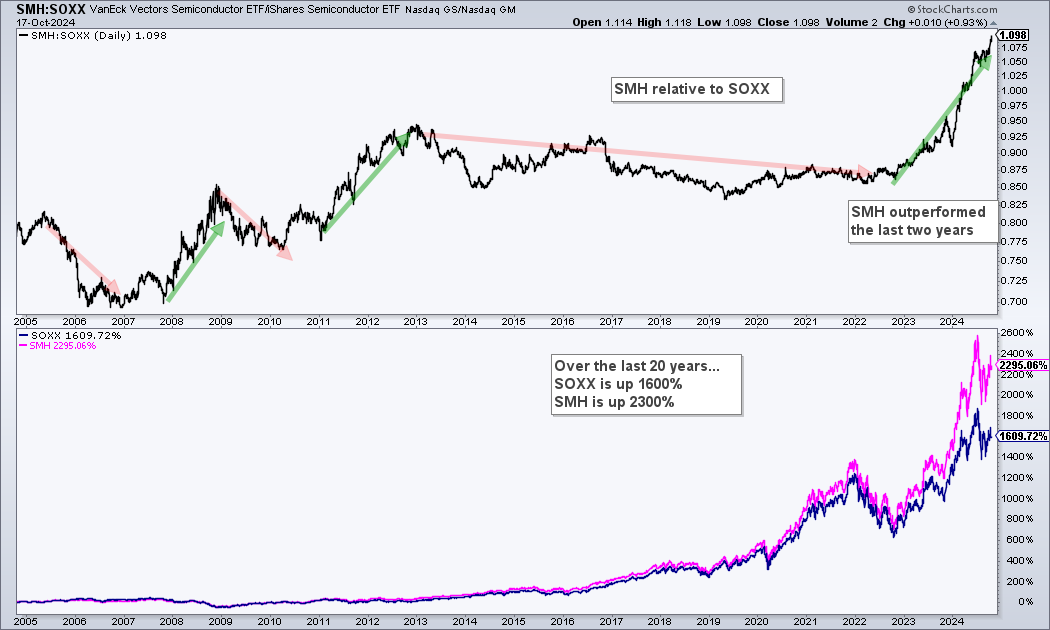
I am always torn between the choices for semiconductor ETFs. I recently watched a video from Nanalyze on the differences (here). The Semiconductor ETF (SMH) caps the weights of the top three components at 20%, while the Semiconductor ETF (SOXX) caps the weights of the top five components at 8%. SMH gives the leaders more room to run. This, of course, is a double-edged sword. However, it is a big reason by SMH outperformed SOXX over the last two years. The chart below shows the SMH:SOXX ratio over the last 20 years. After a long period of slight underperformance, the price-relative (SMH:SOXX) ratio surged the last two years. This is no doubt because NVDA, TSM and AVGO account for around 40% of the ETF.
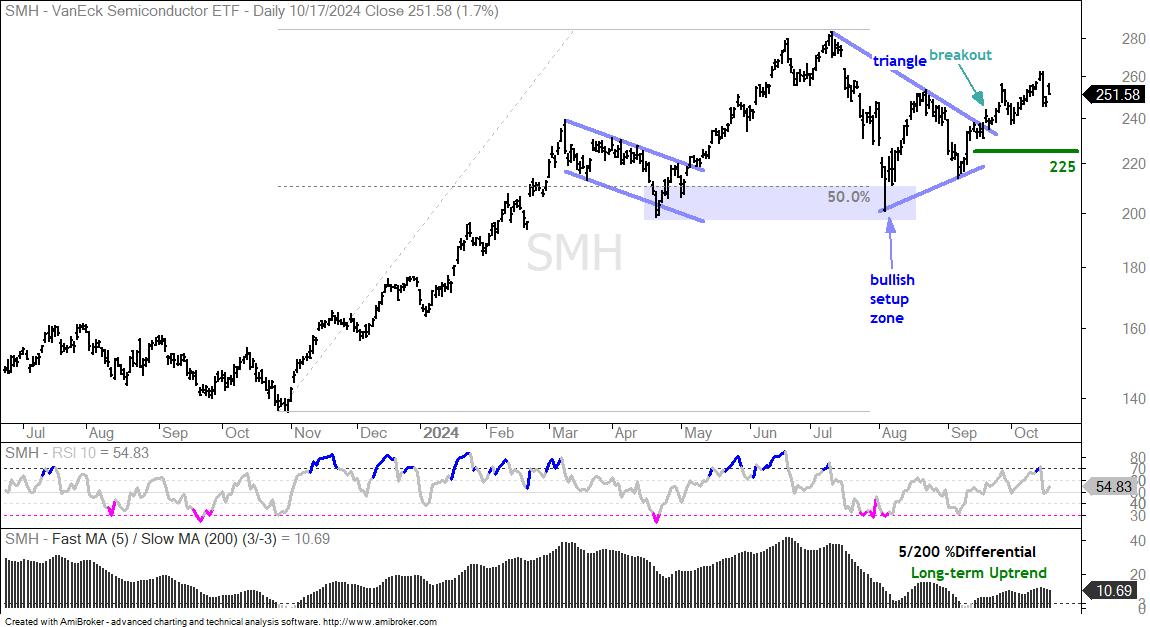
I would favor an ETF that lets its winners run and this favors SMH. Thus, I will analyze SMH today. SMH hit a new high in July, fell sharply into early August and then formed a triangle consolidation. This triangle represents a rest within the bigger uptrend and the subsequent breakout signals an end to this rest. More importantly, it also signals a continuation of the bigger uptrend. The bottom indicator shows the 5/200 %Differential above 10% (strong uptrend). The breakout is holding and I am marking re-evaluation support at 225.
Software, Cybersecurity, Cloud, Fintech Become Extended
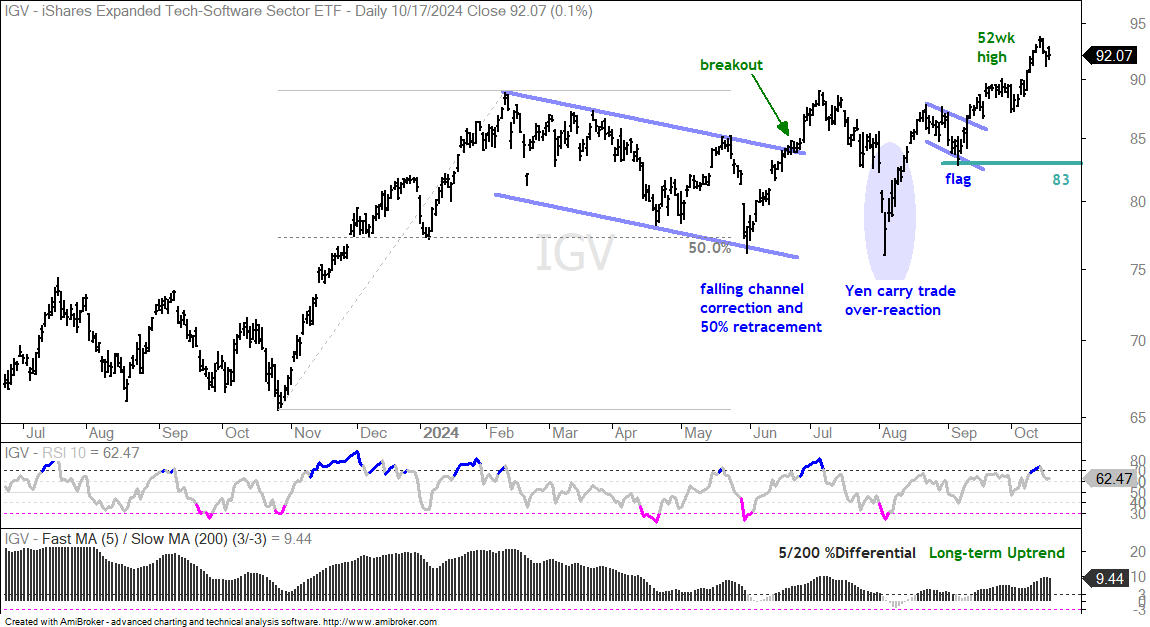
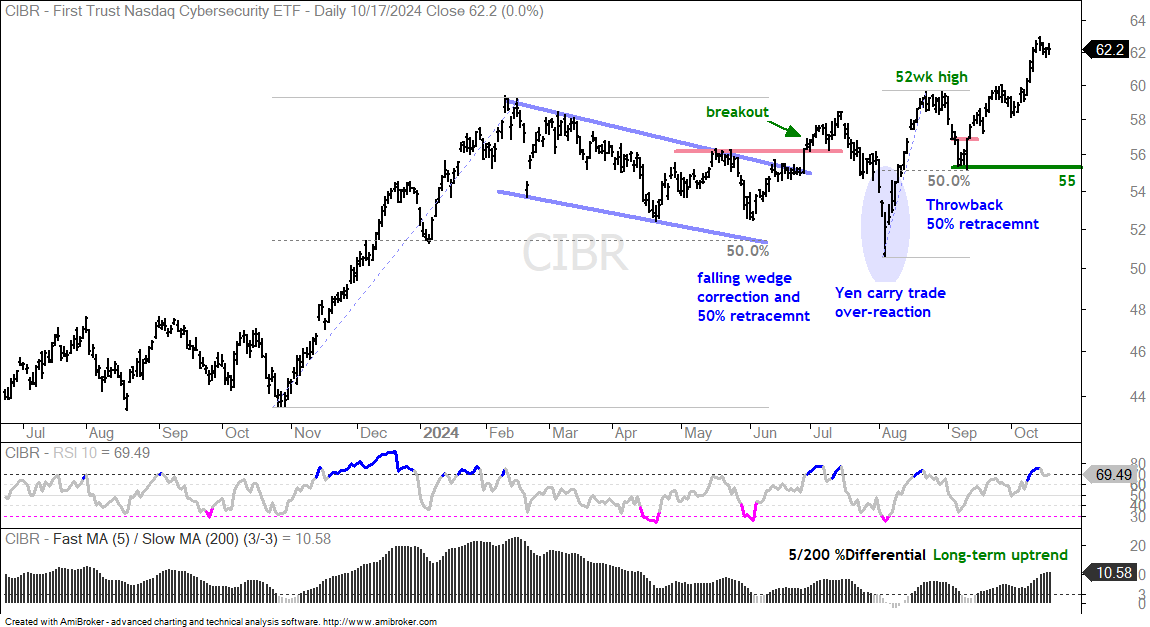
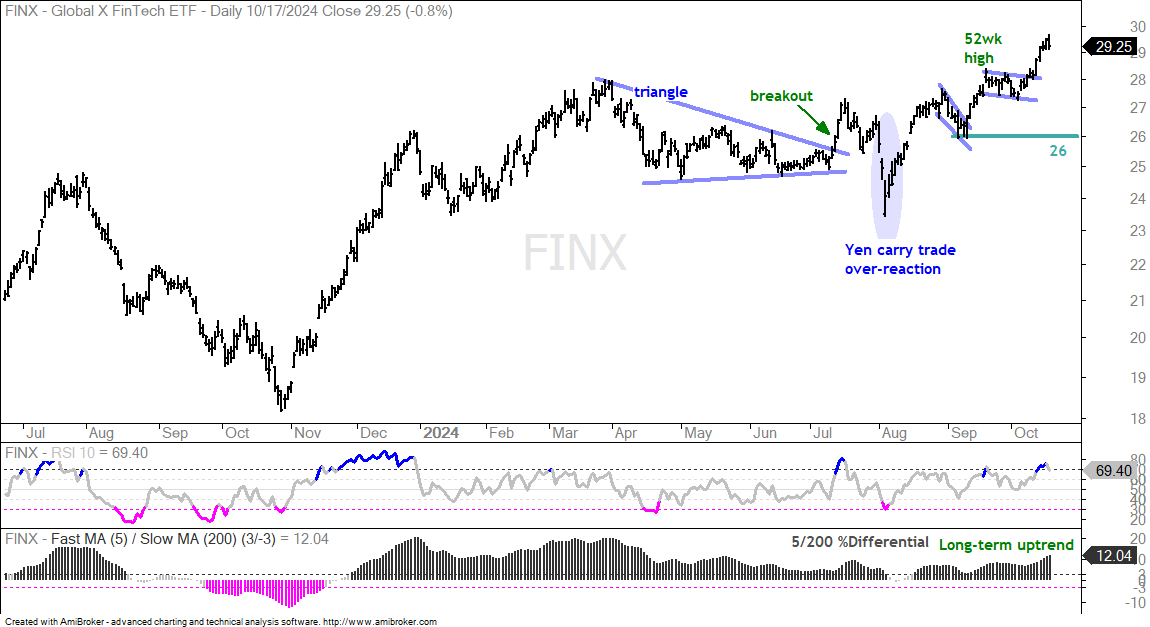
The Software ETF (IGV), Cybersecurity ETF (CIBR), FinTech ETF (FINX) and Cloud Computing ETF (SKYY) remain with leading uptrends, but they are getting extended short-term. All four are up over 10% in the last six weeks (from their early September lows). Overbought in an uptrend is not long-term bearish. In fact, overbought conditions are normal during uptrends (RSI(10)>70). Overbought just means that these ETFs are in confirmed uptrends. Short-term, however, overbought conditions can lead to a consolation or a pullback. A 3-5% pullback could provide an opportunity.
The first chart shows the Software ETF (IGV) with a breakout in late June, the Yen carry-trade debacle in early August and the recovery to new highs in September. Long-term support is set at 83.
The next chart shows the Cybersecurity ETF (CIBR) with similar characteristics and re-evaluation support at 55.
The next chart shows the FinTech ETF (FINX) with a flag breakout last week and fresh new highs this week. Long-term support is set at 26.
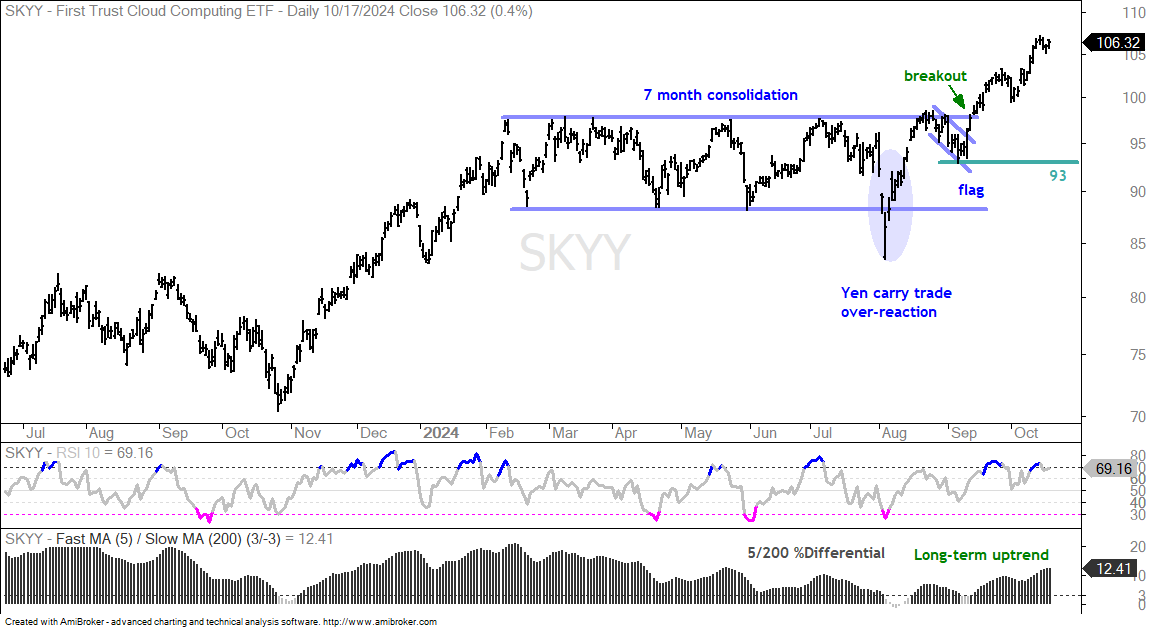
The next chart shows the Cloud Computing ETF (SKYY) with a massive breakout in late September and new highs throughout October. Long-term support is set at 93.
Qualcomm, ARM Holdings and Dell Technologies were featured on September 13th.
HPE Labors Higher
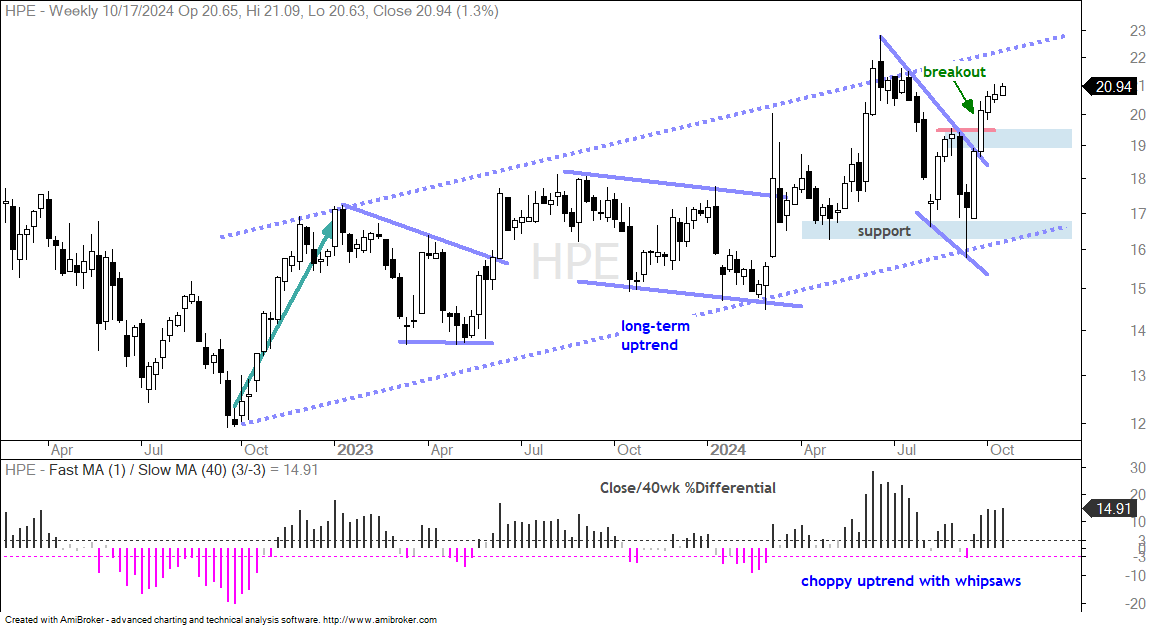
The next chart shows weekly candlesticks for Hewlett Packard Enterprise (HPE), which is involved in data centers. Note that I featured Dell Technologies (DELL), a competitor, on September 13th (along with QCOM, ARM, NVDA, and AVGO).
The chart sports a choppy uptrend since the surge from 12 to 17 in late 2022. HPE started 2023 around 17 and is currently around 21, some 21 months later. Talk about a laborious uptrend. Most recently, HPE fell to support in the 17 area with a falling wedge and broke out with a surge above 20 over the last five weeks. This is a breakout within an uptrend. The breakout zone around 19 turns first support. A throwback to this area could offer a second chance to partake in the breakout. The indicator window shows the Close/40wkSMA %Differential. It whipsawed the last two years and was not much help.
Martin Marietta Reverses off Key Retracement
The next chart shows weekly candlesticks for Martin Marietta (MLM), which is in the construction materials business. MLM surged 60% and hit new highs throughout the first quarter. It then embarked on a correction from April to September. Notice that the stock retraced around half of this advance with a falling channel. The retracement amount and the pattern are both normal for corrections within bigger uptrends. MLM broke out with a surge above 550 the last two weeks and I view this as bullish. It signals an end to the correction and a resumption of the bigger uptrend. I will mark key support at 515 and re-evaluate on a close below this level. Short-term, the breakout zone around 550 turns into the first support level to watch. A throwback to this area could offer a second chance to partake in the breakout. The indicator window shows the Close/40wkSMA %Differential moving to +2.49% this week. Technically, a move above 3% would signal the start of a long-term uptrend.
TLT Breaks Rising Channel Support
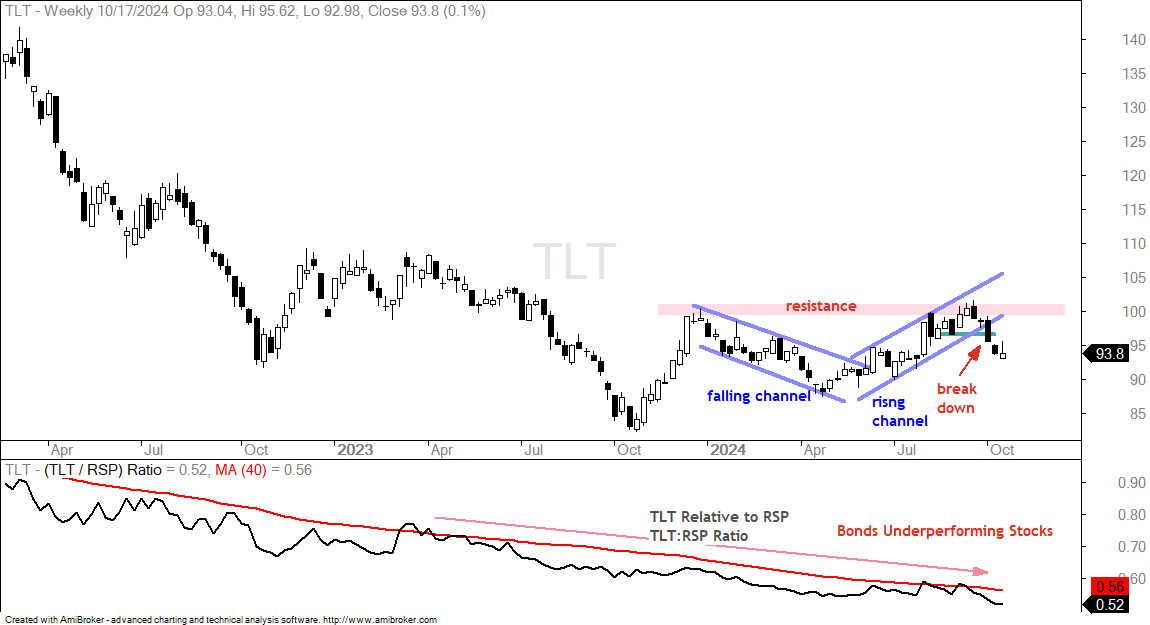
The 20+ Yr Treasury Bond ETF (TLT) is a difficult call, but I am turning bearish because it broke channel support with a sharp decline the last few weeks. TLT turned bullish with a channel breakout in June and advanced into mid September. A normal pullback turned into a sharp decline and broke rising channel support. Moreover, TLT failed near the December 2023 high (red resistance zone). At best, TLT is in some sort of trading range. At worst, the channel break is bearish and targets a move lower.
GLD Breaks Out Yet Again
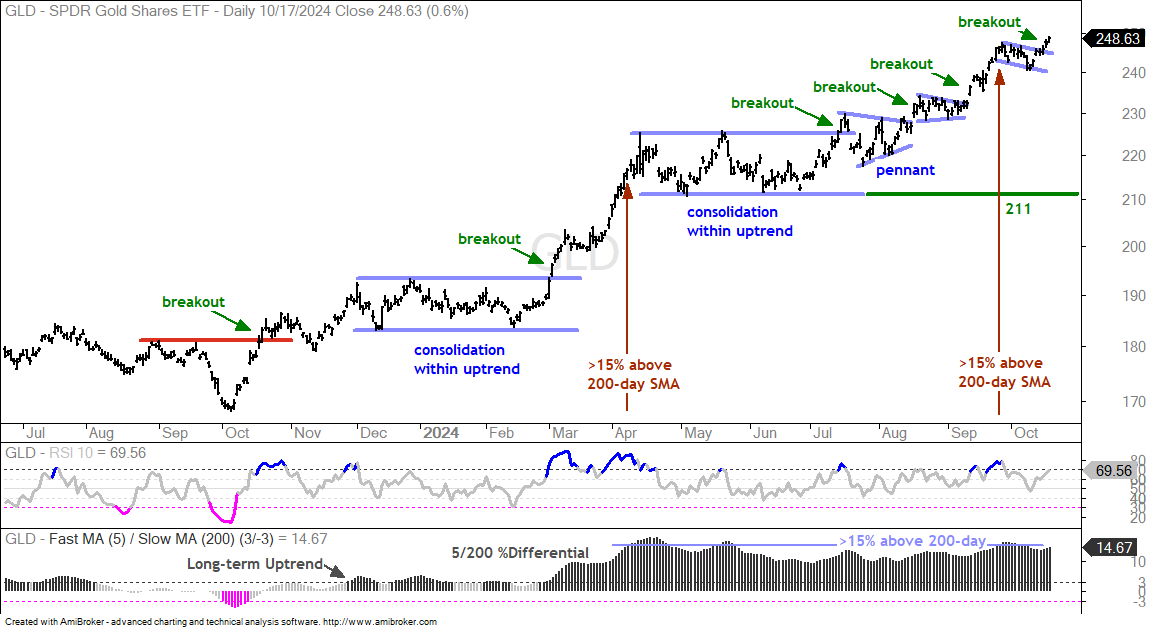
The Gold SPDR (GLD) is a good case in point on overbought conditions within an uptrend. Overbought in an uptrend is not long-term bearish and does not always lead to an extended correction. GLD became overbought on April 8th as the 5/200 %Differential exceeded 15%. It peaked a few days later and then moved into a three month consolidation. GLD became overbought again on September 25th and then formed a two-week falling flag. The ETF broke the flag line this week and tagged another new high. GLD remains in a strong and steady uptrend. Surge, consolidate, breakout, repeat…
Bitcoin Gets a Breakout
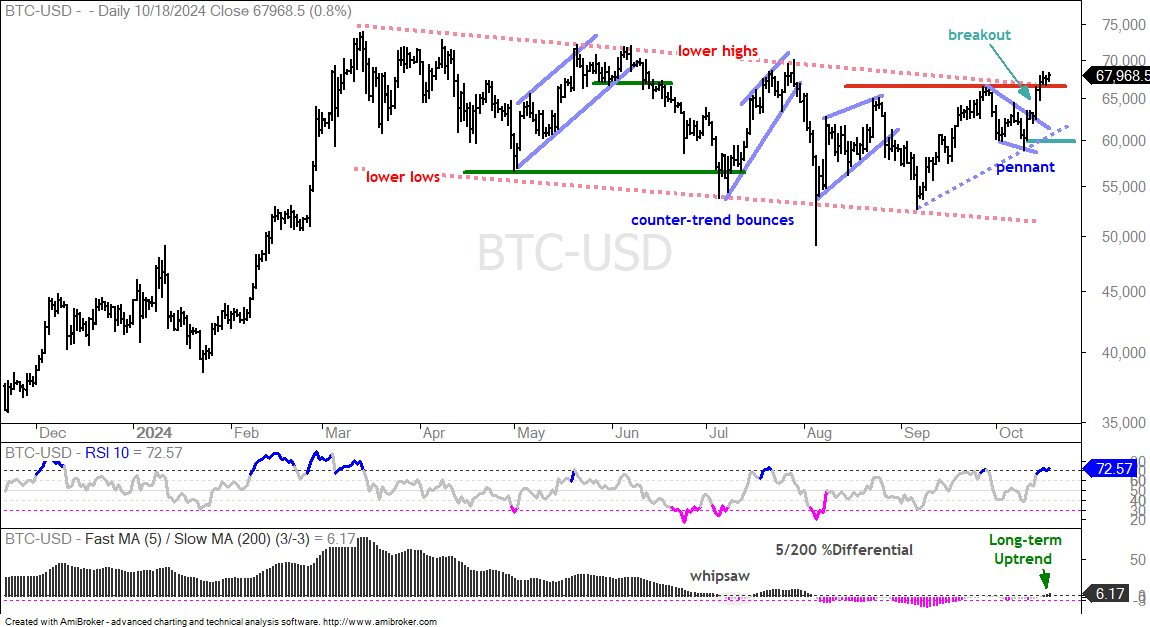
Bitcoin broke out of a short-term pennant with a surge on Monday and closed above long-term resistance on Tuesday. Overall, the crypto broke out of a large falling channel and forged a higher high as it broke the September high. The 5/200 %Differential also signaled a new uptrend as it exceeded +3%. I am using the closing low of the pennant to mark support at 60000. A close below this level would negate the pennant breakout and call for a re-evaluation.