

Video and Report Headlines
- SPY and QQQ Get Short-term Breakouts
- CIBR Tests Breakout Zone
- PANW Forms Short-term Bullish Pattern
- SOXX Surges off Support-Retracement Zone
- Software ETF Falls Back after Breakout
- FAN Successfully Tests Breakout
- Copper Falls to Rising 40-week SMA
- TLT Turns the Corner with a Breakout
- STLD Turns Up at Rising 200-day SMA
The next Chart Trader will be posted on Tuesday morning, August 6th.
This report starts with the short-term breakouts in SPY and QQQ. Battered semiconductor stocks led the surge and we will look at the Semiconductor ETF today. We also cover the Software and Cybersecurity ETFs, which represent key parts of the tech sector. Attention then turns to commodities and bonds as we see a potential reversal zone for copper and a breakout in TLT. Analysis concludes with a leading clean-energy ETF and a steel stock surging off the 200-day SMA.
SPY and QQQ Get Short-term Breakouts
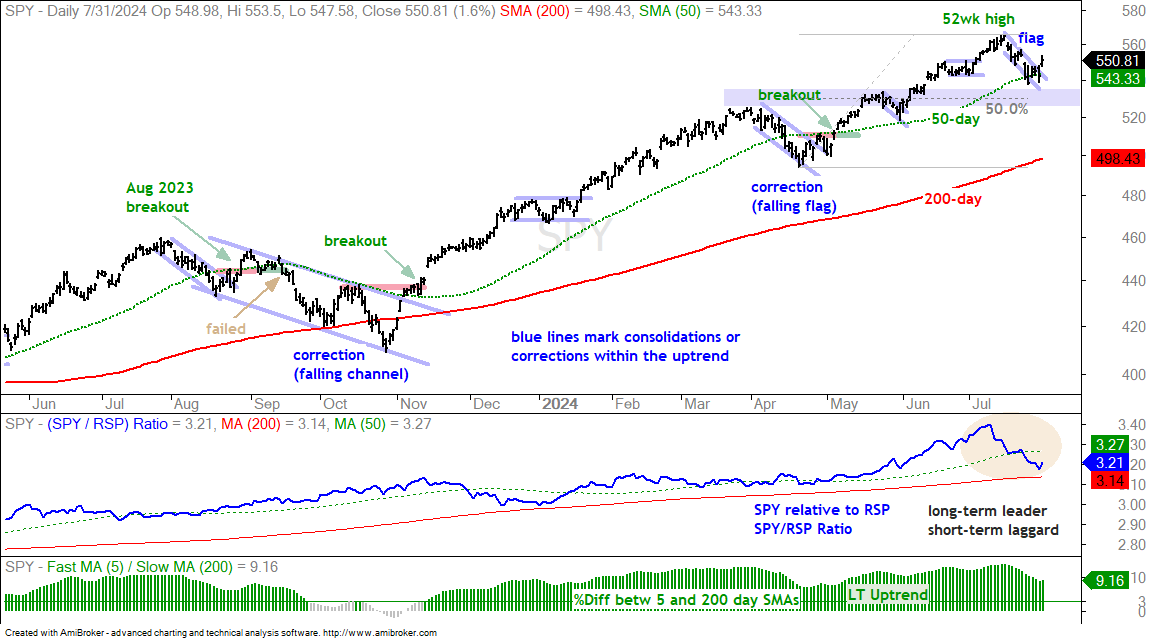
SPY and QQQ are in long-term uptrends. Both are well above their rising 200-day SMAs and the 5/200 %Differentials remain bullish. Both surged from mid April to July and then corrected the last 2-3 weeks. SPY held its 50-day SMA and QQQ broke its 50-day SMA as the latter bore the brunt of selling pressure. This is not surprising because QQQ also gained the most from mid April to mid July. Both formed falling flag patterns and broke out with surges on Wednesday.
The first chart shows SPY hitting a 52-week high on July 16th and falling to its 50-day SMA last week. The ETF firmed for a few days and broke the upper line of the falling flag. Technically, this reverses the short-term slide and argues for a continuation of the bigger uptrend. We can see a successful flag breakout in late April/early May and a failed flag breakout in August 2023. My guess is that short-term flag breakouts succeed around 50% of the time. The current breakout is bullish until proven otherwise. A close below Tuesday’s low would negate this breakout and argue for more corrective price action. Looking closely at the August 2023 and April 2024 flag breakouts, I can see a short 1-2 day pullback after the initial bounce-breakout and then a continuation higher. This little pullback offered an opportunity to partake with a better reward-risk ratio.
The next chart shows QQQ with a break above the upper line of the falling flag. QQQ is still below its 50-day SMA and some follow through is needed to recapture this moving average. Notice how QQQ exceeded its 50-day in August 2023 and April 2024. The August 2023 breakout failed, but the April 2024 breakout succeeded. Again, sometimes we get a 1-3 day pullback after the initial breakout move. This offers a second chance to partake with a better reward-risk ratio. It also provides a short-term resistance level to watch for the follow through move after this 1-3 day pullback. This happened with the breakout on April 26th.
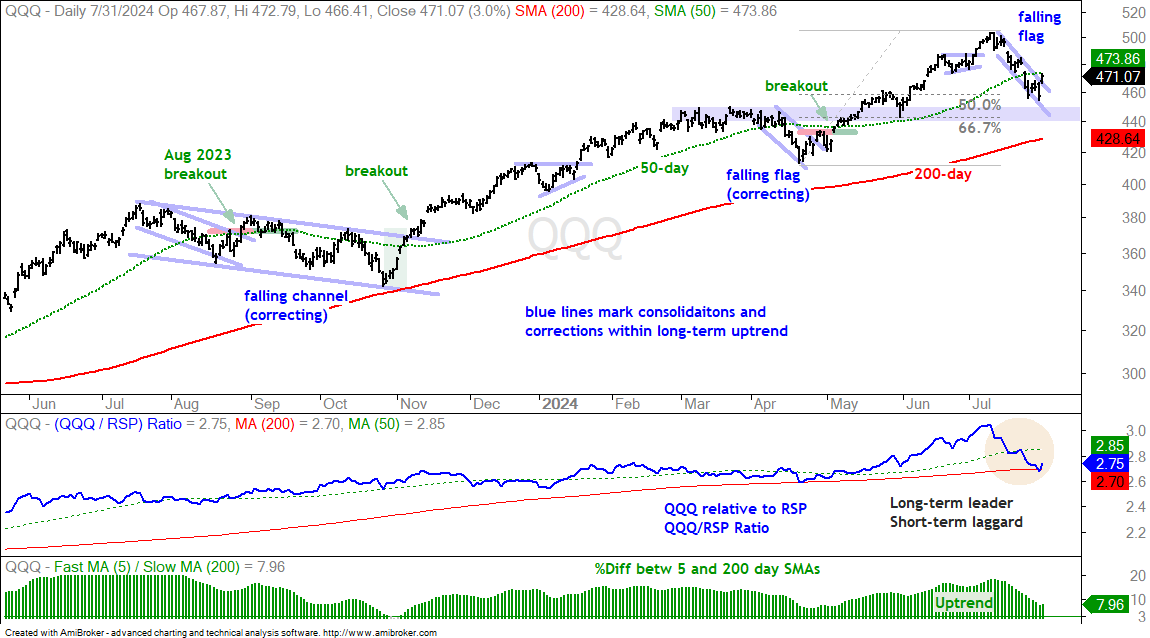
Chart Analysis, Setups and Trading Ideas
The following charts show price bars with the 200-day SMA (red line), the 50-day SMA (green line), the price-relative (ITB/RSP ratio) with the 200-day SMA and the percentage difference between the 5 and 200 day SMAs. On the price chart, I am looking for tradable pullbacks within a bigger uptrend or bullish consolidation patterns. With the price-relative, I am looking for relative strength. The price-relative (ITB/RSP ratio) rises when the ETF or stock outperforms. And finally, the percentage difference between the 5 and 200 day SMA is bullish (long-term uptrend) with a move above 3% and stays bullish until a move below -3%. This basically measures the tide or long-term bias.
CIBR Tests Breakout Zone
The Cybersecurity ETF (CIBR) is testing its breakout zone with the July pullback. Overall, CIBR is in a long-term uptrend. It is above its rising 200-day SMA and the 5/200 %Differential remains bullish. After hitting a new high in February, the ETF corrected with a falling wedge into June. This decline retraced almost 50% of the prior advance and returned to the rising 200-day SMA (red line). CIBR then broke out in late June and extended higher in early July. And then Crowdstrike (CRWD) hit. CRWD was leading in early July and then fell 40%.
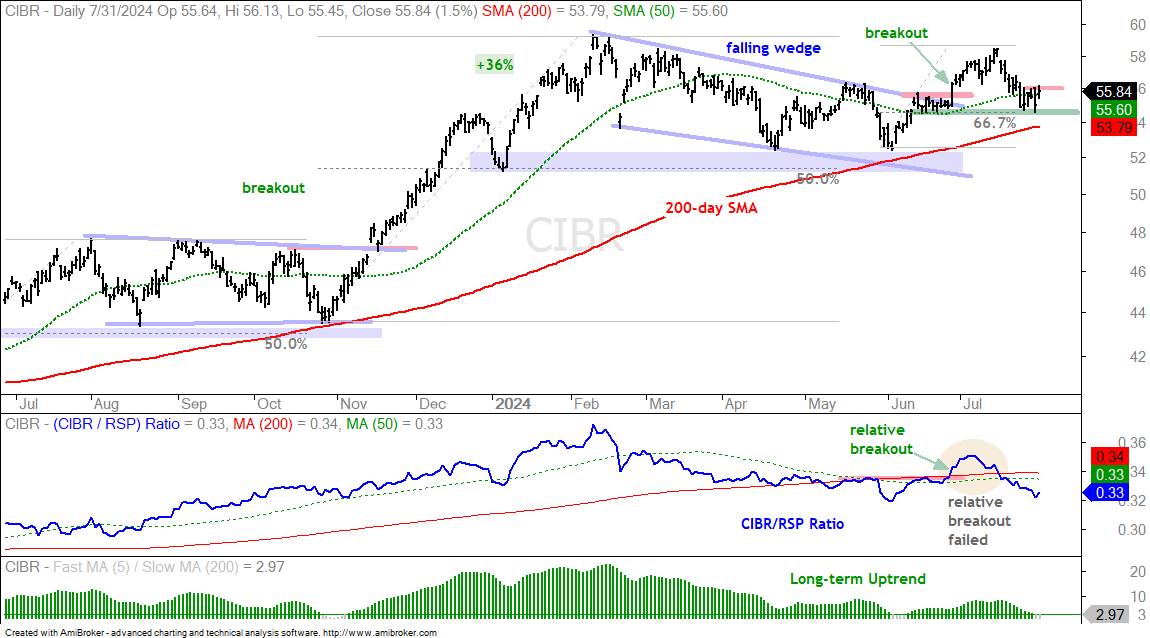
Despite the recent woes, CIBR is trading in a Support-Retracement Zone and chartists should be on guard for a short-term breakout. The July decline retraced around 67% of the prior advance and the late June consolidation offers support. A close above 56 would trigger a breakout and reverse the short-term slide. I would then set a re-evaluation level at 54.
PANW Forms Short-term Bullish Pattern
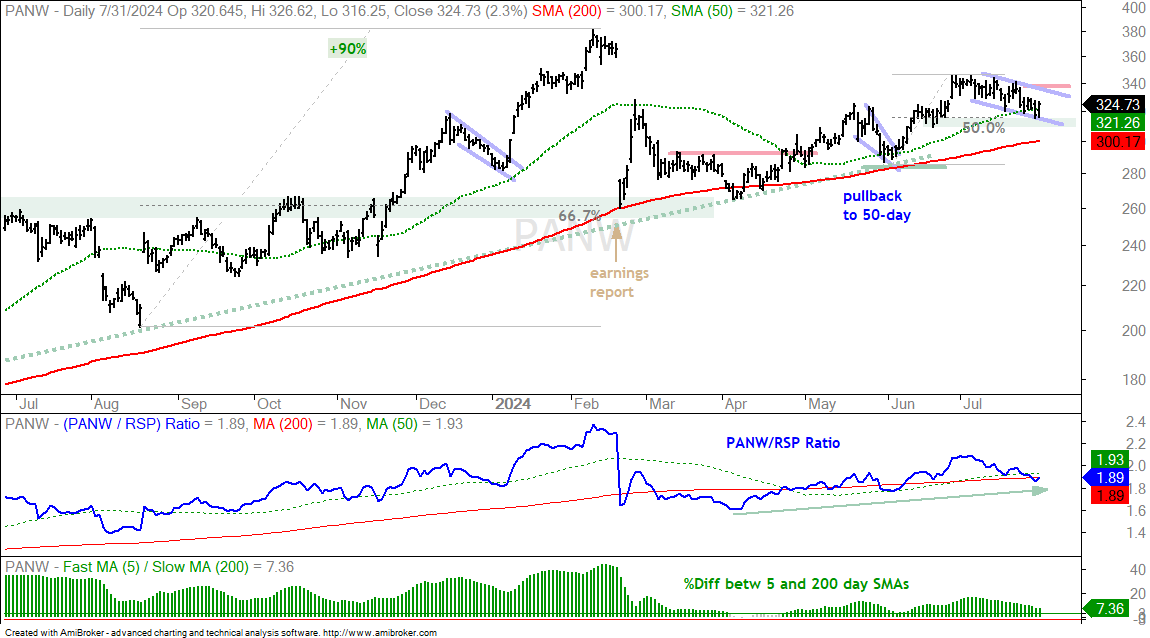
The next chart shows Palo Alto Networks (PANW) falling 30% in February, hitting the 200-day SMA and working its way higher the last five months. PANW held its 200-day SMA for the most part and the 5/200 %Differential did not turn bearish (cross below -3%). CrowdStrike (CRWD), in contrast, decisively broke its 200-day SMA and the 5/200 %Differential broke below -3%. Returning to PANW, the stock pulled back in July and is currently at a Support-Retracement Zone. This pullback retraced around 50% of the prior bounce and there is support from the late June lows. A flag of sorts is also forming and a breakout at 340 would be bullish.
SOXX Surges off Support-Retracement Zone
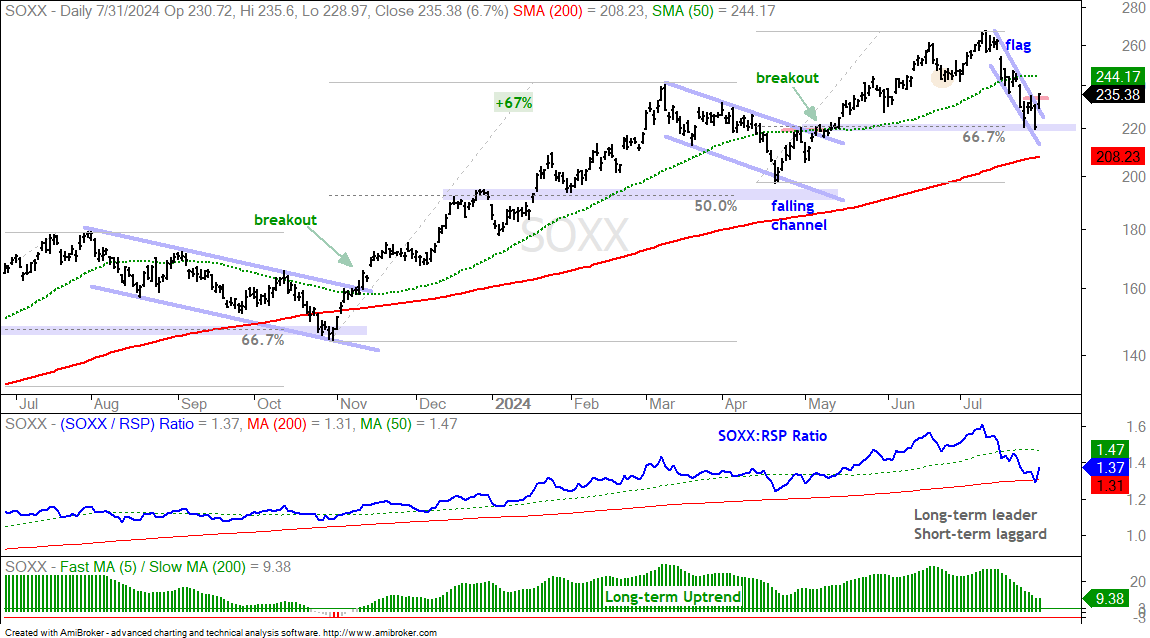
A Support-Retracement Zone is an area to watch for a reversal or breakout. As the name suggests, there are two parts: key retracement levels and support levels. I am using 33, 50 and 67 percent to mark the retracements. I am using broken resistance or prior lows to mark support. Sometimes, I also use the 50 and 200 day SMAs. The next chart shows the Semiconductor ETF (SOXX) hitting a Support-Retracement Zone and breaking short-term resistance. First and foremost, note that the long-term trend is up as SOXX hit a new high less than a month ago and it remains well above the rising 200-day SMA. The July decline retraced around 67% of the prior advance and returned to the May breakout level (broken resistance). Thus, the 220 area marks a Support-Retracement Zone (blue shading). SOXX broke short-term resistance with a surge on Wednesday. I will treat this breakout as bullish until proven otherwise. 220 marks re-evaluation support.
Software ETF Falls Back after Breakout
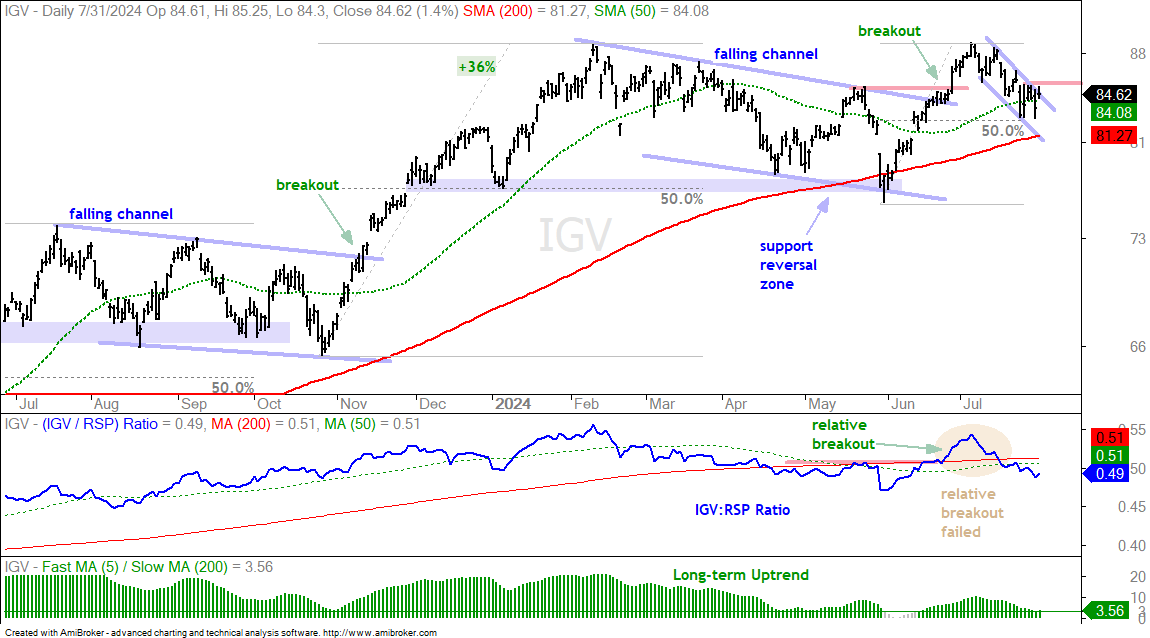
The Software ETF (IGV) sports a pattern similar to CIBR. IGV surged off a Support-Retracement Zone and broke falling channel resistance in late June. After a 17% advance, the ETF fell back below the 50-day SMA in July. The long-term trend is up and IGV is still above its rising 200-day SMA. I view the July decline as a tradable pullback after the July surge. A falling flag formed and a breakout at 85.5 would be bullish.
FAN Successfully Tests Breakout
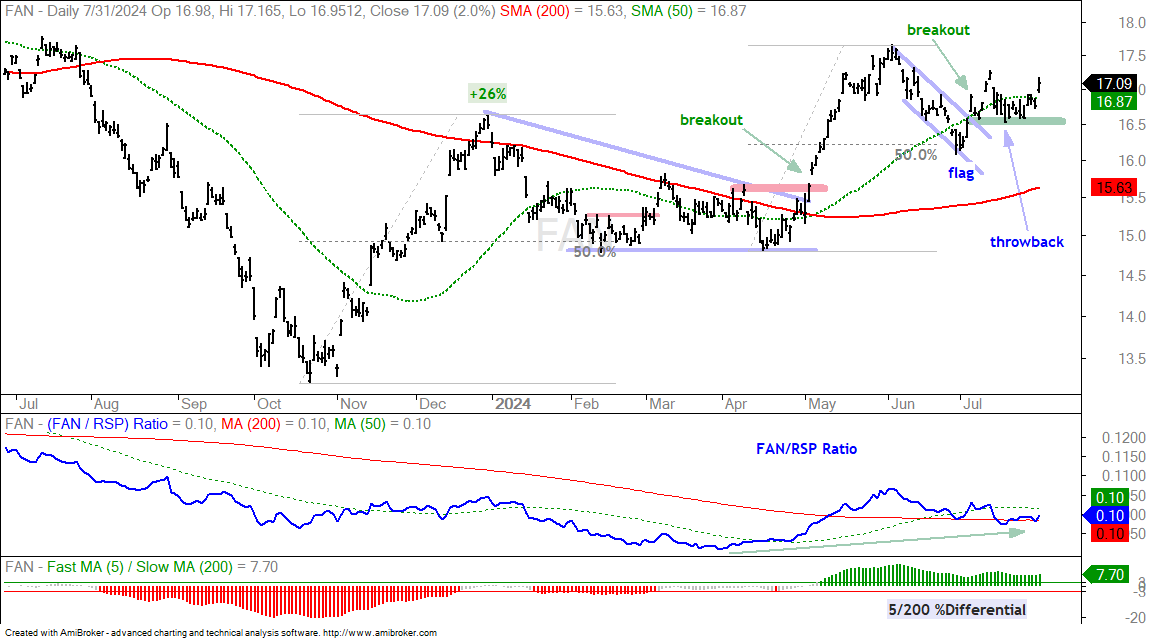
The next chart shows the Wind Energy ETF (FAN) within a long-term uptrend. FAN is above the 200-day SMA and the 5/200 %Differential moved above +3% in early May (green bars in bottom window). FAN broke out of a wedge pattern in May and surged into June. It then corrected by retracing 50% with a falling flag into July. FAN broke out again with a surge in early July and fell back to the breakout zone in mid July (green line). The ETF bounced off this level over the last five days and this reinforces support at 16.50. Overall, this flag breakout signals a continuation of the bigger uptrend. I would expect a move to new highs and re-evaluate on a close below 16.50.
Copper Falls to Rising 40-week SMA
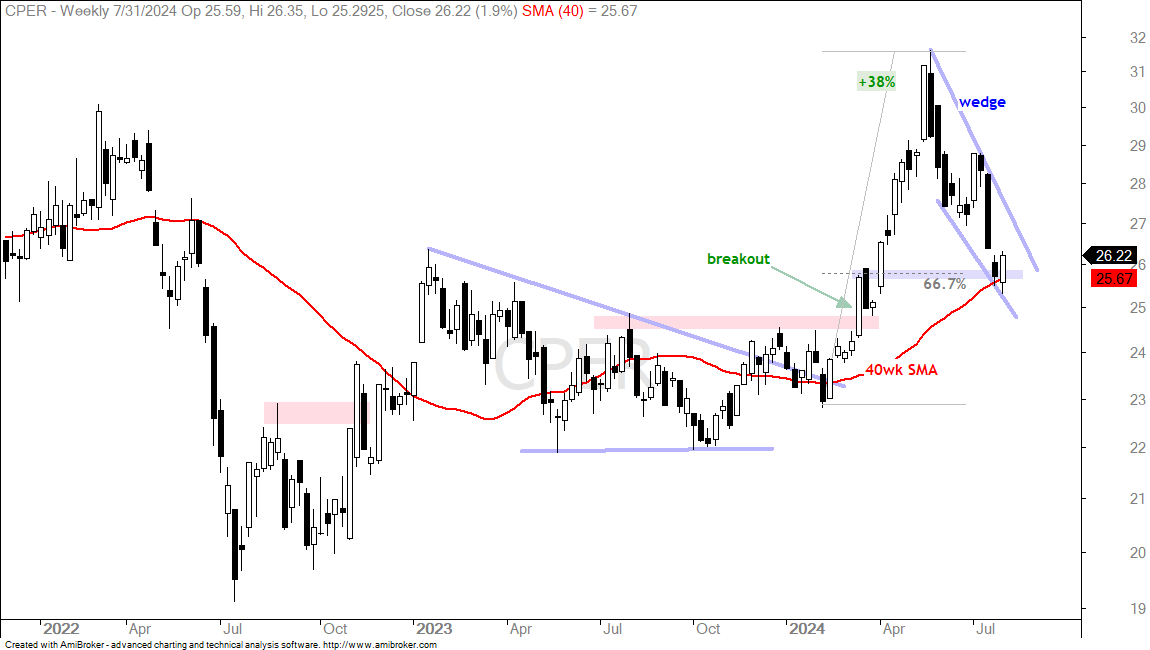
The next chart shows weekly candlesticks for the Copper ETF (CPER). CPER surged over 30% from mid February to mid May and then fell hard into July. The ETF is showing signs of firmness this week as it hit a Support-Retracement Zone. The blue shading marks prior resistance from the March high, the 67% retracement line and the rising 40week SMA. This is an area to watch for a reversal.
TLT Turns the Corner with a Breakout
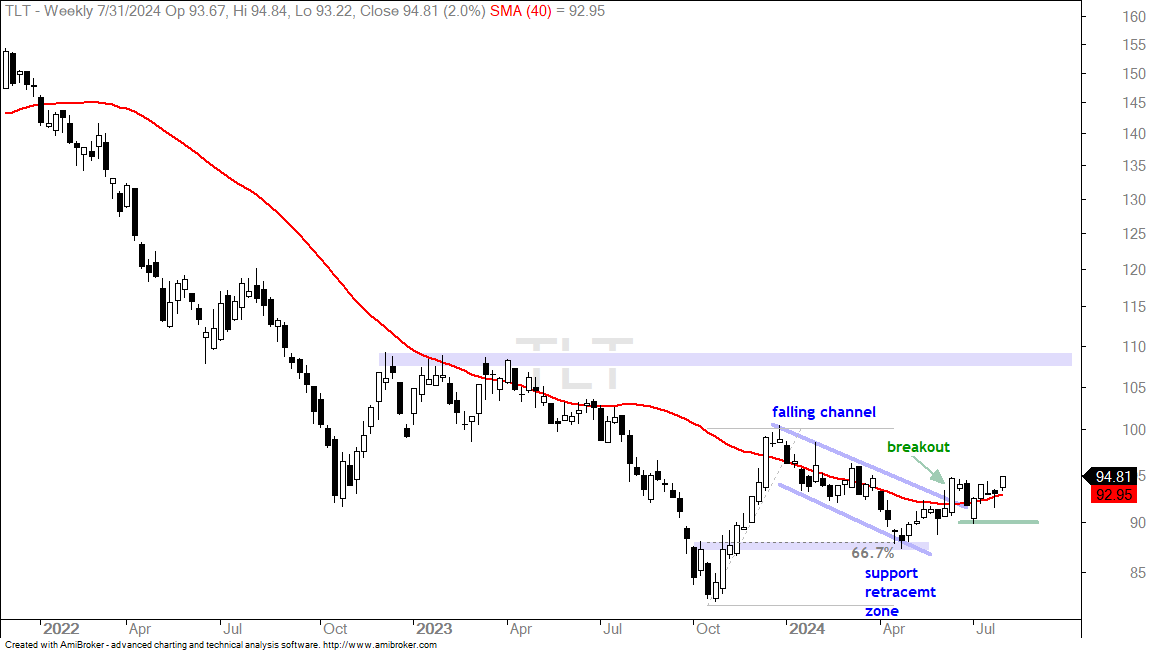
The Fed has come and gone with the policy statement hinting at a rate cut in September. Short-term rates already reflect this shift as the 2-yr yield fell from 5% in May to 4.3% in July. The chart below shows the 20+ Yr Treasury Bond ETF (TLT) making a big move in late 2023 and then falling back into April 2024. This decline formed a falling channel that retraced 67% of the advance and returned to the breakout zone, which turns support. TLT broke out of the channel with a surge in mid June and this breakout signals a continuation of the prior advance. I am targeting a move to the 107-109 area and will set re-evaluation support at 90.
STLD Turns Up at Rising 200-day SMA
The 200-day SMA sometimes works as a support zone, and sometimes it doesn’t. This is how it works with technical indicators. They did not work all the time. We often see battles around the 200-day where price oscillates around this long-term moving average. I use the 200-day SMA as a general guide for the long-term trend. This is also where the 5/200 %Differential comes into play. It turns bullish with a move above +3%, which signals a “definitive” break above the 200-day SMA. It turns bearish with a move below -3%, which signals a “definitive” break below the 200-day. Definitive is in quotes because we cannot fully eliminate whipsaws. The chart below shows STLD battling its 200-day SMA from August to October and then making a definitive break as the 5/200 %Differential exceeded +3% in early November.
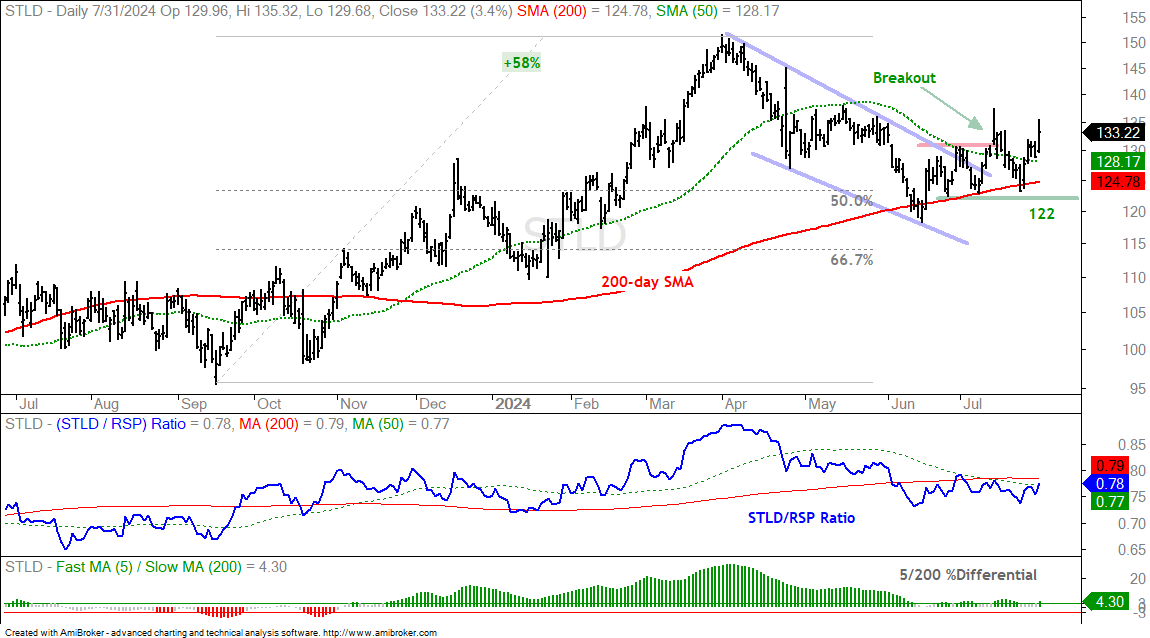
Fast forward to June-July 2024 and SLTD is again battling the 200-day SMA. Overall, the stock advanced 58% into April and fell back to the 200-day SMA with a falling wedge. This wedge retraced 50-67 percent of that advance. Both the retracement amount and pattern are typical for corrections within a bigger uptrend. STLD is making waves again as it broke wedge resistance and moved higher the last seven weeks. STLD is up 9.7% the last 32 days and SPY is up just 1.5%. I view this breakout as bullish and would mark re-evaluation support at 122.