The next Chart Trader will be posted on Thursday morning, July 18th.
This report starts with the long-term picture, which remains bullish. The %Above 200-day SMA and 26-wk High-Low Percent indicators support the current bull market, while the 4wk High-Low Percent indicators support the short-term uptrends for SPY and QQQ. Small-caps and mid-caps came to life over the last few days with outsized moved and breakouts. We will cover these breakouts in detail. The rotation into the non-tech area of the market means we will also feature some non-tech stocks. Today, we have a materials stock (VMC), a consumer discretionary stock (HD) and two industrials (FAST, CMI). The Cybersecurity ETF (CIBR) remains strong and PANW is setting up short-term. We also feature a breakout in an electronic payments stock (SQ).
%Above 200-day SMA Indicators Remain Bullish
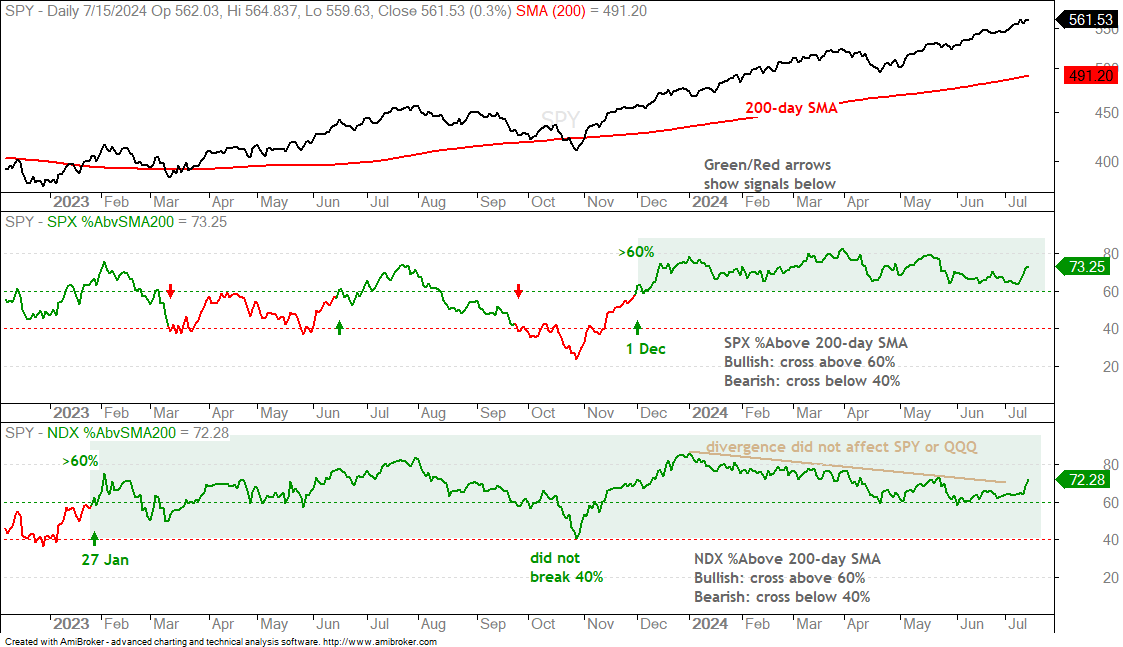
The %Above 200-day SMA indicators remain bullish, and improved over the past week. NDX %Above 200-day turned bullish with a move above 60% on 27-Jan-2023 and stayed bullish (bottom window with green shading). SPX %Above 200-day turned bullish on 1-Dec-2023 and held above 60% throughout 2024. Both indicators are currently above 72%. Thus, the vast majority of S&P 500 and Nasdaq 100 stocks are above their 200-day SMAs. This clearly supports the bull market.
Before leaving this chart, notice that the bearish divergence in NDX %Above 200-day did not affect performance for SPY and QQQ this year. NDX %Above 200-day moved from 85% in January to 59% in May, but always remained well above 50%. The cup is clearly half full when well above 50%. The lesson here: it is usually best to ignore bearish divergences in bull markets because these usually resolve in the direction of the bigger trend, which is up.
26wk HiLo% Supports Bull Market
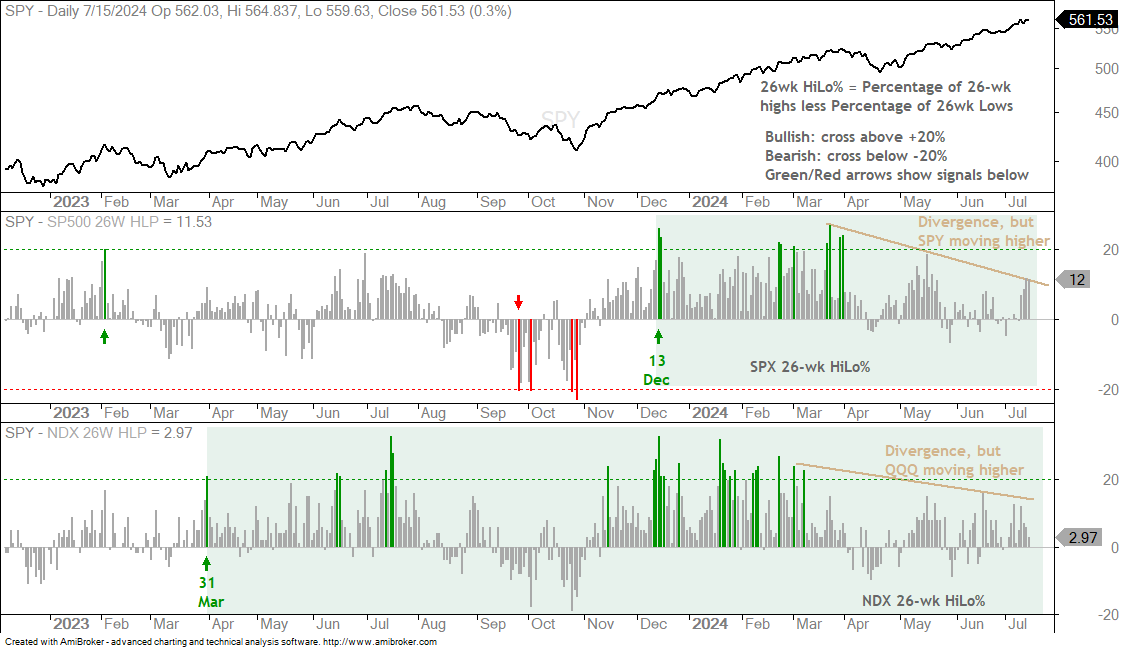
The 26-wk High-Low Percent indicators also remain bullish, even though fewer stocks are recording 26-week highs. NDX 26wk HiLo% turned bullish with a move above 20% on 31-Mar-2023 and remains bullish. Notice that it did not dip below -20% in October and the bullish signal held. SPX 26wk HiLo% turned bullish on 13-Dec-2023 and remains bullish. These indicators were regularly above 20% in February and March, but have not cleared the 20% level the last three months. This is a bearish divergence, but it has not affected SPY and QQQ. Again, we should ignore bearish divergences in bull markets and focus on the signal. Both indicators are on bull signals right now and support the bull market.
4wk High-Low Percent Combo Remains Bullish
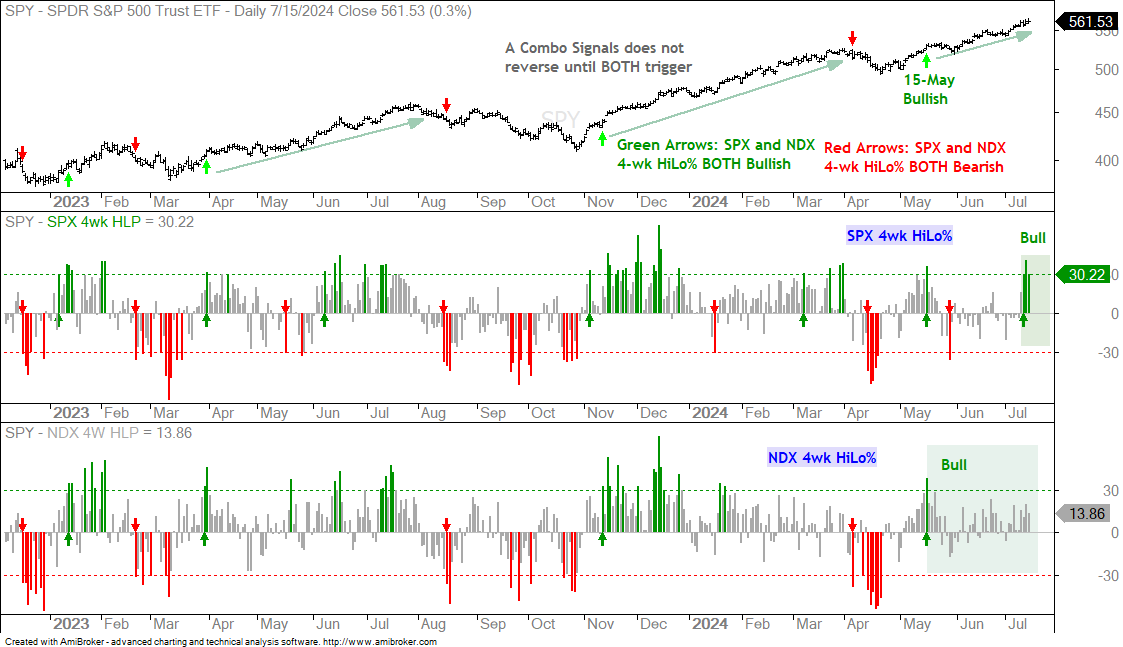
The next chart shows 4wk HiLo% for the S&P 500 and Nasdaq 100. These individual indicators turn bullish with a move above 30% and bearish with a move below -30%. For short-term market signals, a bullish combo signal triggers when both are bullish and this remains in place until BOTH turn bearish. A bullish combo signal does not reverse when just one turns bearish. SPX and NDX 4wk HiLo% turned bullish on May 15th for a bullish combo signal. SPX 4wk HiLo% turned bearish in late May, but the bullish combo signal was not reversed because NDX 4wk HiLo% stayed bullish. Most recently, SPX 4wk HiLo% surged back above 30% to turn bullish and both indicators are bullish again.
SPY Extends on Long and Short Term Uptrends
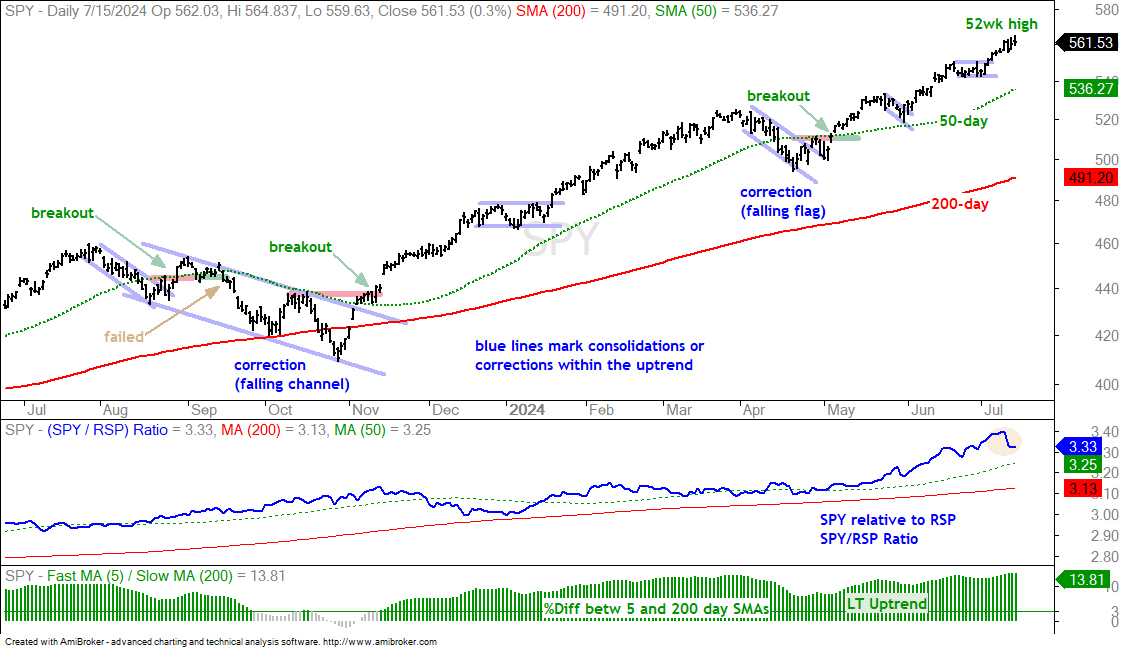
SPY remains in a long-term uptrend as the ETF tagged another 52-wk high on Monday. SPY is a broad ETF with stocks from all eleven sectors. It benefitted from the recent rotation out of large-cap tech and into other areas of the market. There are no tradable setups on this chart, just a leading uptrend.
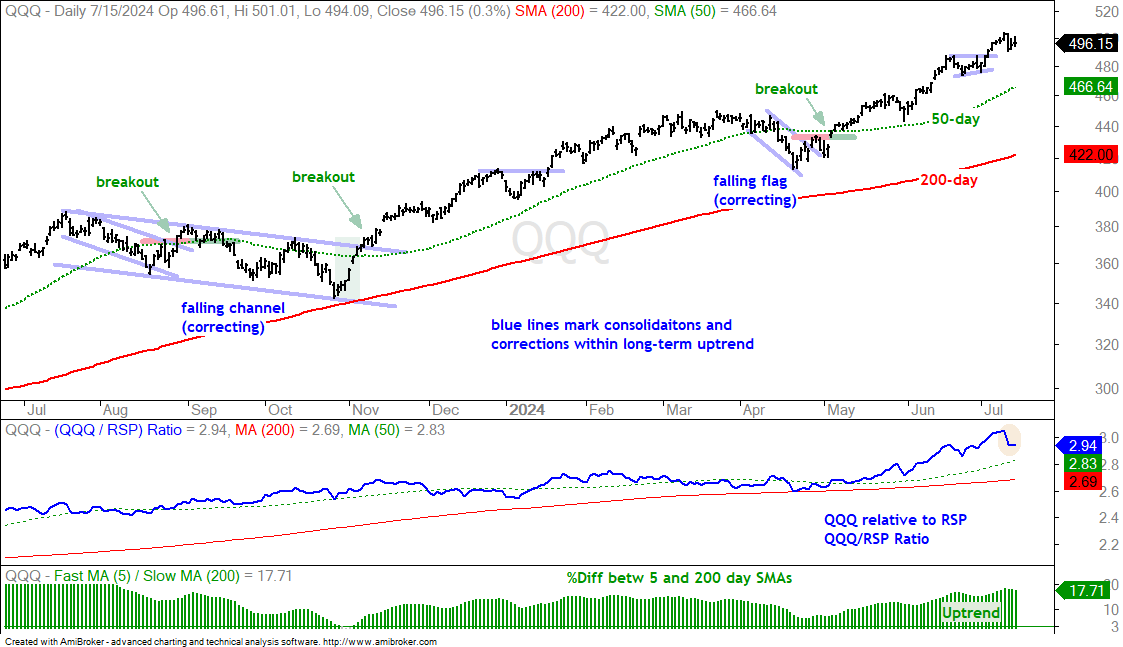
QQQ tagged a 52-week high last week and then fell sharply (-2.2%) on Thursday as money moved out of large-cap tech stocks. The ETF firmed on Monday-Tuesday, but the bounce over the last two days was feeble. Even so, QQQ remains in a short-term uptrend. There are no tradable setups on this chart.
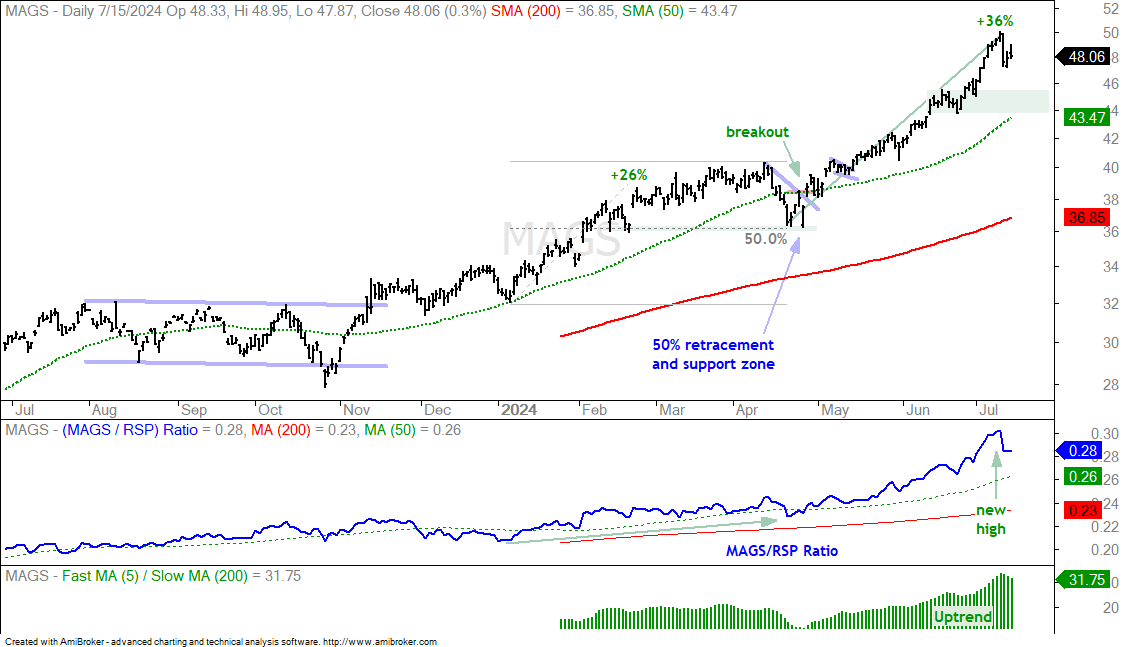
As with QQQ, the Mag7 ETF (MAGS) fell sharply on Thursday (-4.5%) as money moved out of large-cap tech stocks. This one day decline is the sharpest since the ETF began trading (April 2023). It represents an outsized move that would signal the start of a corrective process. MAGS was up 36% from mid April to early July and the 5-day SMA was over 30% above the 200-day SMA (bottom window). These are extremes that could lead to a correction or pullback. The rising 50-day SMA and mid June consolidation mark a possible target zone (44-45).
Equal-weights, Mid-caps and Small-caps Surge
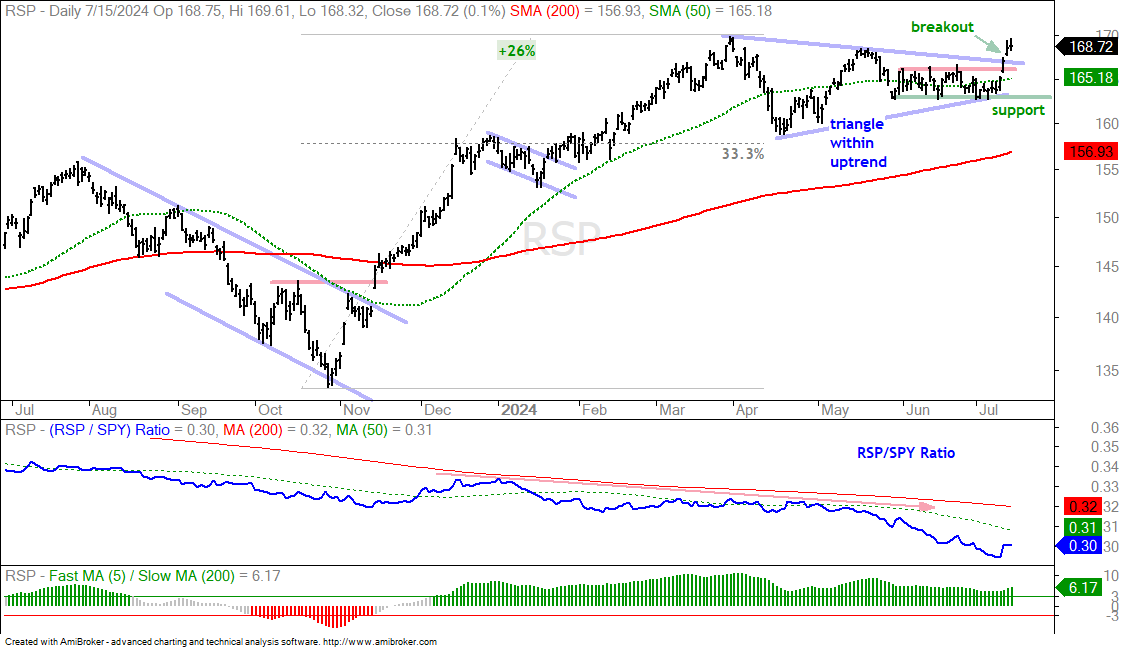
Thursday was a rather strange day because SPY fell .90% and the S&P 500 EW ETF (RSP) advanced 1.2%. These ETFs are both based on S&P 500 stocks. SPY is weighted by market gap and RSP is equally weighted. The latter represents performance for the “average” stock in the S&P 500. Money moved into average stocks, small-caps and mid-caps on Thursday. The chart below shows RSP hitting a new high in March, forming a triangle consolidation into July and breaking out with a big move the last four days. This breakout signals an end to the corrective period and a resumption of the bigger uptrend. The May-June lows mark support and a break below these lows would be bearish.
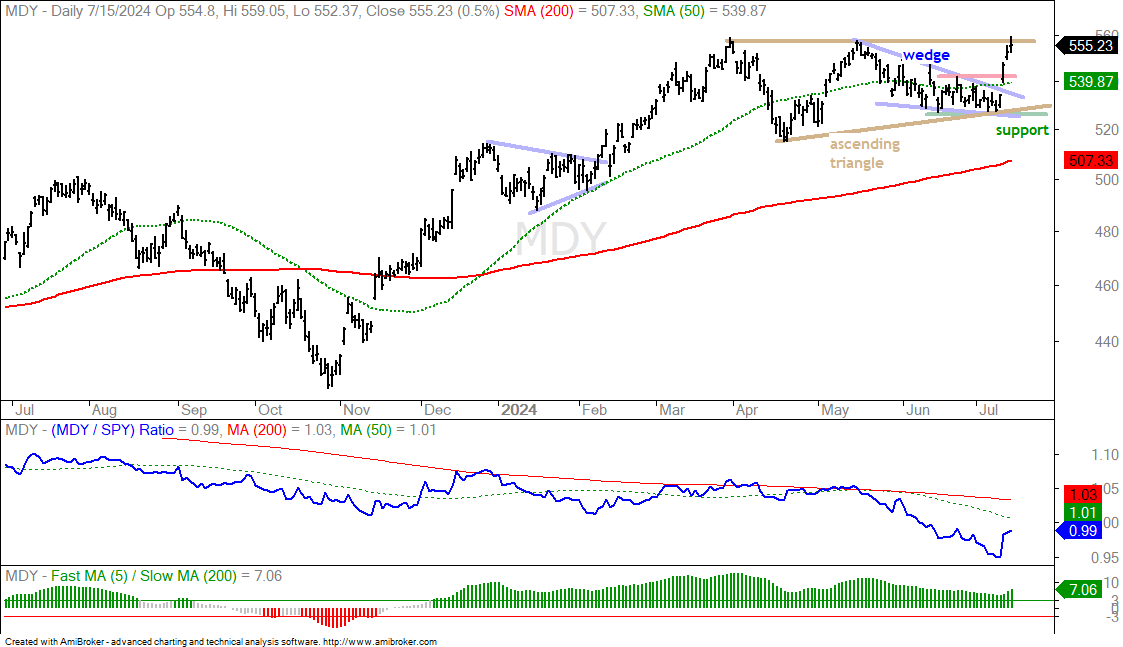
The next chart shows the S&P MidCap 400 SPDR (MDY) with a falling wedge and a breakout over the last four days. This breakout reverses the downswing within a bigger bullish pattern. The yellow lines show an ascending triangle taking shape. This is a bullish continuation pattern and a break above the April-May highs would confirm this pattern. I expect a breakout and new high because the long-term trend is up. The June lows mark support and a break here would be bearish.
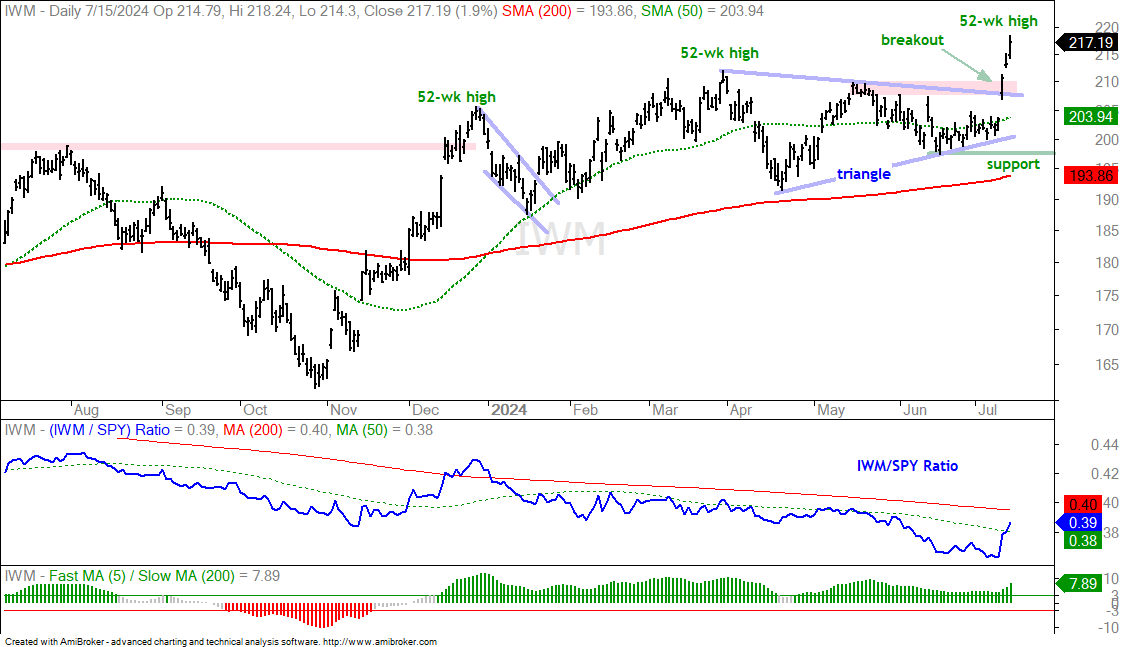
RSP and MDY were covered on June 27th as these patterns set up. The next chart shows the Russell 2000 ETF (IWM) with a breakout and new high as well. IWM is up a staggering 7.84% the last four trading days. This is the sharpest four day surge since the move off the covid low in March 2020. Such outsized moves typically jump-start an uptrend that could extend for months. The breakout zone around 208-210 turns first support should we see a throwback.
The following charts show price bars with the 200-day SMA (red line), the 50-day SMA (green line), the price-relative (ITB/RSP ratio) with the 200-day SMA and the percentage difference between the 5 and 200 day SMAs. On the price chart, I am looking for tradable pullbacks within a bigger uptrend or bullish consolidation patterns. With the price-relative, I am looking for relative strength. The price-relative (ITB/RSP ratio) rises when the ETF or stock outperforms. And finally, the percentage difference between the 5 and 200 day SMA is bullish (long-term uptrend) with a move above 3% and stays bullish until a move below -3%. This basically measures the tide or long-term bias.
Vulcan Materials Surges off 200-day SMA
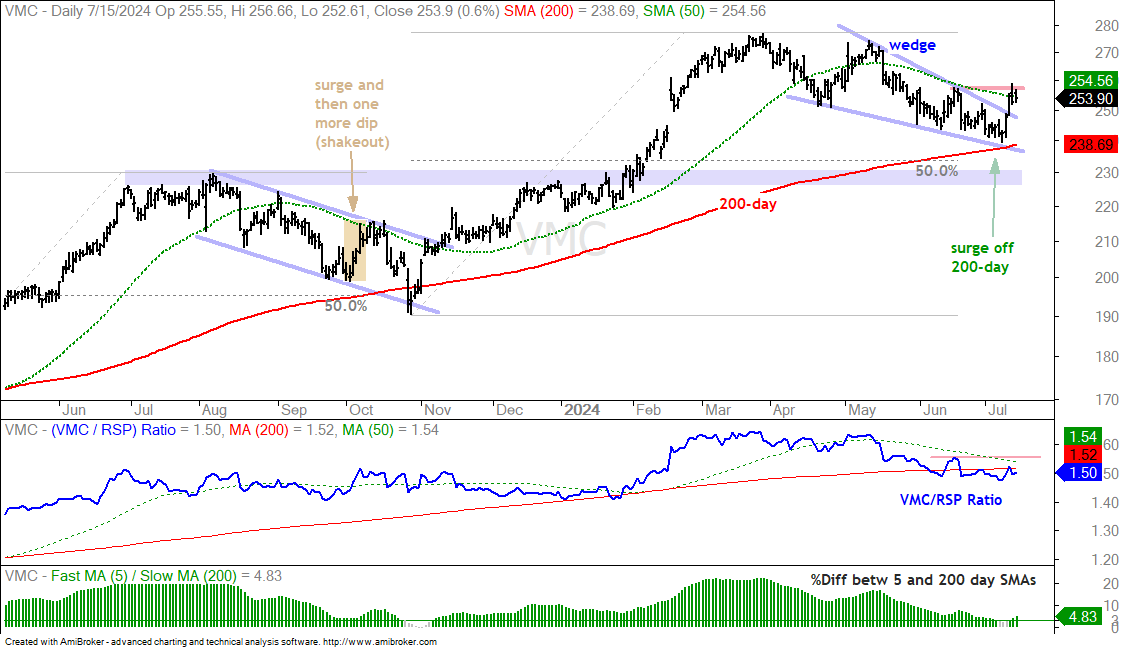
Vulcan Materials (VMC) is part of the Materials SPDR (XLB) and the infrastructure trade. VMC is in a long-term uptrend as it hit a new high in March and the 5/200 %Differential (bottom window) remains bullish. The stock corrected from April to July and underperformed as money moved into the tech sector. Despite this decline, I view the falling wedge as a correction within the bigger uptrend. The pattern is typical for corrections and the retracement amount is a little less than 50%. VMC is making waves again as it surged to the 50-day SMA and broke the wedge line. A break above the mid June high (red line) would forge a higher high. This would signal an end to the correction and a resumption of the bigger uptrend.
Note that VMC formed a similar setup in September as it surged to the 50-day SMA. The broader market fell sharply into October and VMC dipped below the 200-day. This surge did not lead to a breakout, but the stock quickly recovered and broke out in mid November. I view the current surge as the first bullish signal and expect a breakout. Sometimes, however, we see one more dip to shake out the weak hands and pave the way for a robust breakout.
Home Depot Reverses in Key Retracement Zone
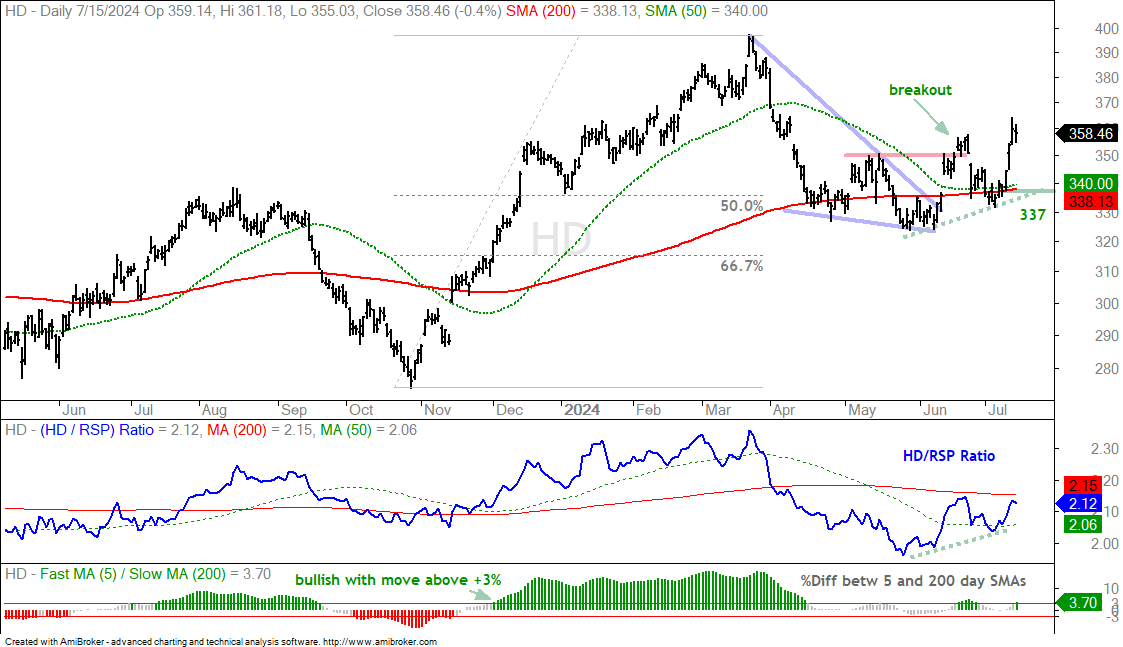
The next chart shows Home Depot (HD), which is part of the Consumer Discretionary sector and the Housing trade. The stock also fell on hard times as it declined from 400 to 320 in the spring. HD fell back to the 200-day SMA (red line) and battled this key moving average from April to July. This decline formed a falling wedge that retraced 50-67 percent of the prior advance. Again, the pattern and retracement are normal for corrections within bigger uptrends. HD broke out with a surge in June, fell back into early July and surged above the June high last week. This reversal suggests that the correction has ended and the bigger uptrend is resuming. A close below the 200-day SMA (337) would call for a re-evaluation.
Cummins Breaks Channel Resistance
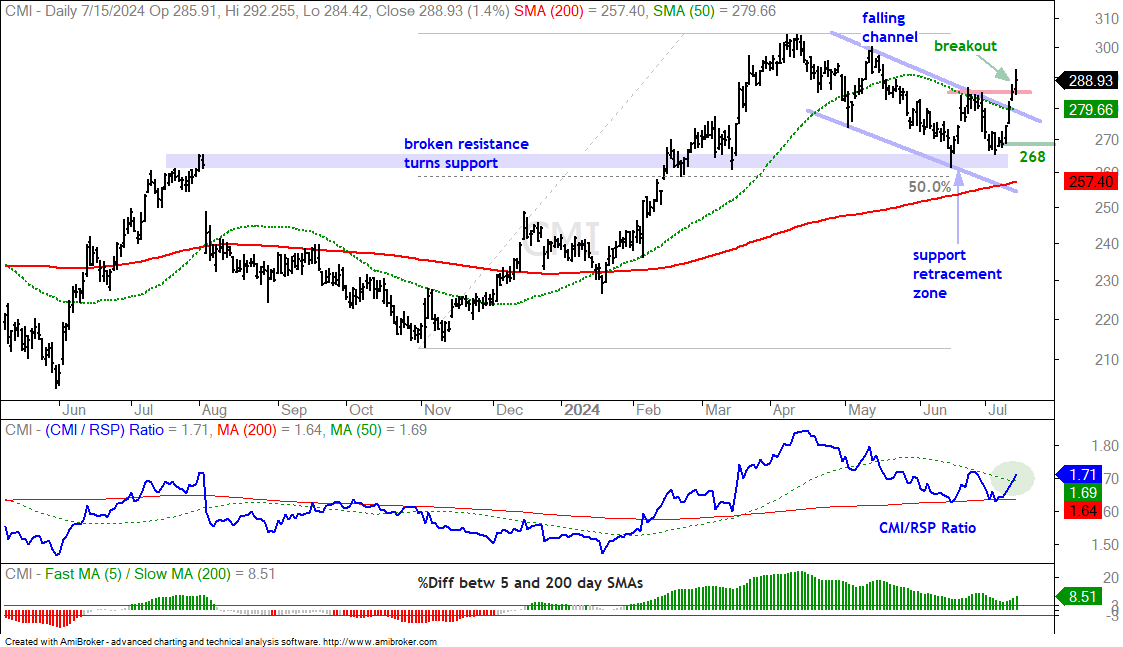
The next chart shows Cummins (CMI) with a similar setup. CMI is part of the Industrials SPDR (XLI). CMI hit a Support-Retracement Zone in the 260 area and broke the June high with a surge the last four days. A close below 268 would erase the four day surge and call for a re-evaluation.
Fastenal Recovers after Breaking 200-day SMA
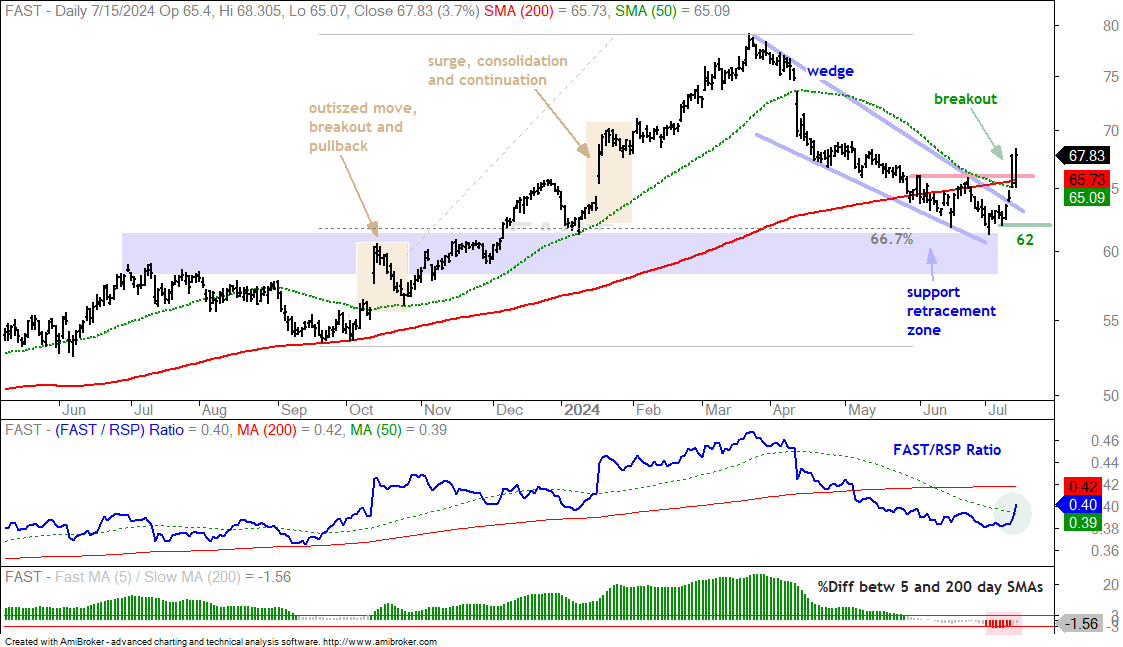
Fastenal (FAST) is also part of the Industrials SPDR (XLI), but its correction was quite deep. FAST formed a falling wedge that retraced 67% of the prior advance and broke the 200-day SMA. This decline also pushed the 5-day SMA more than 3% below the 200-day SMA (red shading in lower window). Even though this signals a downtrend, it could be an overshoot because the stock surged back above the 200-day SMA. FAST also broke the June resistance level and 50-day SMA. Also notice that this surge occurred at the top of a Support-Retracement Zone (blue shading). The breakout reverses the falling wedge downtrend and signals the start of an uptrend.
There were some big moves over the last four days. Many of these were outsized moves that triggered breakouts that signal the start of an uptrend. There are three possibilities now: follow through with further gains, a short pullback or a failed breakout. On the FAST chart above, we can see a small consolidation after the January surge. There was no real pullback then. There was, however, a short pullback after the October surge and breakout. For the current breakout, the breakout zone, 50-day SMA and 200-day SMA mark the first support area to watch should we get a short pullback. It is more difficult to pick a level that would suggest a breakout failure. It is important that the four day surge hold. A close below 162 would negate this surge and call for a re-evaluation.
CIBR Holds Breakout as PANW Consolidates
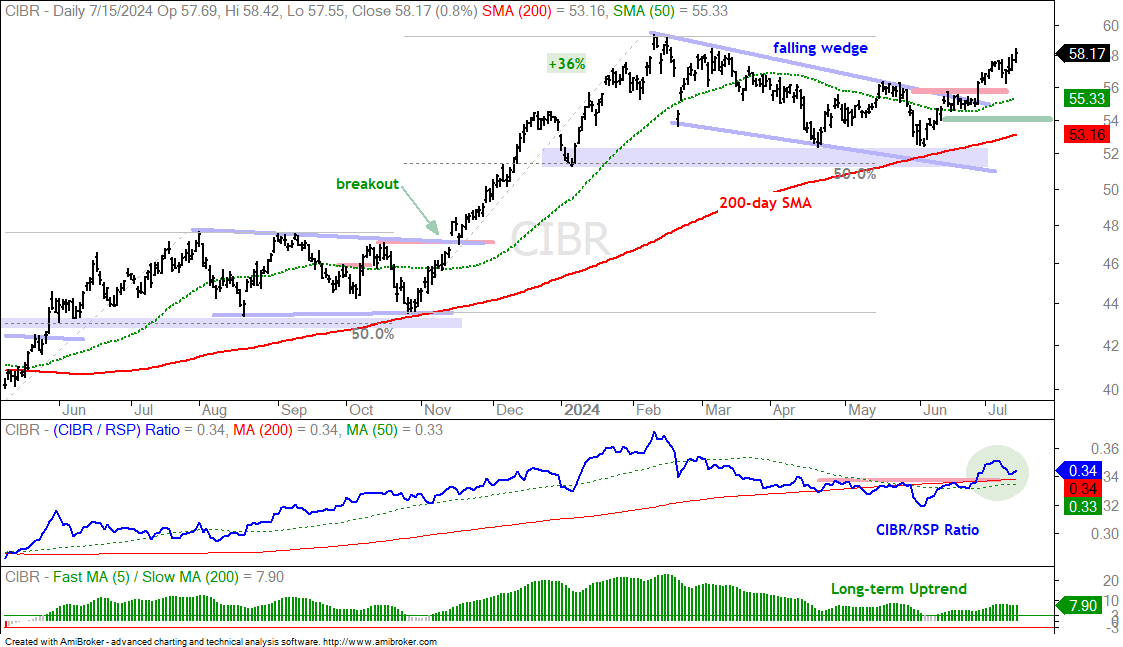
The next chart shows the Cybersecurity ETF (CIBR) getting a breakout on June 27th. Note that CIBR and SOXX were featured the morning before this breakout. CIBR followed though on this breakout with further gains the last two weeks. The green line marks the re-evaluation level at 54.
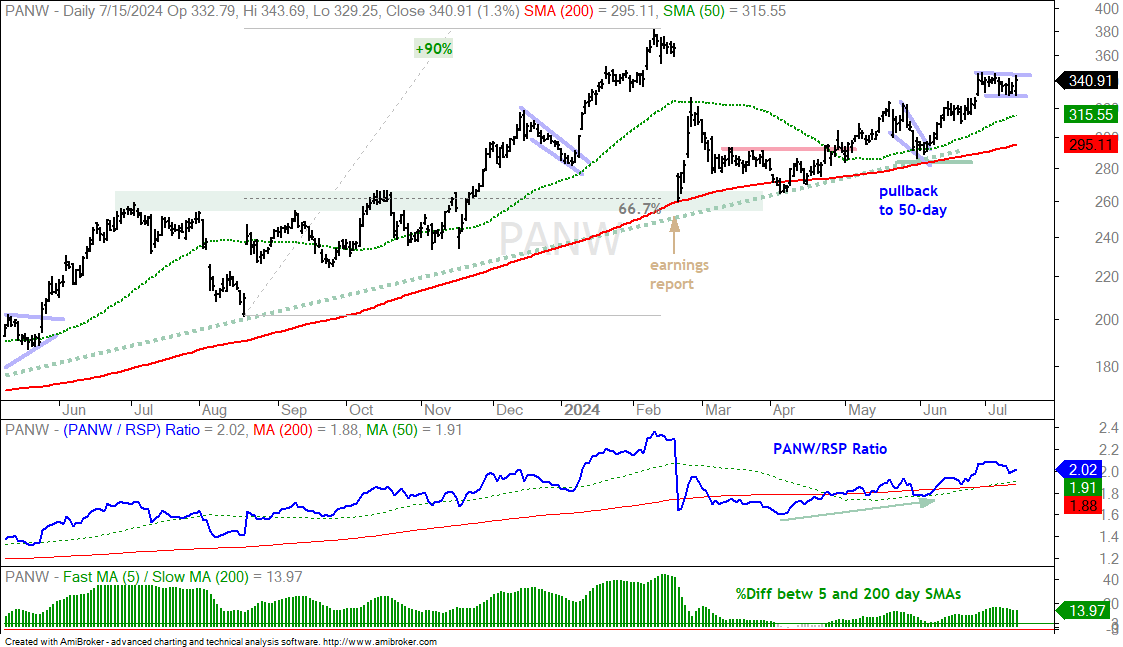
The next chart shows Palo Alto Networks (PANW), which was featured on June 11th (along with two other cybersecurity names). PANW was hit hard after earnings in mid February, but found its footing and worked its way higher since April. The stock is above the rising 200-day SMA and the 5/200 %Differential remains bullish. Short-term, PANW consolidated with a small flag and this is a bullish continuation pattern. A breakout here would signal a continuation higher and target a move towards the February highs.
Square Surges off Support-Retracement Zone
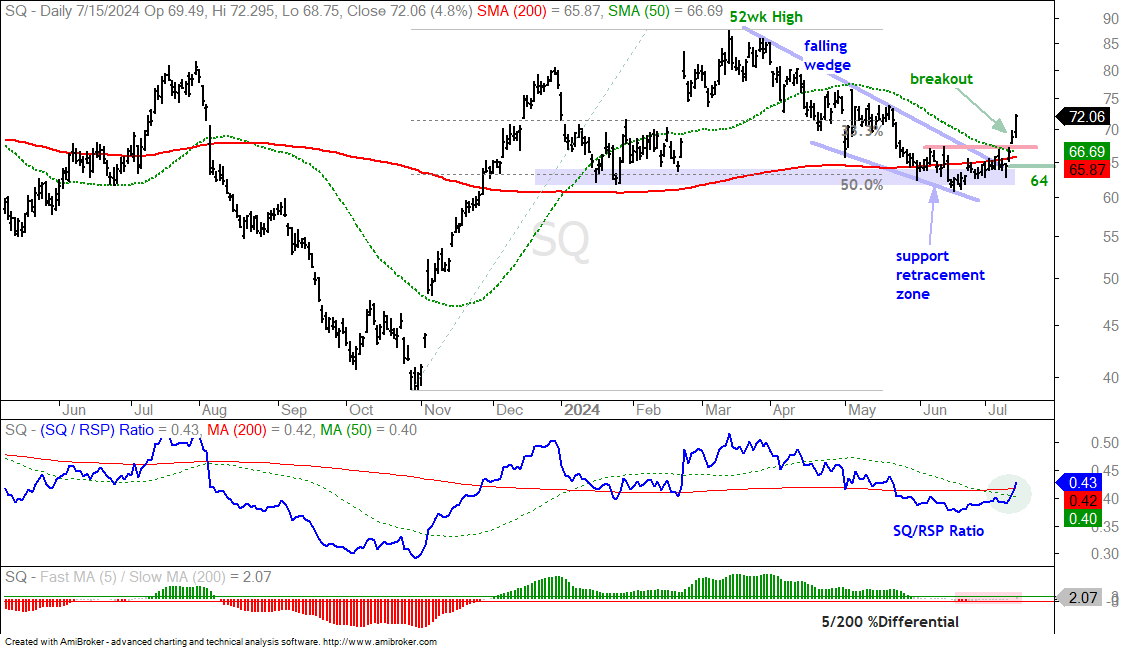
The next chart shows Block Inc (SQ) which is part of the Technology sector and the Electronic Payments group. This chart setup is similar to FAST because the stock overshot on the downside and the 5/200 %Differential dipped below -3% in mid June. Despite this overshoot, SQ firmed at the Support-Retracement Zone and broke out with a big move the last three days. This breakout reverses the falling wedge downtrend and signals the start of an uptrend. I am marking re-evaluation support at 64.