SPY/QQQ Stall after New Highs – MAGS Powers Higher
RSP Undecided – MDY Continues to Fall
SOXX Pulls Back as CIBR Hits Wedge Resistance
GE Aerospace Consolidates within Strong Uptrend
Axon Bounces off 33% Retracement Line
Range Narrows for Fiserve
Zebra Hits Channel Line and Key Retracement
SAP Gets Absolute and Relative Breakouts
The next Chart Trader will be posted on Tuesday morning, July 16th.
Vacation and Educational Reports/Videos
Note that I will be on a family vacation the first two weeks of July, and will not publish the ChartTrader reports from July 1st to July 14th. Instead, I will publish two educational reports and videos.
2-July: Quantifying Market Conditions using SPX/NDX Breadth
9-July: Classic Trend Indicators and Trend-Momentum Indicators
For SystemTrader, I will update the weekend signals for the Nasdaq 100 and S&P 500 Dual Momentum Rotation Strategies during the vacation (Saturdays). I will also update the signals for the ETF Trend-Momentum Profit Target Strategy.
Bull Market, RSP Lags and XLC Leads
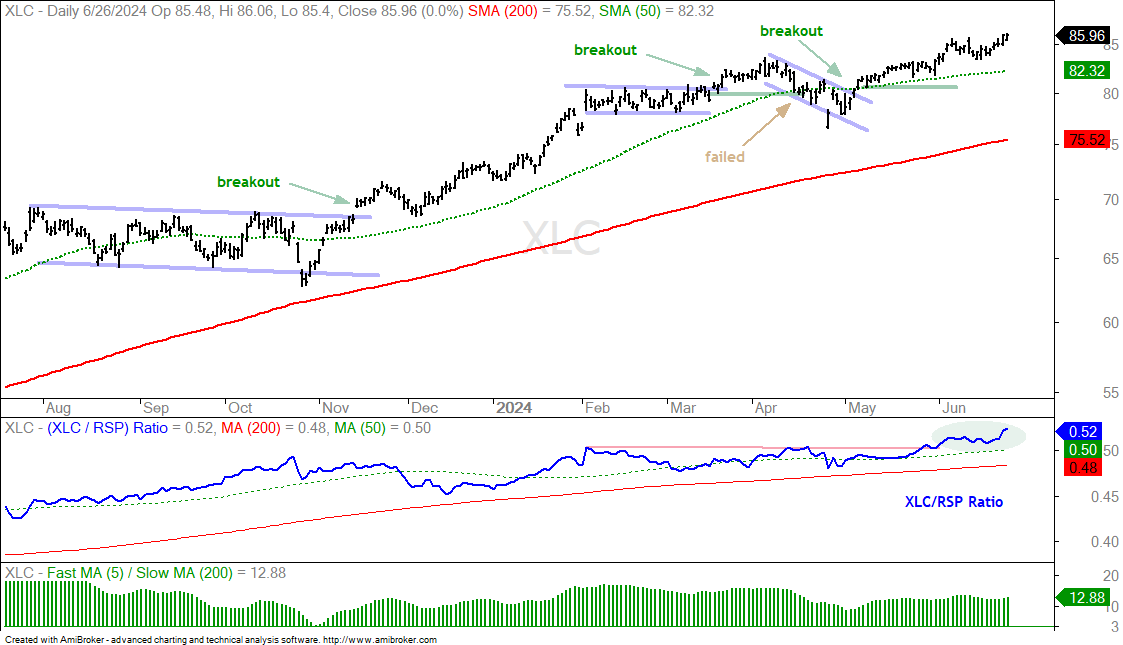
It is a bull market for large-caps and large-cap techs. The S&P 500 Equal-weight ETF is in a long-term uptrend, but is lagging because it peaked in March. Even though I am seeing less participation in this bull market, I am not seeing serious weakness. 66% of S&P 500 and 62% of Nasdaq 100 stocks are above their 200-day SMAs. These levels are below the prior peaks in late March, but the vast majority of stocks are still in long-term uptrends. Admittedly, we have seen several groups and stocks correct over the last few months, such as the Cybersecurity ETF. Using CIBR as an example, I view this weakness as a correction because the long-term trend is still up. Corrections are possible even when plenty of stocks are above their 200-day SMAs. Sometimes that correct back to their rising 200-day SMAs. Of note, the Mag7 ETF (MAGS) and Communication Services SPDR (XLC) are leading the market as both hit new highs on Wednesday.
4wk High-Low Percent Combo Remains Bullish
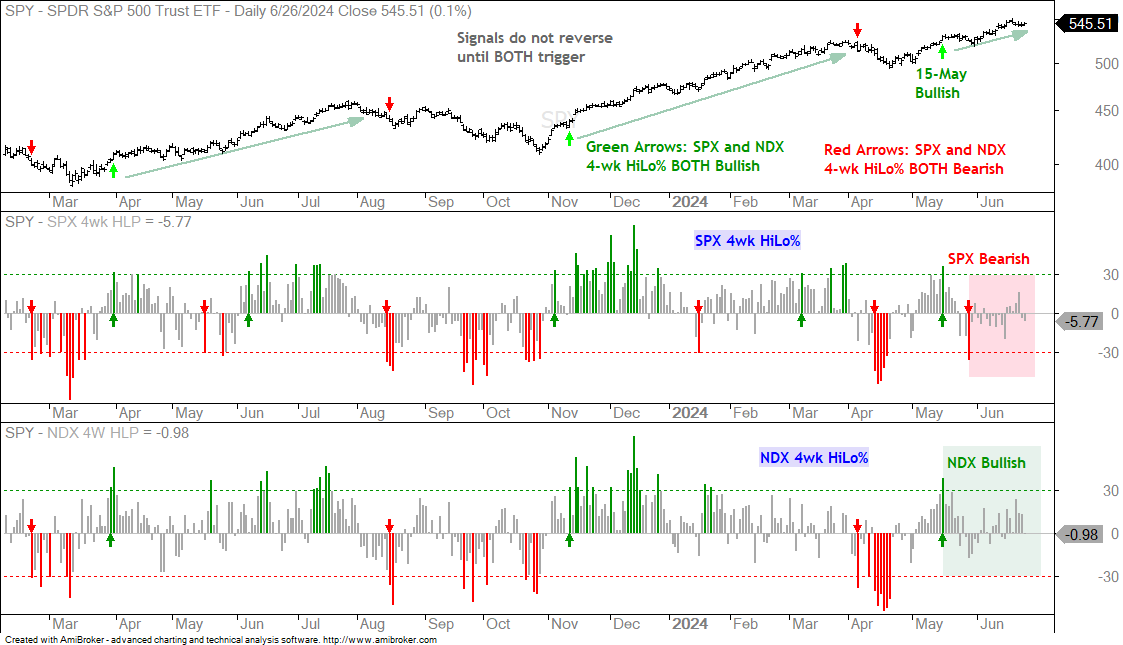
There is no change in the 4wk HiLo% indicators. A bullish combo signal triggered on May 15th when both surged above +30%. SPX 4wk HiLo% plunged below -30% on May 29th and turned bearish. This signal has yet to be confirmed by NDX 4wk HiLo%. Thus, the combo signal remains bullish. A plunge below -30% on NDX HiLo% would turn the indicator combo bearish and argue for a correction in SPY and QQQ.
4wk High-Low Percent Combo Remains Bullish
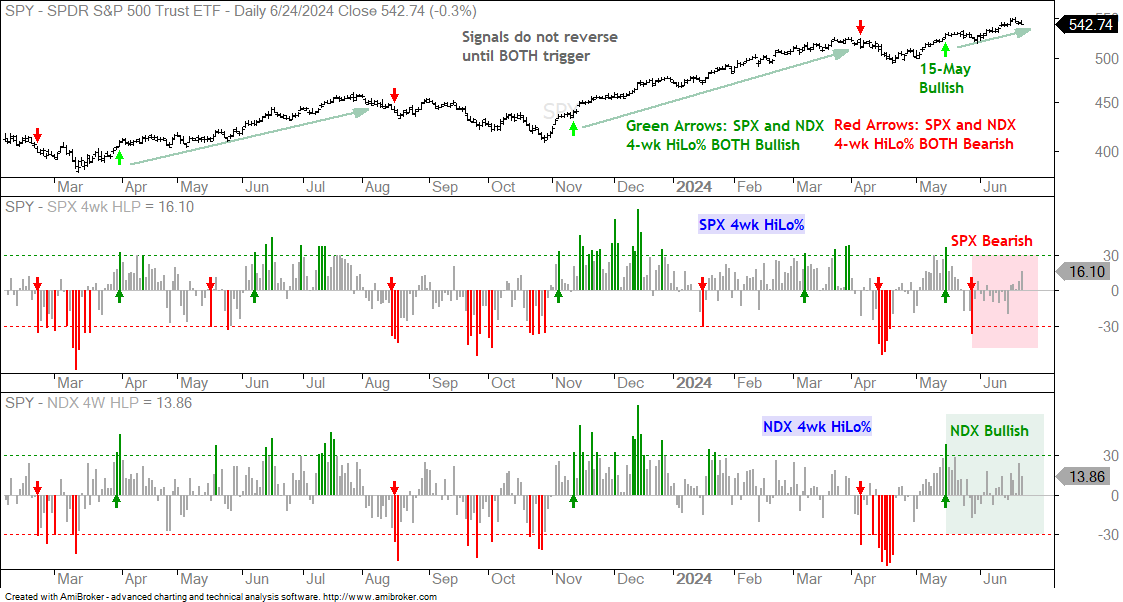
The next chart shows 4wk HiLo% for the S&P 500 and Nasdaq 100. This indicator turns bullish with a move above 30% and bearish with a move below -30%. Note that both must be bullish for a bullish combo signal and both must be bearish for a bearish combo signal. Currently, the S&P 500 is bearish and the Nasdaq 100 is bullish. Technically, the bullish combo signal from May 15th has yet to be reversed. Even though the AI trade took a big hit on Monday, the 4wk HiLo% indicators finished above +13% as there were more 4wk Highs than 4wk Lows.
4wk High-Low Percent is for short-term trend timing. A bullish signal triggers when BOTH SPX 4wk HiLo% and NDX 4wk HiLo% exceed +30%. See green arrows on price chart. A bearish signal triggers when BOTH break below -30%. See red arrows on price chart. The red and green shadings show the current signals for each indicator.
SPY/QQQ Stall after New Highs - MAGS Powers Higher
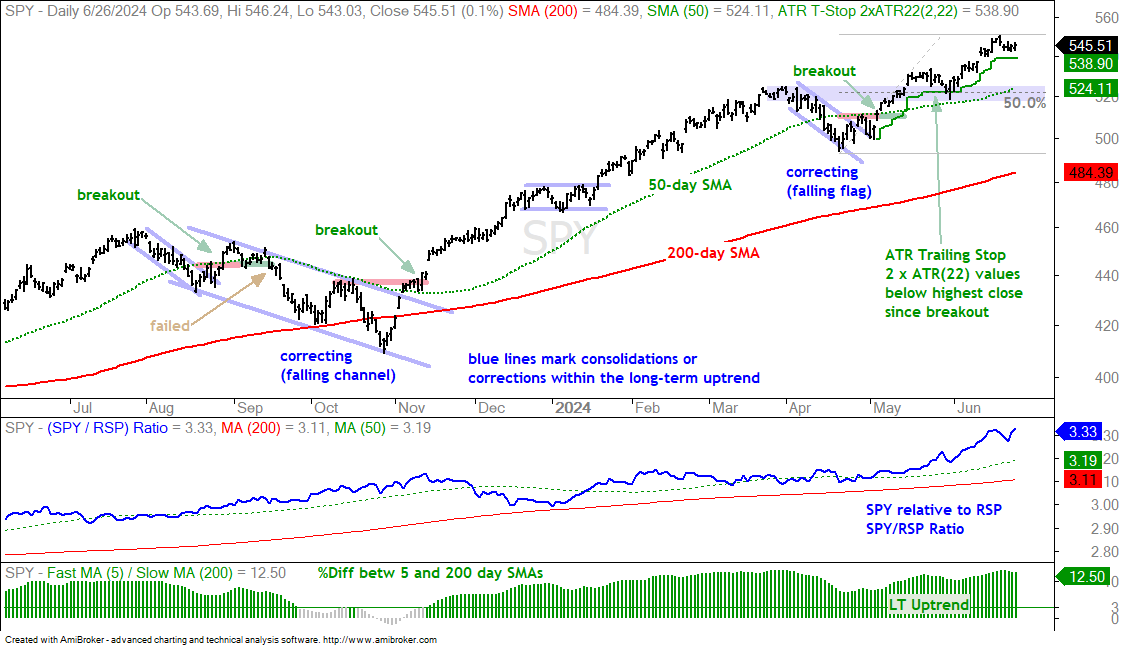
There is no real change in the SPY/QQQ charts. Both are in long-term uptrends and trading near all time highs. They are currently extending after the breakouts in early May. SPY corrected into April, broke out on May 3rd and extended on this breakout over the last eight weeks. There is no setup on this chart. For reference, the ATR Trailing Stop started with the early May breakout and is now at 538.90. It is difficult to predict or time a pullback within a bigger uptrend and a bull market. Should we get a pullback, I would mark first support near the rising 50-day SMA and broken resistance (blue shading). This area also marks a 50% retracement of the most recent advance.
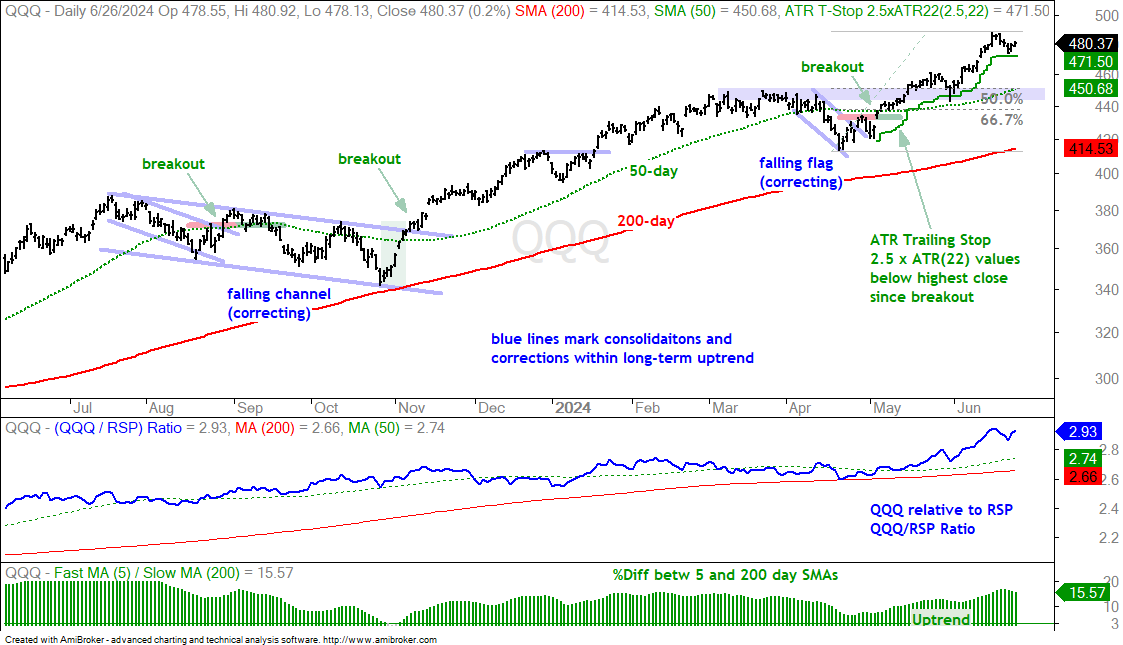
QQQ is also in the extension phase as it broke out in early May and moved higher the last eight weeks. The ATR Trailing Stop is at 471.50 (solid green line). There is no trading setup on this chart because price is in the middle of a post-breakout extension. It is time to wait for the next tradable setup to materialize. The blue shading marks first support in the 440-450 area. This support zone stems from broken resistance, the late May low and 50-67% retracement zone.
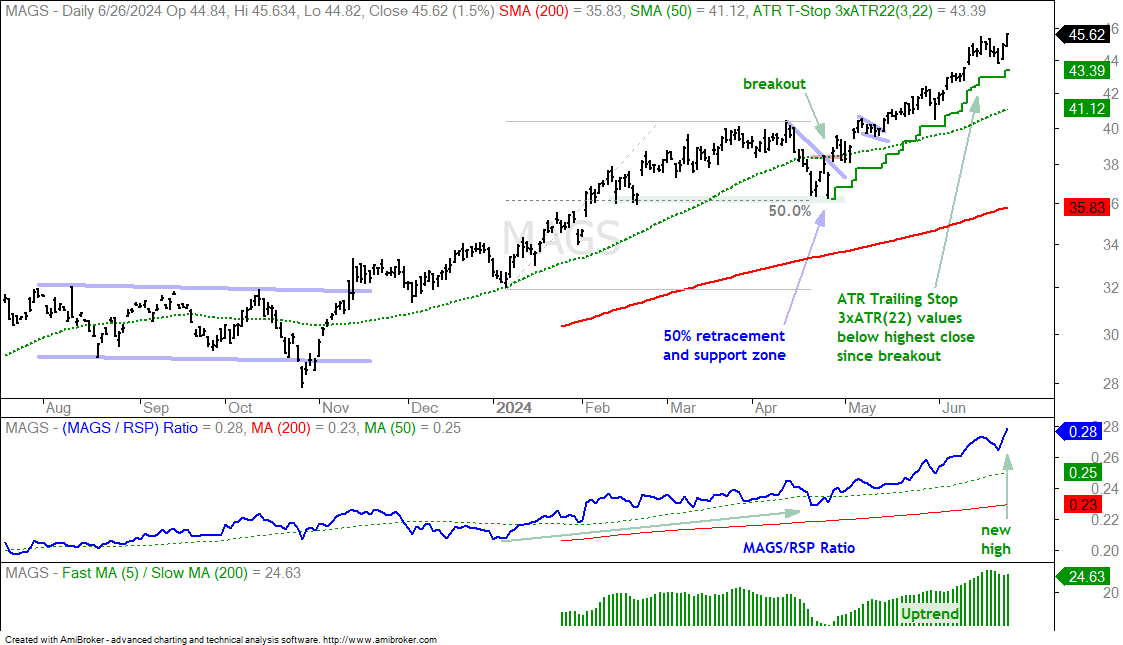
The Mag7 ETF (MAGS) surged to another new high and continues to lead the market. Amazon (AMZN) surged 3.9% and hit a new high. Alphabet (GOOGL) and Microsoft (MSFT) also hit new highs this week. Tesla (TSLA) is finding some mojo with a 4.8% gain on Wednesday. META also advanced the last two days and remains strong. Who needs Nvidia?! On the price chart, MAGS broke out in late April and continues to extend higher (2 months and counting). The ATR Trailing Stop rose to 43.39.
The following charts show price bars with the 200-day SMA (red line), the 50-day SMA (green line), the price-relative (ITB/RSP ratio) with the 200-day SMA and the percentage difference between the 5 and 200 day SMAs. On the price chart, I am looking for tradable pullbacks within a bigger uptrend or bullish consolidation patterns. With the price-relative, I am looking for relative strength. The price-relative (ITB/RSP ratio) rises when the ETF or stock outperforms. And finally, the percentage difference between the 5 and 200 day SMA is bullish (long-term uptrend) with a move above 3% and stays bullish until a move below -3%. This basically measures the tide or long-term bias.
RSP Undecided as MDY Continues to Fall
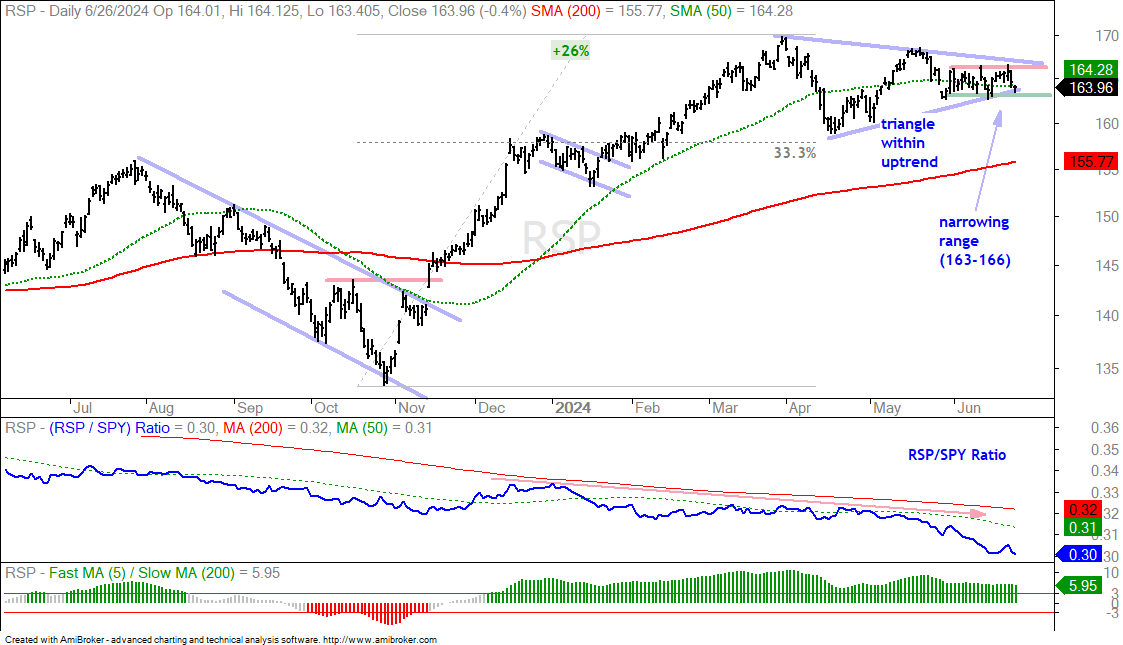
While SPY and QQQ extend higher and record new highs, the S&P 500 EW ETF (RSP) continues to consolidate with a narrowing range. Overall, RSP advanced 26% and then consolidated with a triangle. Technically, a consolidation after a big advance is a bullish continuation pattern. As such, a breakout at 166 would signal a continuation higher. There is, of course, concern with relative weakness. RSP formed a lower high from April to May and gain from May to June. A support break at 163 would be negative and argue for a test of the 200-day SMA. RSP is one to watch because a downside break would signal broadening weakness. Conversely, an upside breakout would show broadening strength.
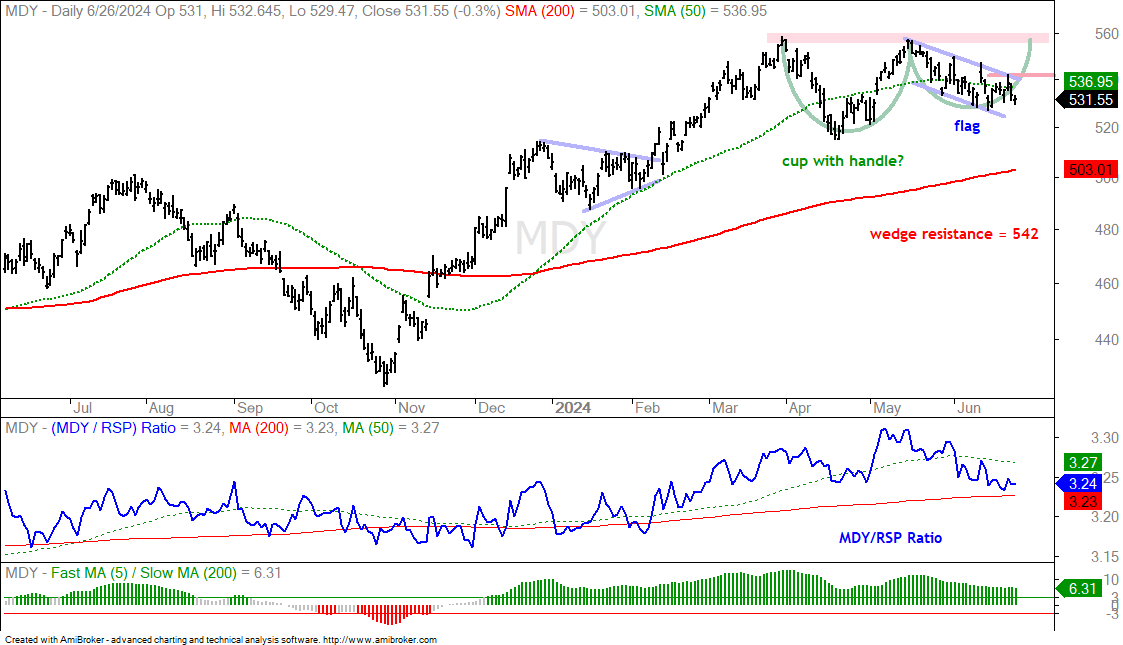
The S&P MidCap 400 SPDR (MDY) is in a similar boat: stalling and underperforming. MDY hit resistance twice at 559 and fell over the last five weeks with a falling flag of sorts. The big pattern could be a cup-with-handle and a break above rim resistance would be bullish. A falling flag formed as the handle takes shape and a breakout at 542 would provide the first indication of strength. This would increase the odds of a bigger breakout.
SOXX Pulls Back as CIBR Hits Wedge Resistance
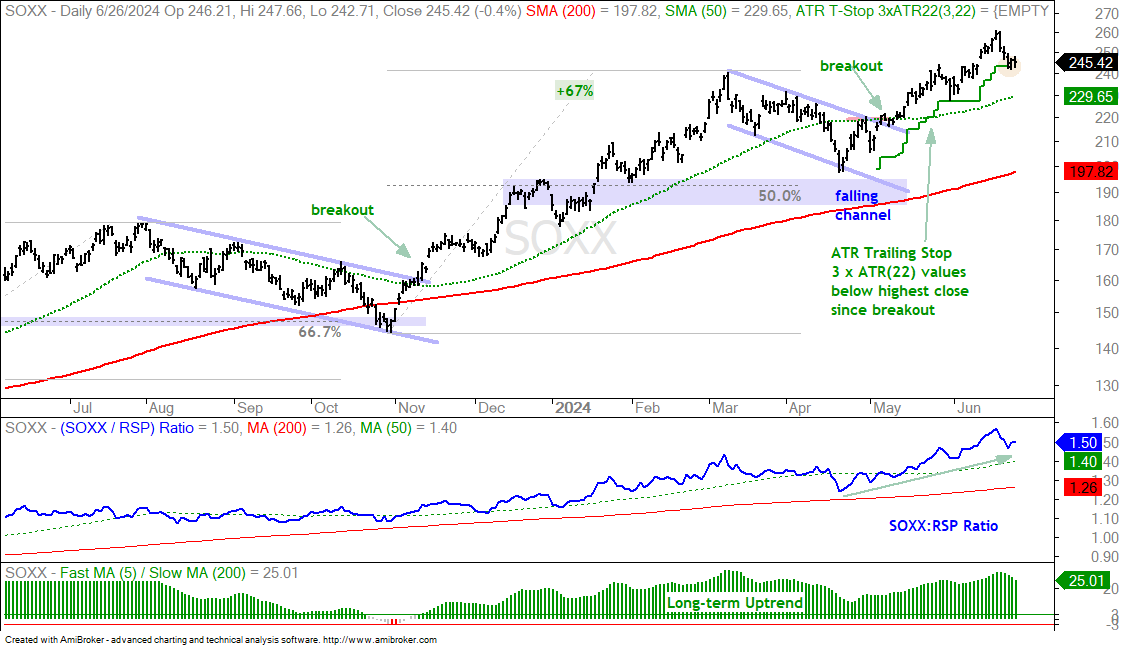
The Semiconductor ETF (SOXX) is still the leading tech-related ETF because it recorded fresh new highs throughout June. SOXX fell sharply the last five days and triggered the ATR Trailing Stop on Monday (yellow circle). This stop started with the early May breakout and trailed higher as long as prices rose. The break below the ATR Trailing Stop means the decline from the closing high was more than 3 ATR(22) values. Short-term this puts SOXX in no-man’s land. The stop triggered and there is no setup on the chart. Time to wait for the next tradable pullback to unfold. Note that the long-term trend is up and any weakness would be viewed as a correction within this bigger uptrend.
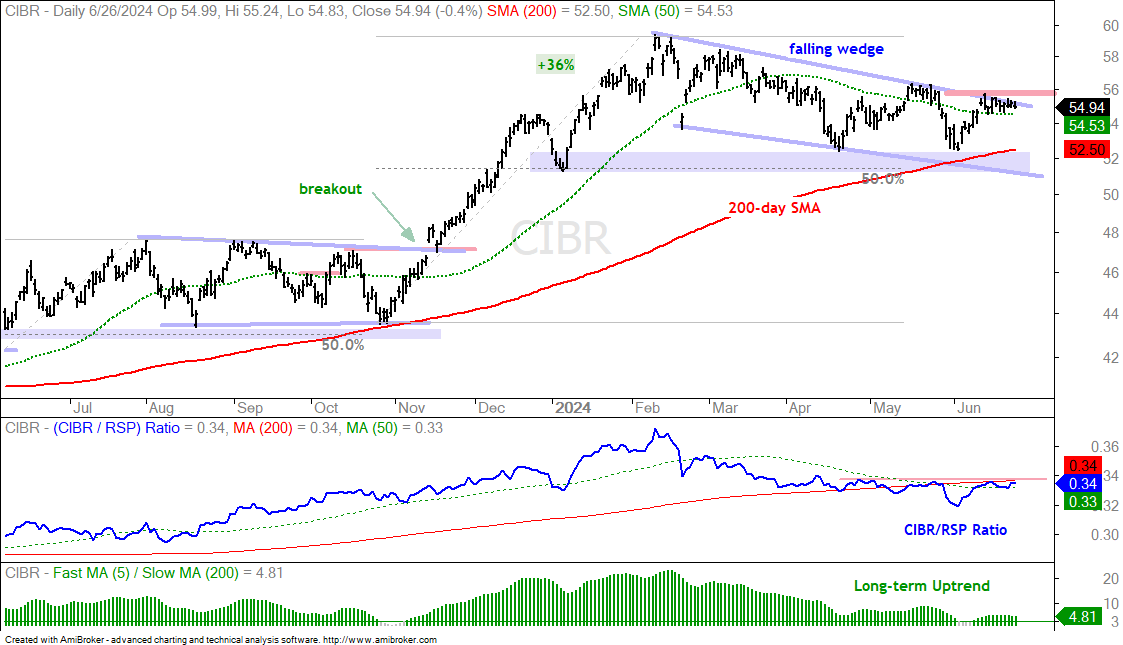
The Cybersecurity ETF (CIBR) remains with a falling wedge correction and is consolidating just below the May high. CIBR advanced 36% to a new high in February and then corrected into early June as it retraced around half of this advance. The ETF almost tagged the rising 200-day SMA. CIBR bounced in mid June and then stalled the last two weeks. I am marking resistance at 56 and a breakout here would reverse the four month slide. A breakout would signal an end to the correction and a resumption of the bigger uptrend. The indicator window shows the CIBR/RSP Ratio flattening out and a breakout above the May high would show a return to relative strength. Note that I covered CIBR and three cybersecurity stocks on June 11th.
GE Aerospace Consolidates within Strong Uptrend
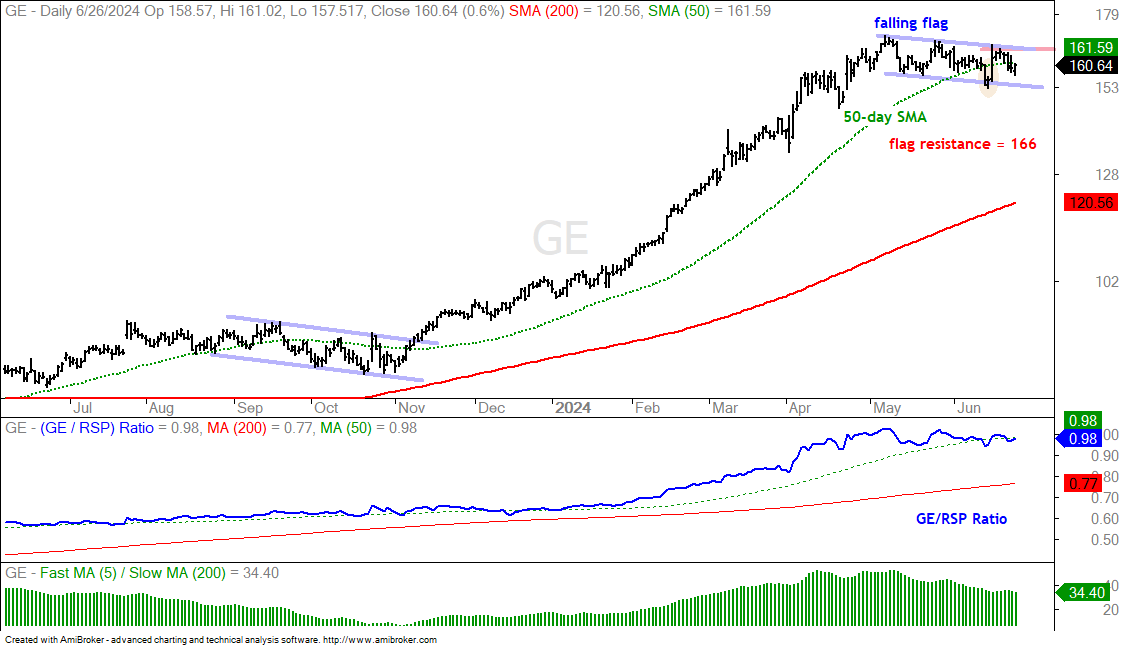
GE Aerospace (GE) is the last remnant of the former conglomerate. The stock is one of the top performers since early November with a 100% gain. Since hitting a new high in May, the stock consolidated with a falling flag taking shape. This amounts to a correction within a strong uptrend. GE broke the 50-day SMA with a sharp decline in mid June, but immediately rebounded (yellow oval). There was no follow through or breakout though. I am setting resistance at 166 and a breakout here would be bullish. This would signal an end to the correction and a resumption of the bigger uptrend.
Axon Bounces off 33% Retracement Line
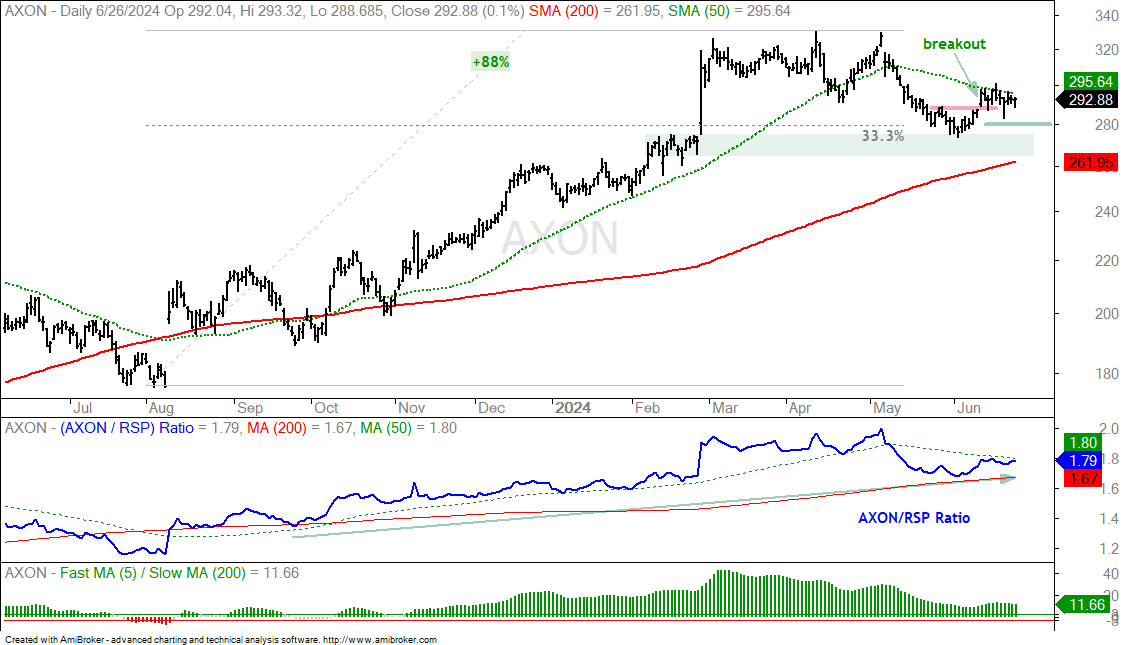
Axon Enterprises is the company behind TASER. They also provide bodycams, dashcams and software solutions for law enforcement. AXON bottomed last August and advanced 88% into April. The stock stalled in spring and dipped to the 33% retracement line in late May. AXON also hit the top of a support zone marked by the February consolidation (green shading). This made it a Support-Retracement Zone. AXON broke short-term resistance with a surge in mid June and this breakout is largely holding. I view this as bullish and would set re-evaluation support at 280.
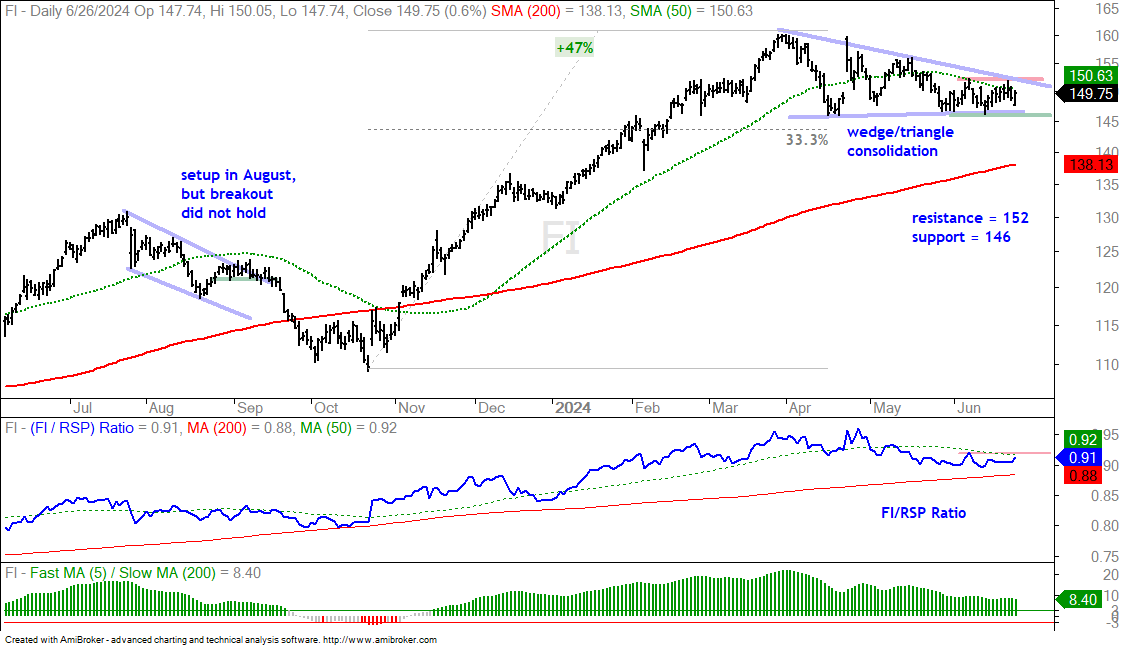
Range Narrows for Fiserve
Fiserve (FI) is a financial services technology provider. The stock advanced some 47% from mid October to mid March and then corrected into June with a wedge/triangle pattern. The stock found support in the 145 area in April, May and June. Most recently, the consolidation range narrowed with support at 146 and resistance at 152. My trading bias is bullish because the long-term trend is up. A breakout at 152 would signal an end to this consolidation and a resumption of the uptrend. Upon a breakout, I would mark my first re-evaluation support level at 146. As good as this setup looks, not all setups work. FI also corrected last summer and made a breakout attempt, which failed. Blame broad market weakness because SPY fell sharply in September-October. Watch RSP for clues on the broader market.
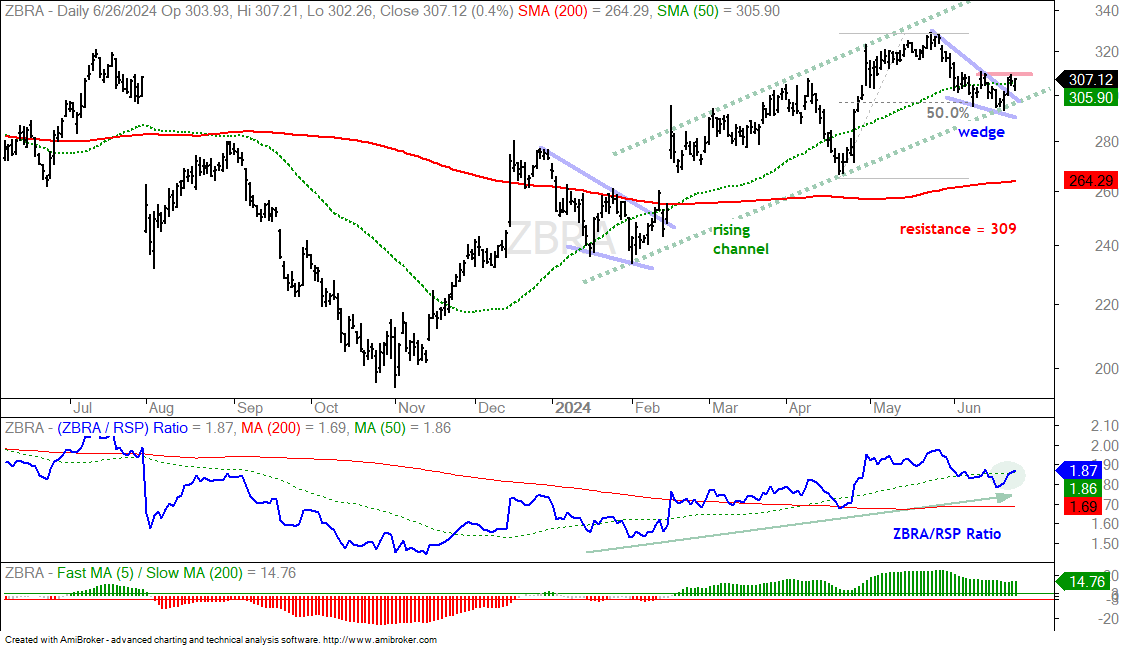
Zebra Hits Channel Line and Key Retracement
Zebra (ZBRA) engages in the design, manufacture and sale of automatic identification and data capture products. The bar code is one of them. The stock bottomed with the market at the end of October and move higher the last nine months. A channel formed this year and the stock fell back to the lower line here in June. This decline also retraced 50-67 percent of the prior advance. Thus, we have support from the channel line and a key retracement zone. This is a Support-Retracement Zone that could give way to a reversal and breakout. ZBRA already broke the falling wedge line and 50-day SMA. The red line marks resistance from the mid June high at 309. A breakout here would complete the short-term reversal and signal a continuation of the bigger uptrend.
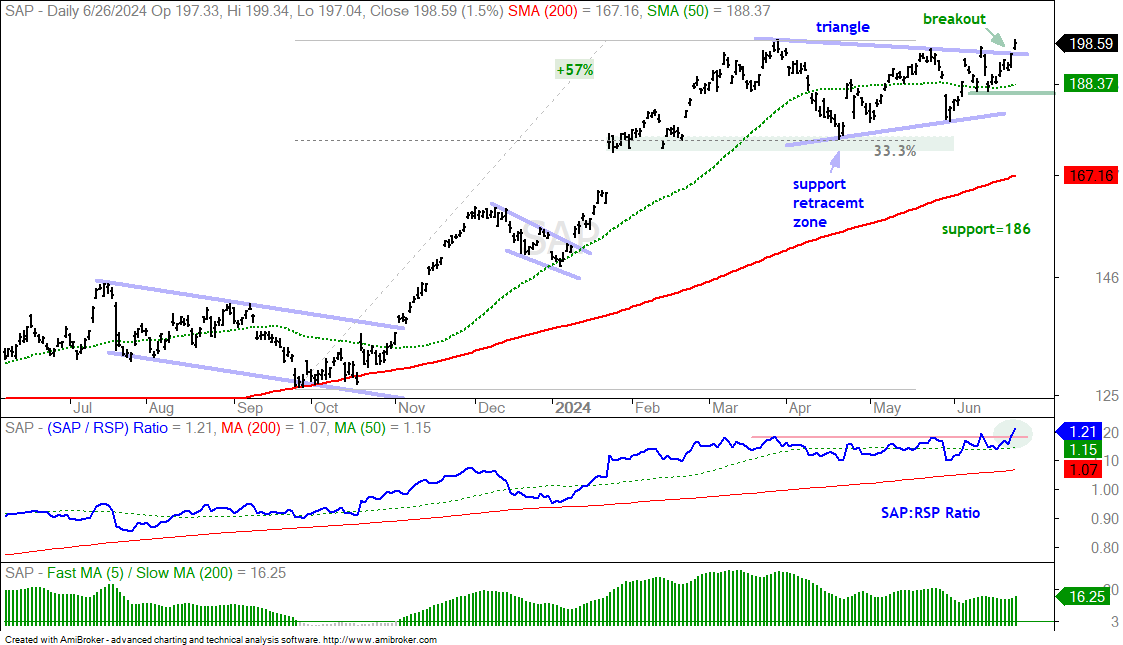
SAP Gets Absolute and Relative Breakouts
SAP (SAP) is an enterprise software and services company based in Germany. They compete with Salesforce (CRM), Oracle (ORCL) and IBM (IBM). SAP advanced 57% with the rest of the market and then consolidated with a triangle. The first pullback hit a Support-Retracement Zone (green shading). SAP fell back in early June, but rebounded and broke out of the triangle this week. This breakout signals a continuation of the bigger uptrend. It also makes SAP a market leader with a fresh 52-week high. The indicator window confirms leadership as the SAP/RSP ratio broke out to new highs as well. I am marking re-evaluation support at 186 (June lows).