The next Chart Trader will be posted on Tuesday morning, June 25th.
There is no change in the overall market condition. Large-caps and large-cap techs continue to lead the market. SPY, QQQ, MAGS, the Technology SPDR and the Semiconductor ETF (SOXX) hit fresh highs this week. Small-caps and mid-caps continue to lag as they fell back the last few weeks. On the price chart, we are seeing the Uranium ETF, Copper ETF and the China Large-Cap ETF correct within uptrends. They are trading near potential reversal zones. Elsewhere, we have a setup in Amazon and breakouts in Copart, Linde and Amgen.
Vacation and Educational Reports/Videos
Note that I will be on a family vacation the first two weeks of July. I will not publish the ChartTrader reports from July 1st to July 14th. Instead, I will publish two educational reports and videos.
2-July: Quantifying Market Conditions with NDX/SPX Breadth
9-July: Absolute Trends, Relative Trends and Trend Consistence
For SystemTrader, I will update the weekend signals for the Nasdaq 100 and S&P 500 Dual Momentum Rotation Strategies during the vacation (Saturdays). I will also update the signals for the ETF Trend-Momentum Profit Target Strategy.
4wk High-Low Percent is Bullish, but Mixed
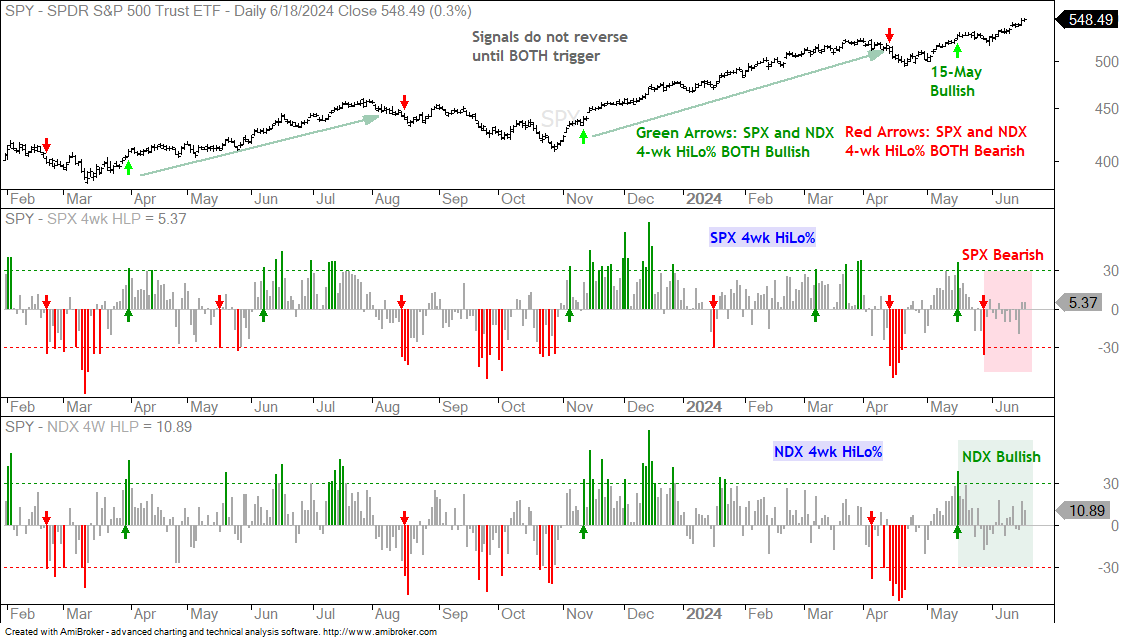
There is no change in the 4wk HiLo% indicators. A bullish combo signal triggered on May 15th when both surged above +30%. SPX 4wk HiLo% plunged below -30% on May 29th and turned bearish. This signal has yet to be confirmed by NDX 4wk HiLo%. Thus, the combo signal remains bullish. A plunge below -30% on NDX HiLo% would turn the indicator combo bearish and argue for a correction in SPY and QQQ.
4wk High-Low Percent is for short-term trend timing. A bullish signal triggers when BOTH SPX 4wk HiLo% and NDX 4wk HiLo% exceed +30%. See green arrows on price chart. A bearish signal triggers when BOTH break below -30%. See red arrows on price chart. The red and green shadings show the current signals for each indicator.
SPY and QQQ Hit New Highs - Again
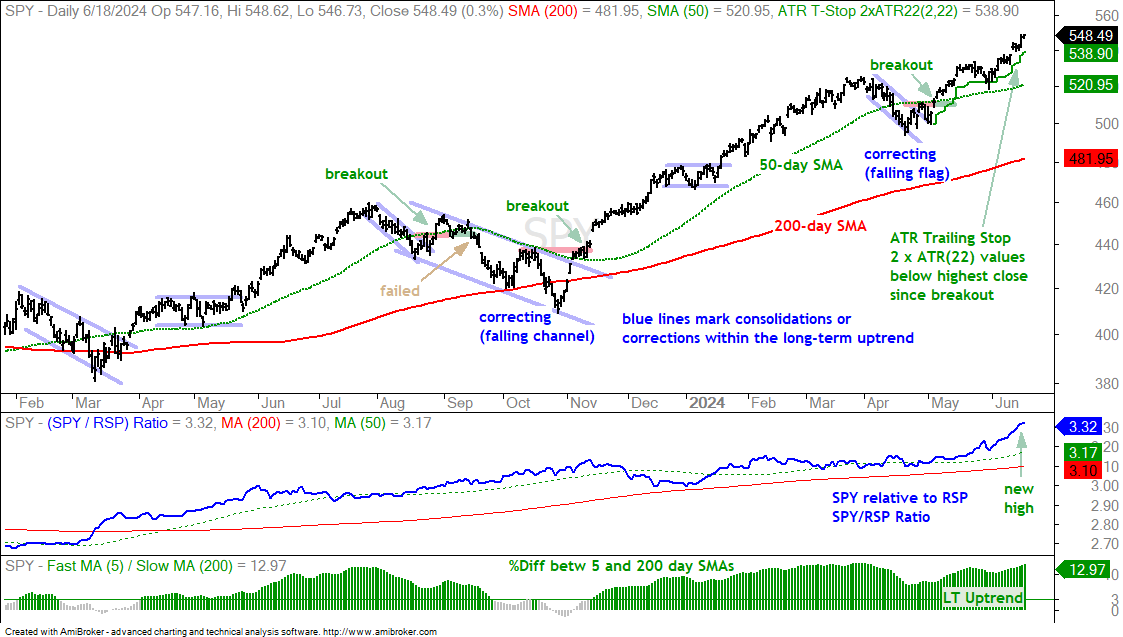
There is no change on the charts for SPY and QQQ. Both hit new highs this week and continue to lead. They are in long-term uptrends and trading in uncharted territory (all time highs). This means there is no resistance level overhead. I could point to some overbought oscillators and suggest that the market is ripe for a rest. Overbought conditions, however, are fairly normal in strong uptrends. Moreover, overbought conditions do not provide us with a trading setup. Shorting is not a good idea during a bull market. The chart below shows SPY with a breakout in early May and an extension on this breakout. SPY is well into this extending phase. The ATR Trailing Stop rose to 538.9 as SPY hit another new high.
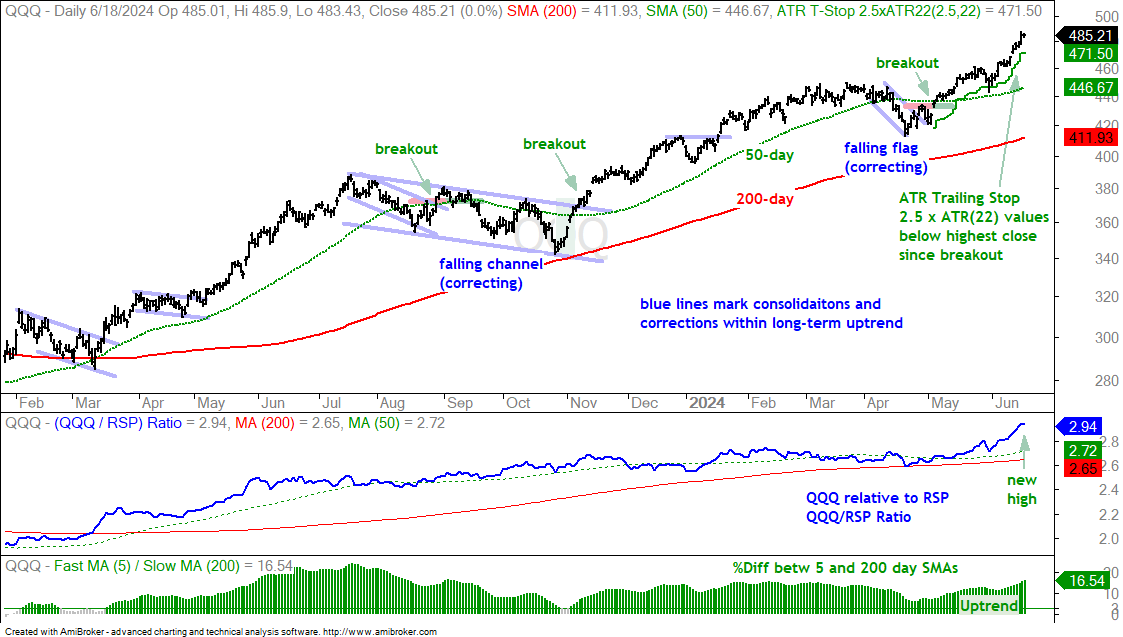
The next chart shows QQQ with the early May breakout and extension higher. The ATR Trailing Stop rose to 471.50.
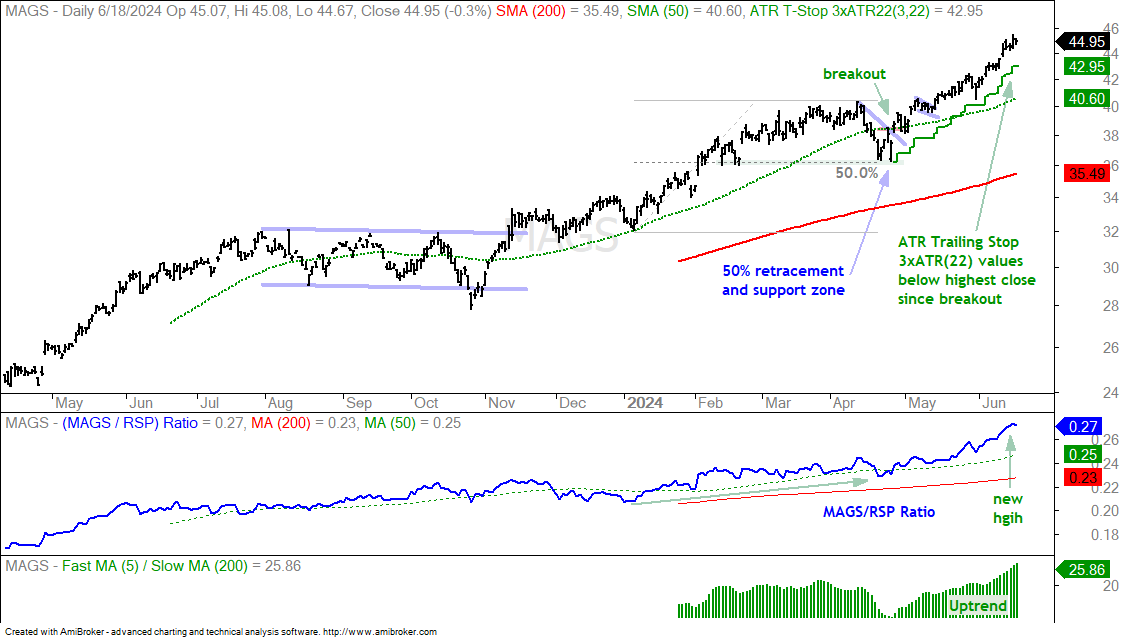
The next chart shows the Mag7 ETF (MAGS) hitting a new high on Monday, but failing to exceed this high on Tuesday. OMG, one day of lagging! There is no real change on this chart either. MAGS broke out in late April and extended on this breakout the last seven weeks. The ATR Trailing Stop is at 42.95 for reference.
The following charts show price bars with the 200-day SMA (red line), the 50-day SMA (green line), the price-relative (ITB/RSP ratio) with the 200-day SMA and the percentage difference between the 5 and 200 day SMAs. On the price chart, I am looking for tradable pullbacks within a bigger uptrend or bullish consolidation patterns. With the price-relative, I am looking for relative strength. The price-relative (ITB/RSP ratio) rises when the ETF or stock outperforms. And finally, the percentage difference between the 5 and 200 day SMA is bullish (long-term uptrend) with a move above 3% and stays bullish until a move below -3%. This basically measures the tide or long-term bias.
Equal-weights and Mid-caps Pull Back
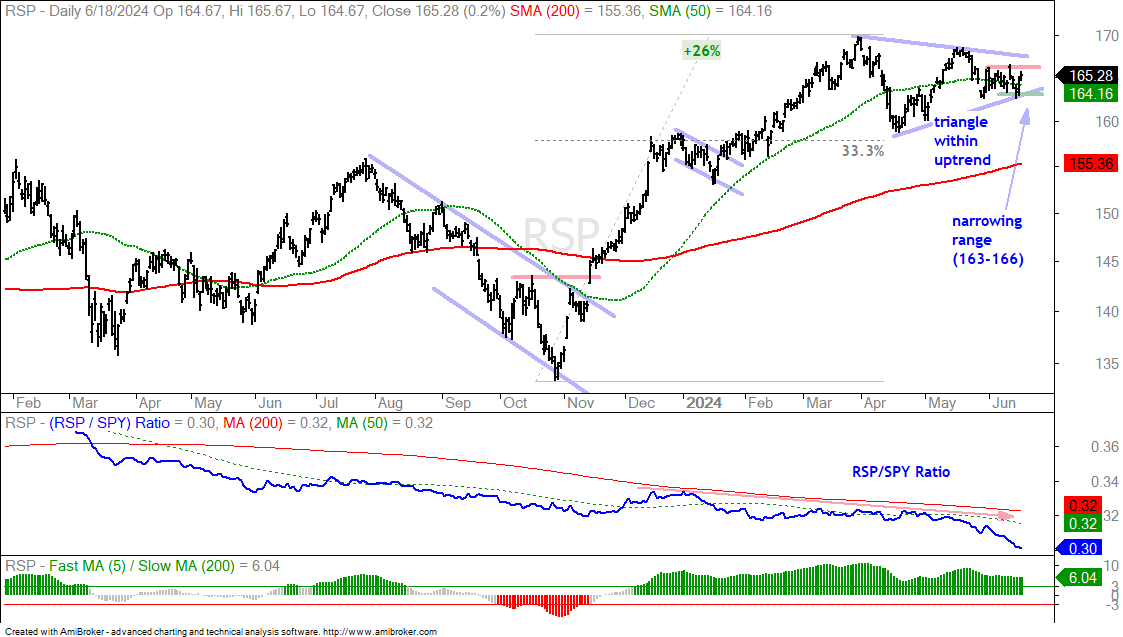
SPY and QQQ are zooming to new highs, but the S&P 500 EW ETF (RSP) and S&P MidCap 400 SPDR (MDY) remain in pullback mode. It has been a while since I saw such a blatant performance discrepancy. Relative strength in small-caps and mid-caps is not an issue for the large-cap dominated SPY and QQQ. Waning breadth is also not an issue for large-cap driven ETFs. Relative weakness and waning breadth are issues for mid-caps and small-caps. The first chart shows the S&P 500 EW ETF (RSP) advancing 26% and then consolidating with a triangle. Technically, a consolidation after a strong advance is a rest within the uptrend and a breakout signals a continuation higher. RSP is currently trading around the 50-day SMA with a smaller trading range the last three weeks. I am watching these boundaries for the first clue. An upside breakout at 166 would be bullish, while a downside break at 163 would be bearish.
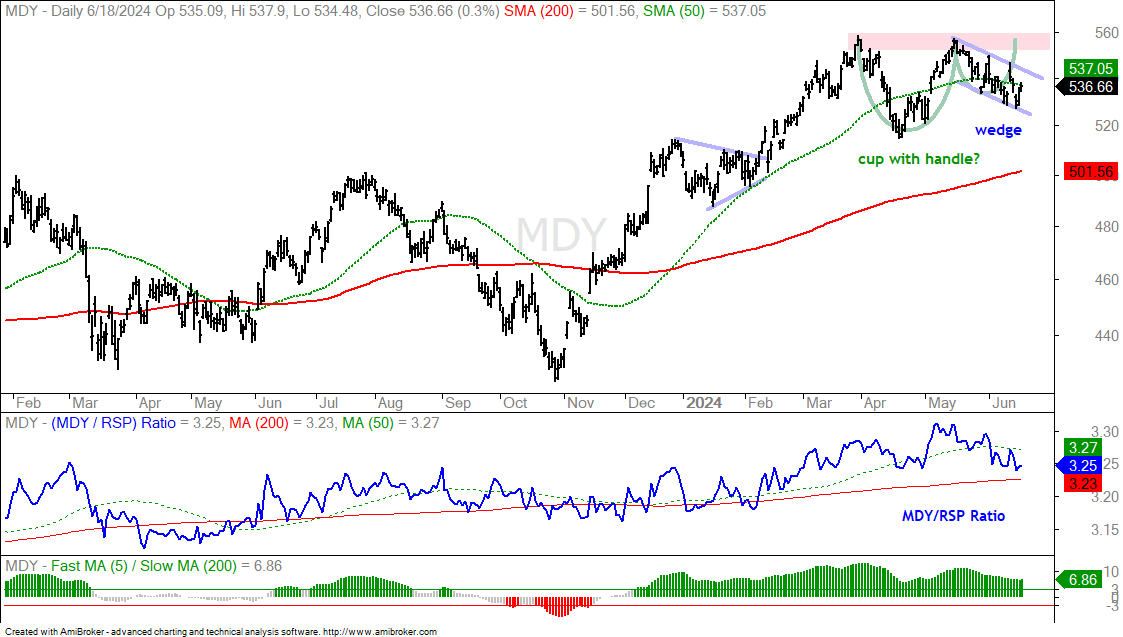
The next chart shows the S&P MidCap 400 SPDR (MDY) with a possible cup-with-handle pattern. The handle is a work in progress as a falling wedge formed the last five weeks. A close above 540 would break the wedge line and increase the odds for a resistance challenge at 559. A breakout here would confirm the cup-with-handle pattern.
Uranium ETF Pulls Back to 200-day SMA
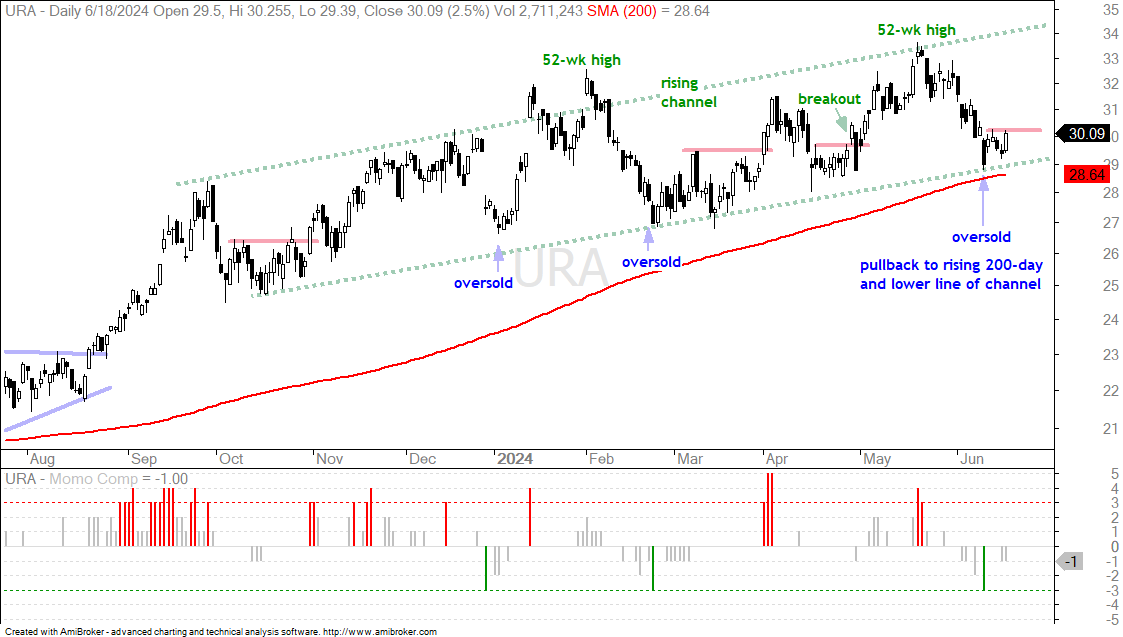
The next chart shows the Uranium ETF (URA) within a rising price channel and long-term uptrend. URA tagged a new high in mid May and fell back to the lower line of the rising channel. The rising 200-day SMA is also in the neighborhood. I view this as a pullback within a bigger uptrend and a possible opportunity. Also notice that the Momentum Composite became oversold (-3 or lower) for the third time since late December. URA is also trading near support from the April-May low. Overall, I see reasons for support and an oversold condition. These could give way to a short-term breakout. A close above 30.30 would be short-term bullish.
Copper ETF Hits 50% Retracement
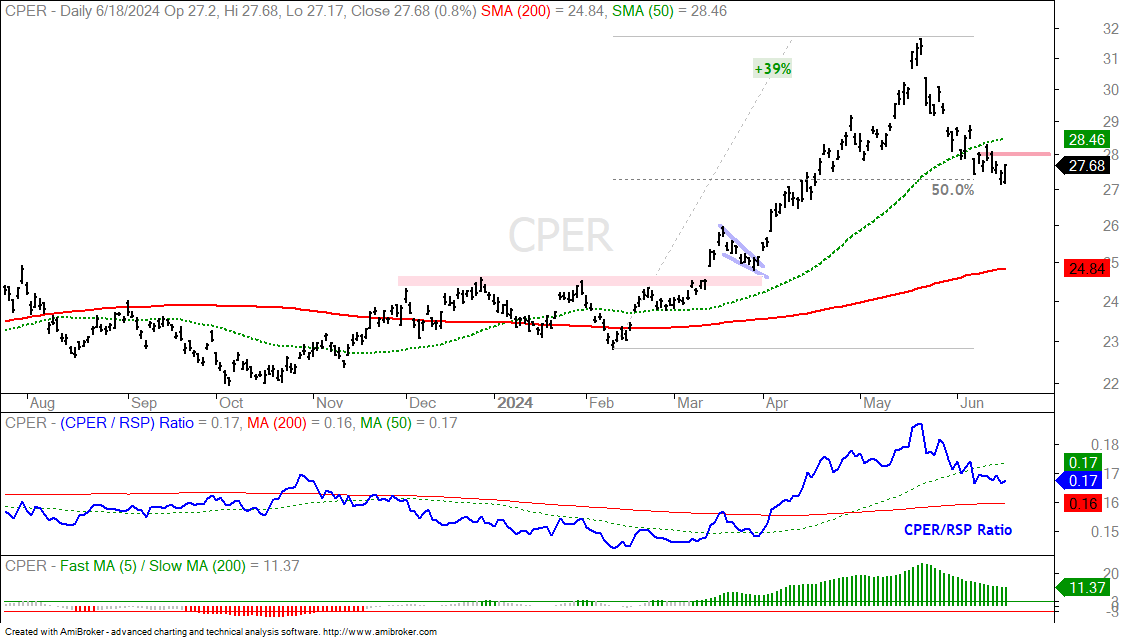
The next chart shows the Copper ETF (CPER) breaking out in March and soaring to new highs with a 39% advance. The ETF then corrected with a 13% decline that retraced around 50% of the prior advance. I do not see a falling channel or wedge on this chart. Such patterns would provide a clear resistance level to watch for a breakout. I must therefore analyze short-term price action to find a key level. CPER broke the 50-day SMA with a sharp decline on June 7th and the highest close since then is 27.98 (call it 28). I would mark short-term resistance here and view a close above this level as a short-term breakout.
China Large-Cap ETF Hits Rising 50-day SMA
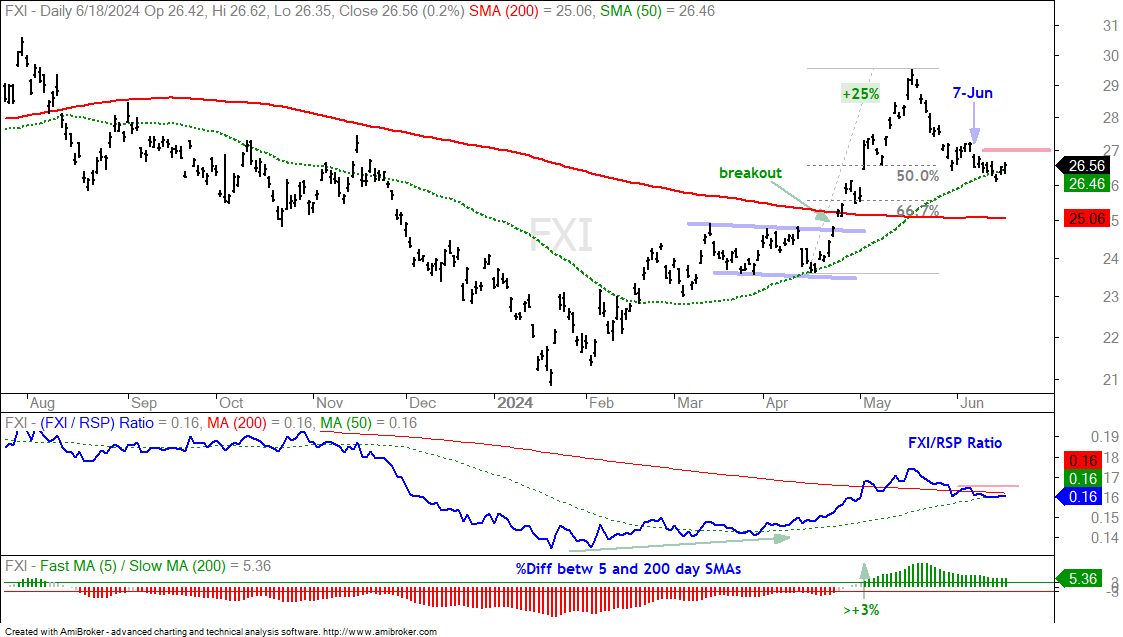
The next chart shows the China Large-Cap ETF (FXI) breaking out in late April and advancing some 25%. This move broke the 200-day SMA and pushed the 5/200 Differential above +3% (long-term uptrend). After this big move, FXI fell back to the rising 50-day SMA here in June. This decline also retraced 50-67 percent of the prior advance, which is normal for a retracement within a bigger uptrend. As with copper, I am looking for signs of short-term strength that would signal an end to the correction. FXI fell sharply on 7-June (-2.5%) so I am marking resistance using the highs since then. A close above 27 would trigger a short-term breakout and be bullish.
Amazon Consolidates Near Highs
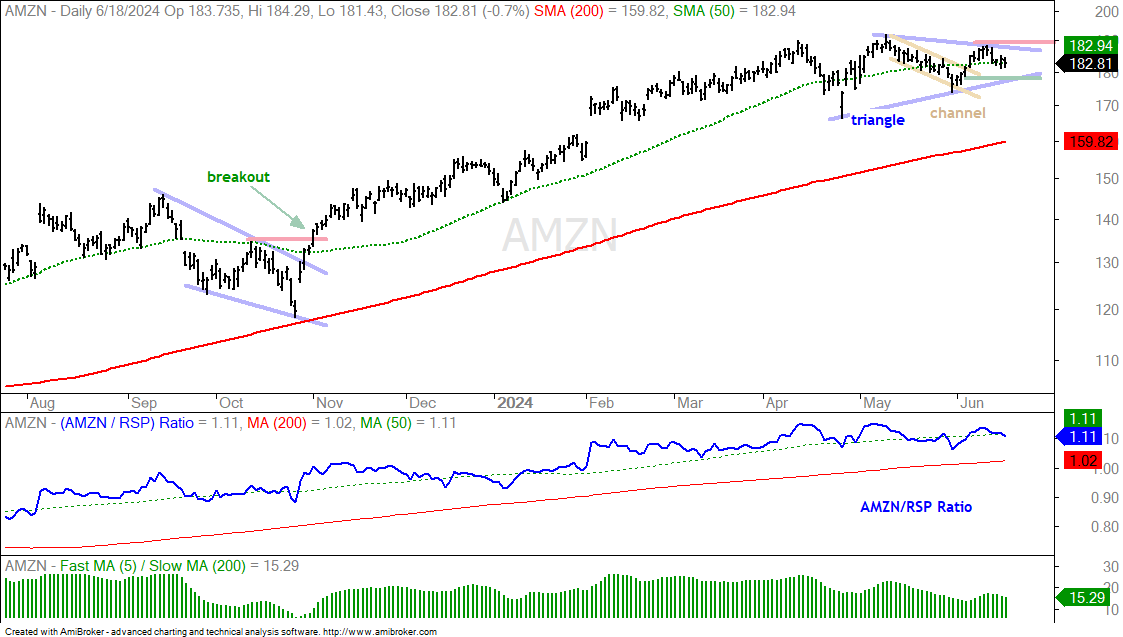
Amazon (AMZN) is one of the MAG7. It is trading just below its mid May high, but remains in an uptrend. Overall, the stock led the market from early November to early April as it held above its 50-day SMA for 116 days. AMZN broke its 50-day in mid May and then embarked on a trading range. A triangle formed over the last two months and I view this as a bullish continuation pattern. A breakout at 190 would be bullish. Within the triangle, AMZN fell from mid May to early June with a falling channel. The stock broke the upper line with a bounce last week and this increases the odds of a bigger triangle breakout. Triangle support is set at 178 and a break here would argue for more correction.
Copart Breaks Wedge Resistance
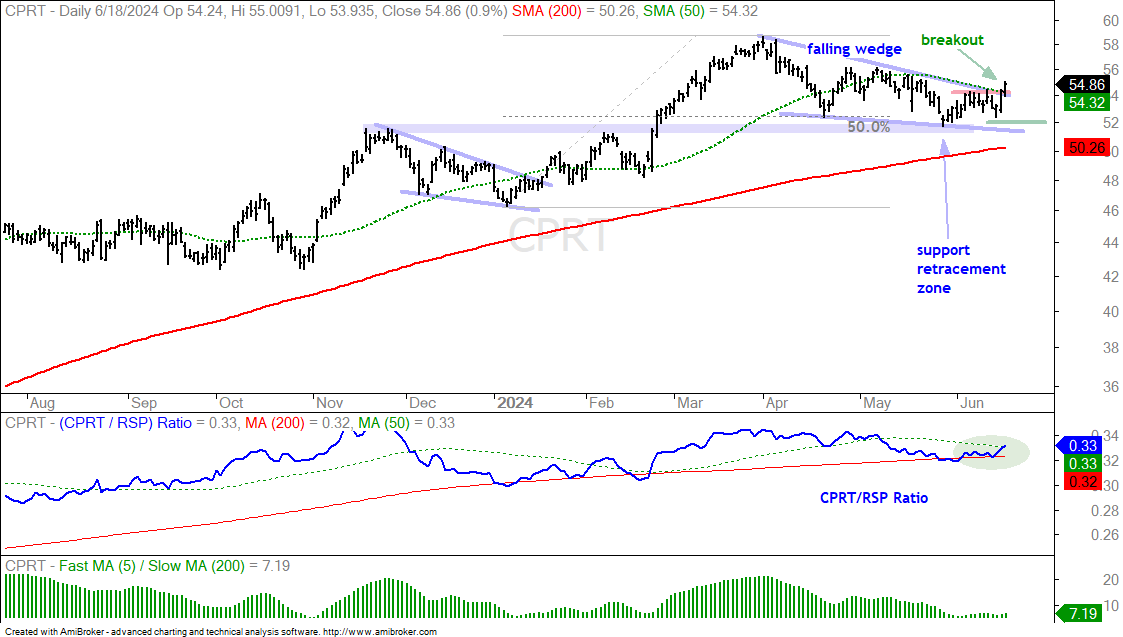
The next chart shows Copart (CPRT) with a classic setup. The stock hit a new high in April and then corrected with a falling wedge. This decline retraced around 50% of the prior advance and returned to the breakout zone, which turns into a support zone (blue shading). This Support-Retracement Zone is an area to watch for a reversal. CPRT did just that with a wedge breakout over the last two days. The breakout signals a continuation of the overall uptrend. I am using the early June low to mark re-evaluation support at 542.
Linde PLC Perks Up with a Breakout
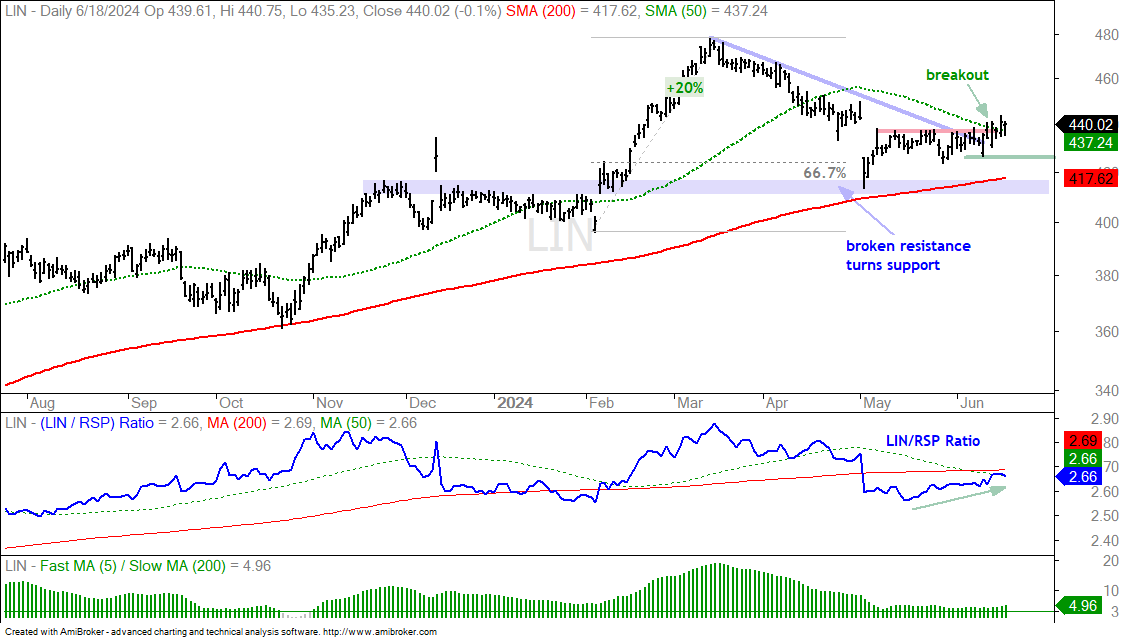
The next chart shows Linde PLC (LIN) advancing some 20% and hitting a new high in mid March. The stock then fell back into April and gapped down in early May. There was no follow through to this gap as the stock immediately bounced and firmed. Note that LIN found support near broken resistance and the rising 200-day. The decline also retraced around 67% of the prior advance. The long-term trend is still up so I view this decline as a correction within that uptrend. Moreover, I am seeing signs of strength as the stock breaks short-term resistance and the 50-day line. I view this as bullish and would set a re-evaluation support at 426.
Amgen Consolidates after Gap-Surge
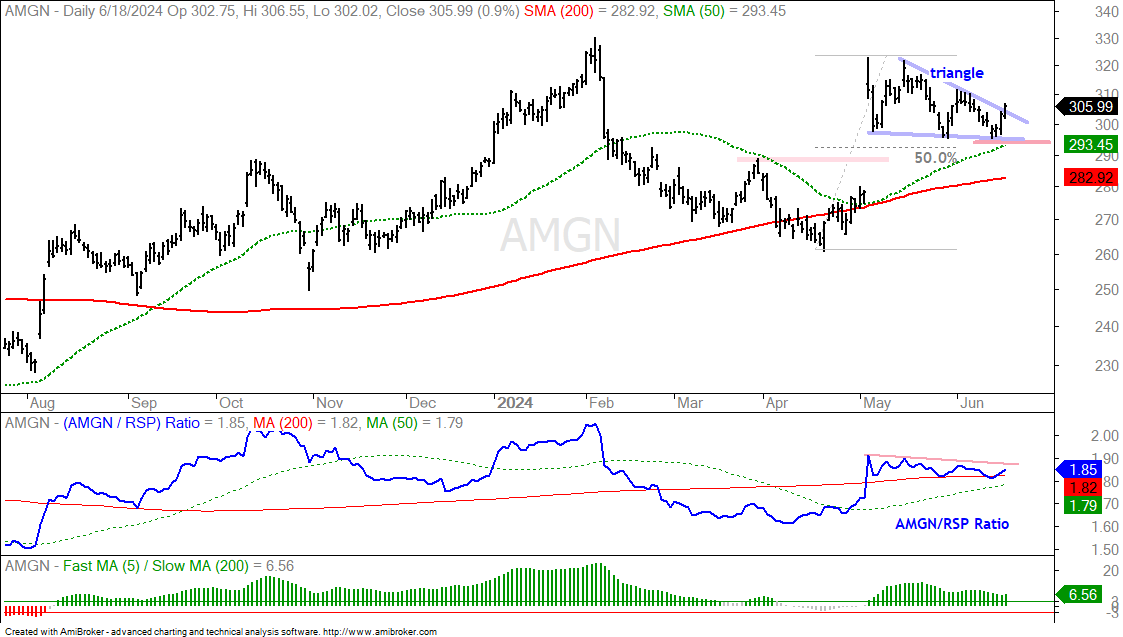
The next chart shows Amgen (AMGN) with a gap-surge above 300 in early May. After a 20% move, the stock consolidated with a triangle/wedge forming. Consolidations work off overbought conditions and pave the way for the next move higher. AMGN broke the upper line of the wedge with a surge the last two days. This bounce is also coming just above the rising 50-day SMA. I view this breakout as bullish. It signals a continuation of the gap-surge and targets a move to new highs. I am marking re-evaluation support at 294 (green line).