Video and Report Headlines
- Short-term Breadth Has yet to Break Out
- ST Breakouts and RSI Resistance for SPY and QQQ
- Bank SPDR Challenges Consolidation Resistance
- Vertex Breaks Wedge Resistance
- Confluent Breaks Channel Resistance
- Union Pacific Surges off Rising 200-day SMA
- Varonis Systems Bounces off Support
- Oracle Returns to Breakout Zone
The next Chart Trader will be posted on Tuesday morning, May 14th.
Short-term Breadth Has yet to Break Out
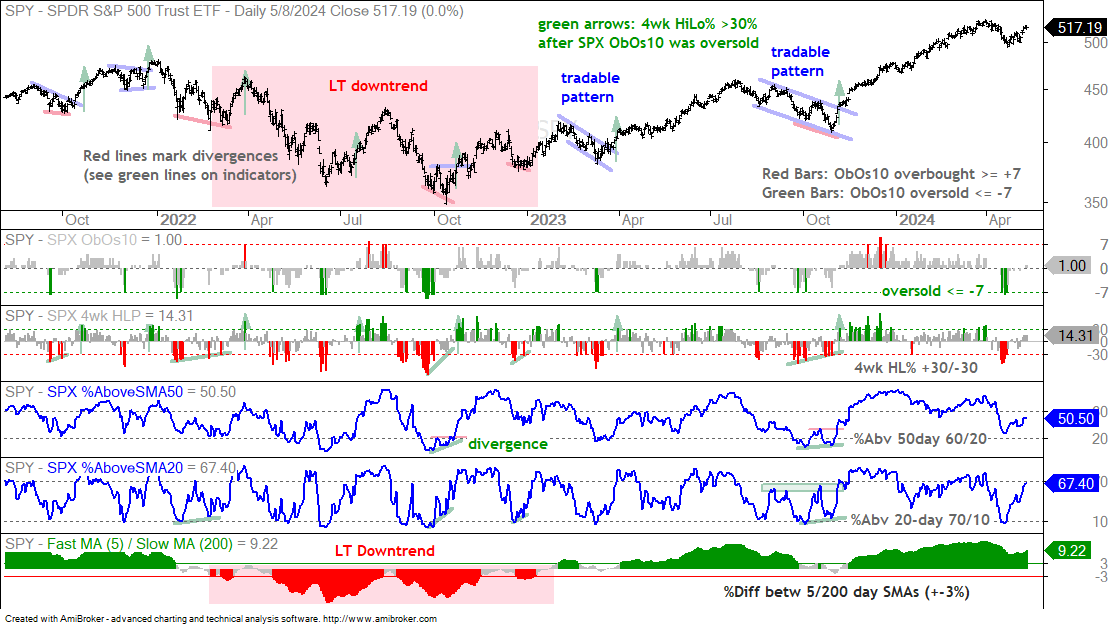
SPY is in the midst of an oversold bounce, but I want to see breadth expand with two of the three indicators before turning bullish: SPX 4wk High-Low% above +30%, SPX %Above 50-day above 60% and/or SPX %Above 20 day above 70%. Thus, no signal yet. See section below for indicator explanation. SPX ObOs10 became oversold with dips to -7 and -8 from April 15th to 18th (green bars in first indicator window). SPX %Above 20-day SMA also dipped below 10% to become oversold (fourth indicator window). These oversold conditions foreshadowed the bounce in late April and this bounce is starting to stall the last two days.
QQQ is in the midst of an oversold bounce, but I want to see breadth expand in two of the three indicators before turning bullish: NDX 4wk High-Low% above +30%, NDX %Above 50-day above 60% and/or NDX %Above 20 day above 70%. Neither has yet to trigger, so no signal yet. NDX ObOs10 (top indicator) became oversold on April 18th and 19th (-7 and -10). NDX %Above 50-day SMA and NDX %Above 20-day SMA also became oversold with dips below 20% and 10%. These oversold conditions foreshadowed the bounce since late April.
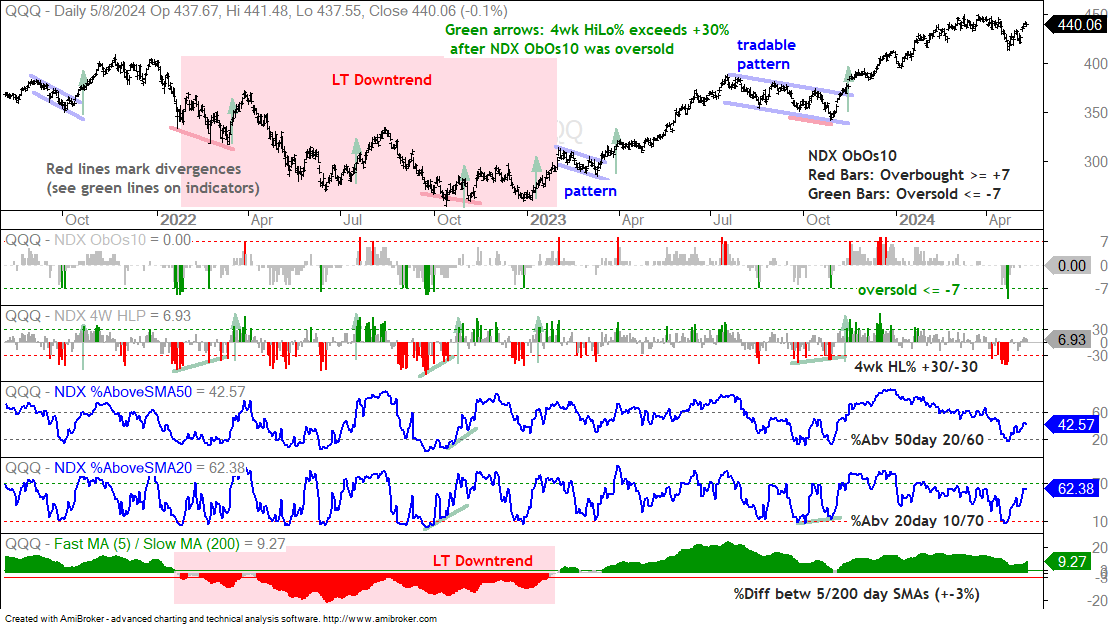
About the Indicators: The charts above feature a long-term trend indicator in the bottom window and four short-term indicators to identify short-term bullish setups and signals. I am using the percentage difference between the 5 and 200 day SMAs for the long-term trend. A break above +3% is bullish and stays bullish until a break below -3%. The red shading marks the long-term downtrend in 2022. The first indicator window shows SPX/NDX ObOs10, which aggregates overbought and oversold signals in 10 indicators. It is oversold at -7 or lower and overbought when at +7 or higher. I am mostly interested in oversold readings when the long-term trend is up. Once ObOs10 becomes oversold, I then look for short-term signals to suggest an end to the correction. These include 4wk High-Low Percent exceeding +30%, %Above 50-day SMA exceeding 60%, %Above 20-day SMA exceeding 70% and a pattern breakout on the price chart.
Oversold Bounces after Outsized Declines
No change. We have three trends at work in the market now. First, the long-term trend is up (bull market). Second, the medium-term trend is down after the outsized declines in April (red shading). Third, the short-term trend is up with the breakout at 510.
SPY broke short-term resistance at 510 on Friday. Technically, we have a short-term breakout and short-term trend reversal. The breakout level at 510 becomes support and a close below this level would call for a re-evaluation. Thus, the breakout is bullish until proven otherwise and I am using August 2023 as my guide here. SPY experienced an outsized decline then (red shading), broke short-term resistance with a 4.5% bounce (low to high) and then peaked in early September. Broken resistance turned support (red-green line) and the August breakout failed on September 15th.
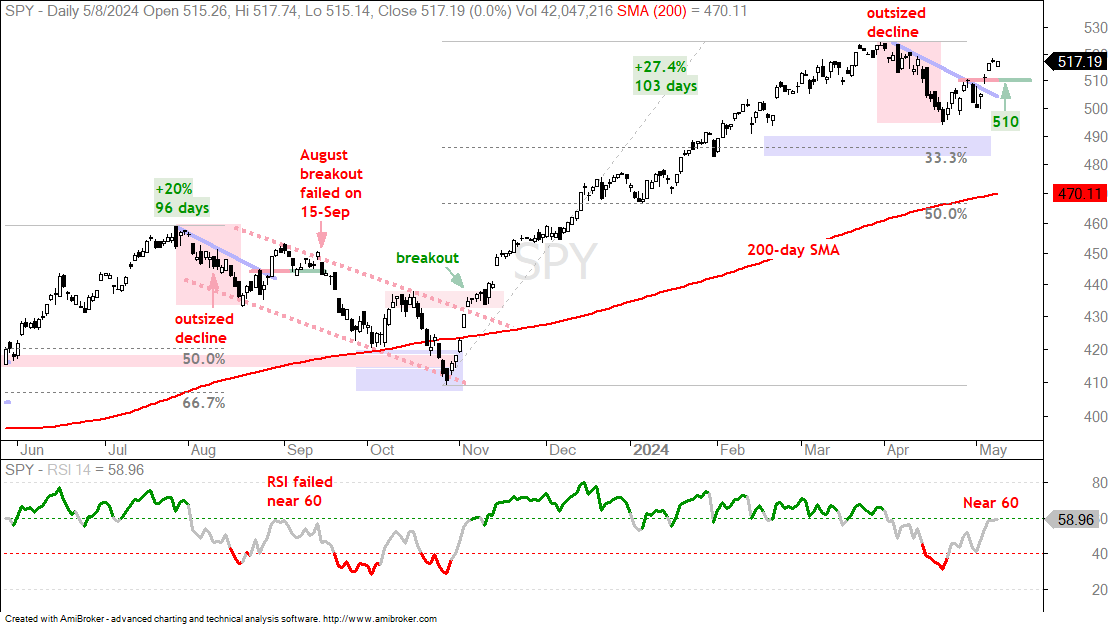
RSI is approaching a moment of truth for this oversold bounce. As noted above, the S&P 500 and Nasdaq 100 breadth indicators have yet to achieve breakout status that would further this oversold bounce. The same is true for RSI. The bull range for RSI is 40 to 100 and the bear range is 0 to 60. A break above 60 puts RSI in a bull range, while a break below 40 puts RSI in a bear range. RSI broke above 60 and turned green in early November and stayed bullish until mid April, which is when it broke below 40 and turned red. RSI bounced along with SPY and is near 60. This is the area where oversold bounces typically fail (see September-October 2023).
No change. The next chart shows QQQ with an outsized decline in mid April and RSI breaking below 40 to move into a bear range. These are medium-term bearish signals that reversed the bull signals from early November. This is when RSI surged above 60 to move into a bull zone and QQQ broke falling channel resistance. Short-term, QQQ broke out with a close above short-term resistance on Friday and gained another 1.1% on Monday. The breakout zone is the first level to watch for a failure. A close below 432 would call for a re-evaluation.
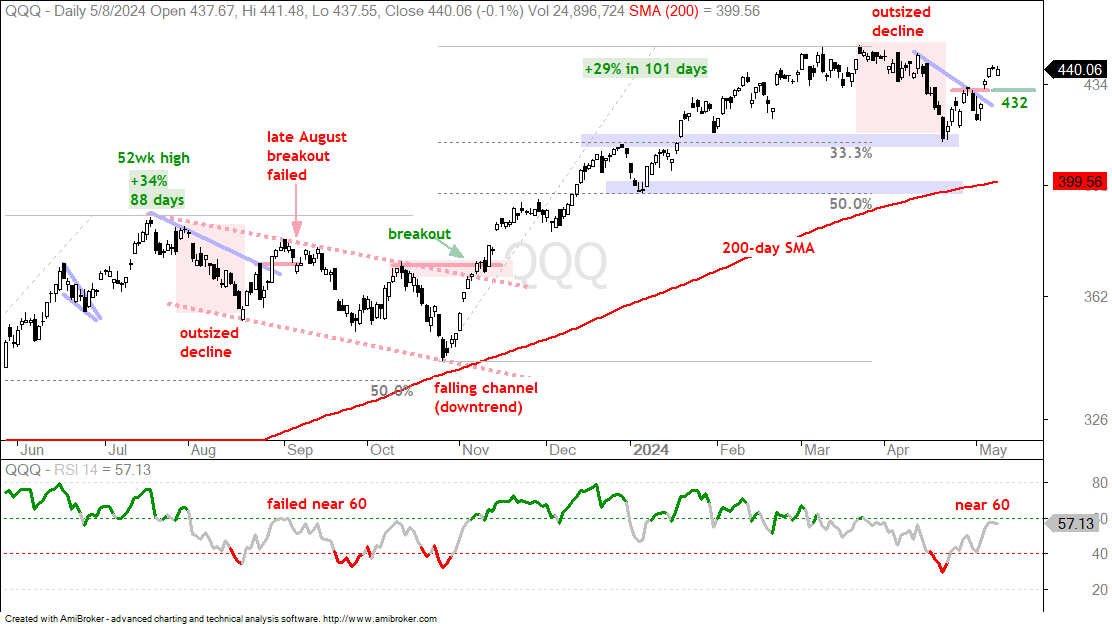
As with SPY, I am comparing the current breakout with the breakout in late August 2023. QQQ peaked soon after this breakout and RSI never made it back above 60. RSI is currently near 60 and this is the moment of truth for the breakout.
Chart Analysis, Setups and Trading Ideas
The following charts show price bars with the 200-day SMA (red line), the price-relative (ITB/RSP ratio) with the 200-day SMA and the percentage difference between the 5 and 200 day SMAs. On the price chart, I am looking for tradable pullbacks within a bigger uptrend or bullish consolidation patterns. With the price-relative, I am looking for relative strength. The price-relative (ITB/RSP ratio) rises when the ETF or stock outperforms. And finally, the percentage difference between the 5 and 200 day SMA is bullish (long-term uptrend) with a move above 3% and stays bullish until a move below -3%. This indicator measures the tide.
Bank SPDR Challenges Consolidation Resistance
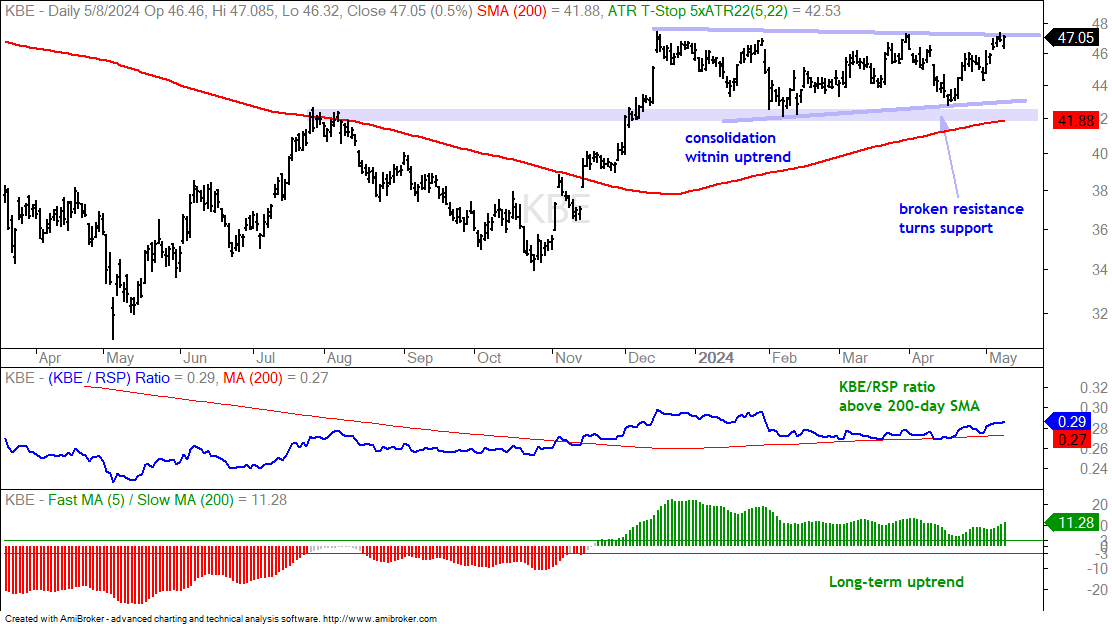
The Bank SPDR (KBE) is one of the stronger ETFs since April and is on the verge of breaking out. The chart shows KBE surging 40% from late October to mid December and then embarking on a long triangle consolidation. A consolidation after a big advance is typically a continuation pattern that represents a rest within the uptrend. KBE fell with the market in the first half of April, but rebounded the last four weeks and is already back near its late March high. A triangle breakout would signal a continuation higher.
Vertex Breaks Wedge Resistance
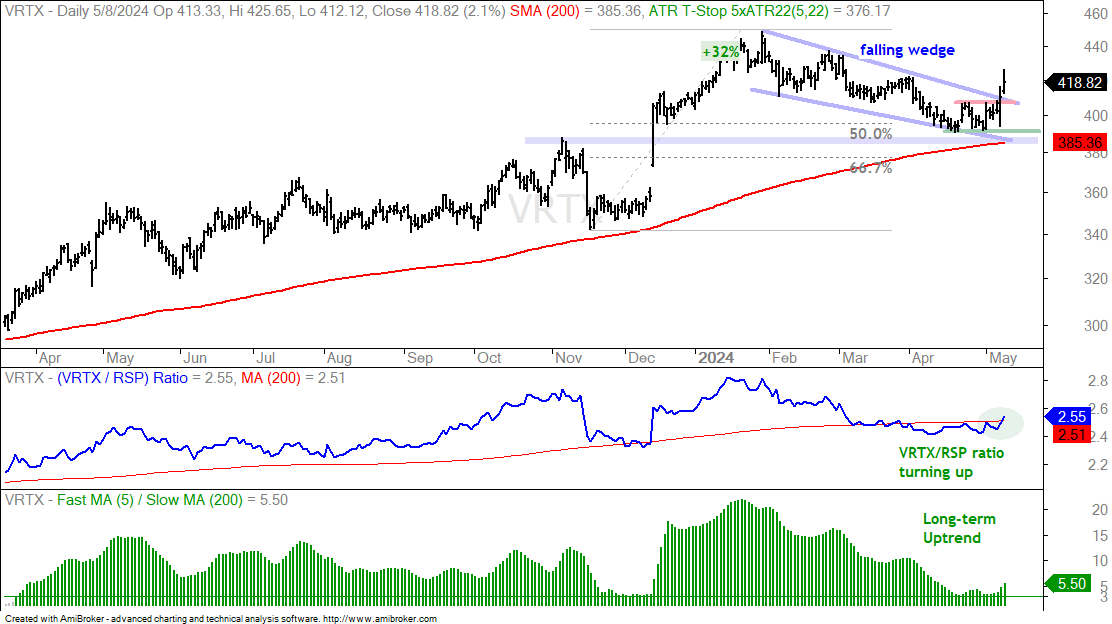
The next chart shows Vertex Pharmaceuticals (VRTX) with a 32% advance into early February and a falling wedge correction into early May. This wedge retraced 50 to 67 percent of the prior advance and returned to the breakout zone (blue shading). The rising 200-day SMA also came into play around 385. The wedge pattern, the retracement amount and the return to the prior breakout are hallmarks of a correction within a bigger uptrend. VRTX reversed the falling wedge with a breakout over the last three days. This bullish breakout signals a continuation of the bigger uptrend. I would set a re-evaluation level at 391 (April-May lows).
Confluent Breaks Channel Resistance
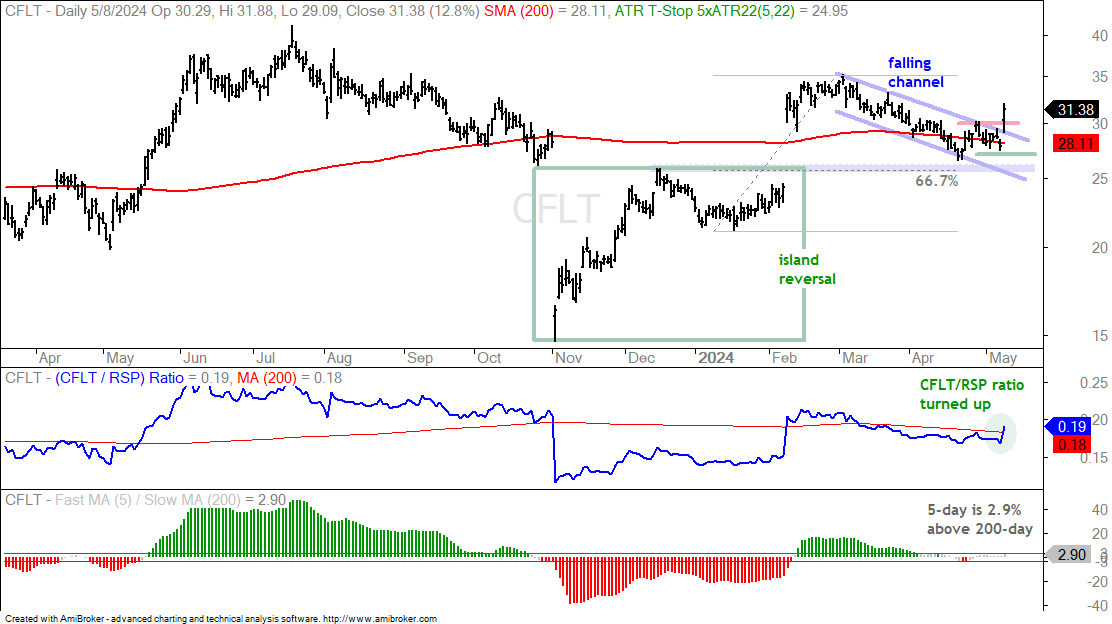
The next chart shows Confluent (CTLT) with a big surge and channel breakout on Wednesday. Overall, we can see an island reversal with a big gap in February. CFLT corrected after this big move with a falling channel that retraced almost 66.7% of the January-March advance. Also notice that the stock returned to the December high, which marked resistance. Overall, the decline into May had the hallmarks of a correction within a bigger uptrend. I saw these patterns in VRTX and CFLT last week, but did not feature them because they both reported earnings this week. Earnings have past and the reaction is bullish. CLFT broke out with a gap and outsized surge. I would mark re-evaluation support at 27, a break of which would negate this breakout. CLFT closed at 31.38 and this re-evaluation level is some 14% lower. This stock has above average volatility, which means above average reward potential and above average risk.
Union Pacific Surges off Rising 200-day SMA
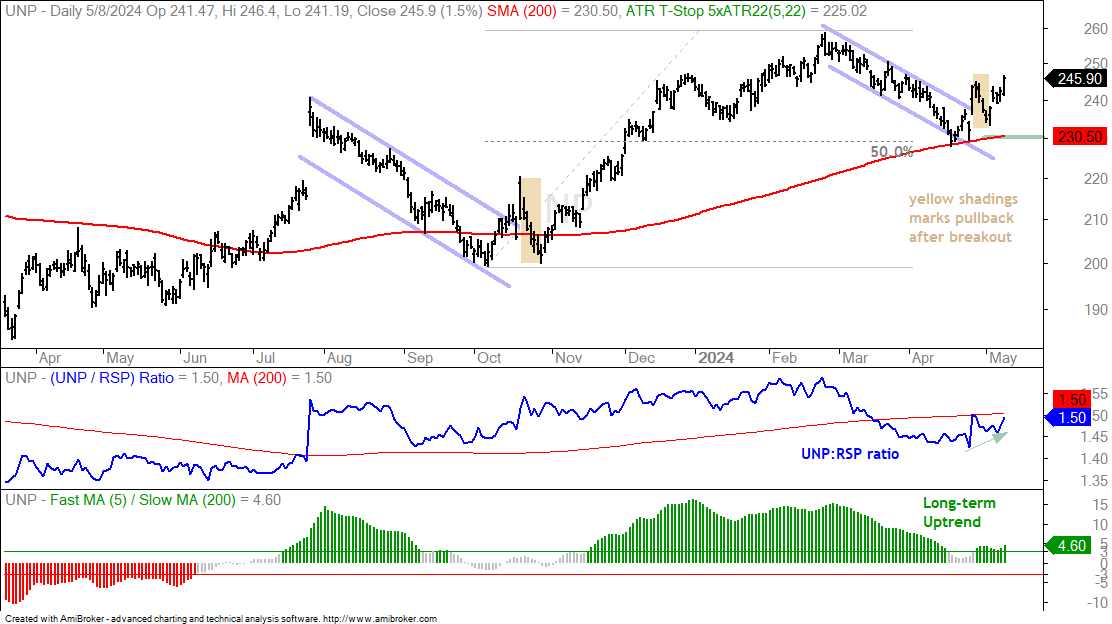
The next chart shows Union Pacific (UNP) with a correction-breakout sequence. UNP hit a new high in February, corrected into April with a falling channel, retraced 50% and returned to the rising 200-day. The stock broke out with a surge on April 25th and then fell back with a four day pullback. Pro Tip: A 2-5 day pullback after a breakout surge can often provide an opportunity to partake in the breakout with a better reward/risk ratio. Overall, this breakout is bullish and signals a continuation of the bigger uptrend. I would use the rising 200-day as a re-evaluation level.
Varonis Systems Bounces off Support
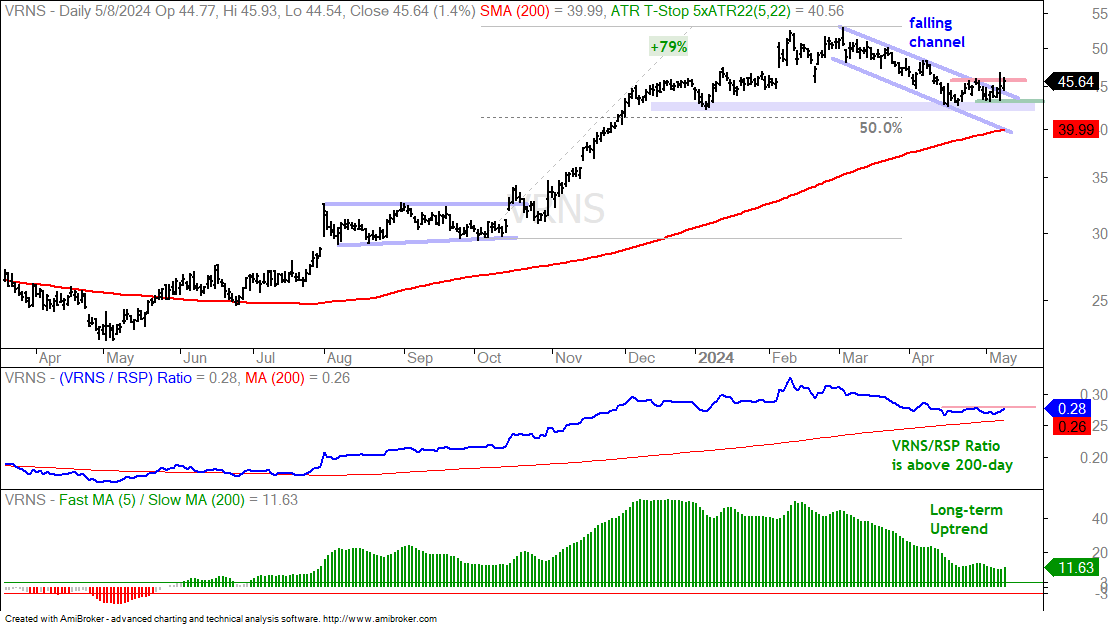
The next chart shows Varonis Systems (VRNS) hitting support from the early January low and bounce the last five days. The overall setup is similar to those above: long-term uptrend, correction, falling channel, 33-50 percent retracement and support zone. The stock broke the channel trendline and further strength with a close above the late April high (red line) would be bullish. I would then mark re-evaluation support using the May lows (43).
Oracle Returns to Breakout Zone
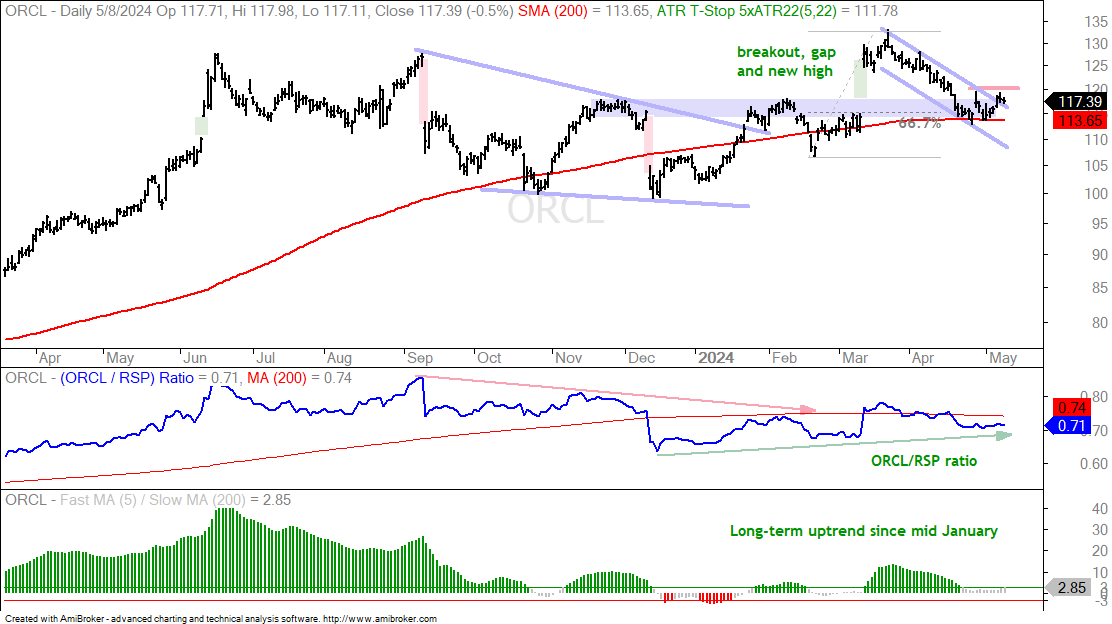
The next chart shows Oracle breaking out with a big gap in mid March and returning to its breakout with a decline into early May. There are four gaps shown on this chart and each corresponds to earnings. These are marked with the red and green shading. Oracle next reports on June 18th. Even though ORCL has been all over the place and nowhere since July 2023, I think the stock has an upward bias and is trading at a turning point. The decline into early May retraced around 66.7% and returned to broken resistance (blue shading). ORCL firmed in the 110-120 area the last two weeks and a breakout at 120 would be bullish. Upon a breakout, I would use the late April low (call it 113) to mark re-evaluation support.