
Video and Report Headlines
- Defensive Sectors Take the Lead
- Breadth Indicators Remain in Corrective Mode
- SPY and QQQ Remain in Corrective Mode
- META’s Reversal and Lesson from October
- NVDA’s Correction and Lesson from January
The next Chart Trader will be posted on Tuesday morning, April 30th.
Defensive Sectors Take the Lead
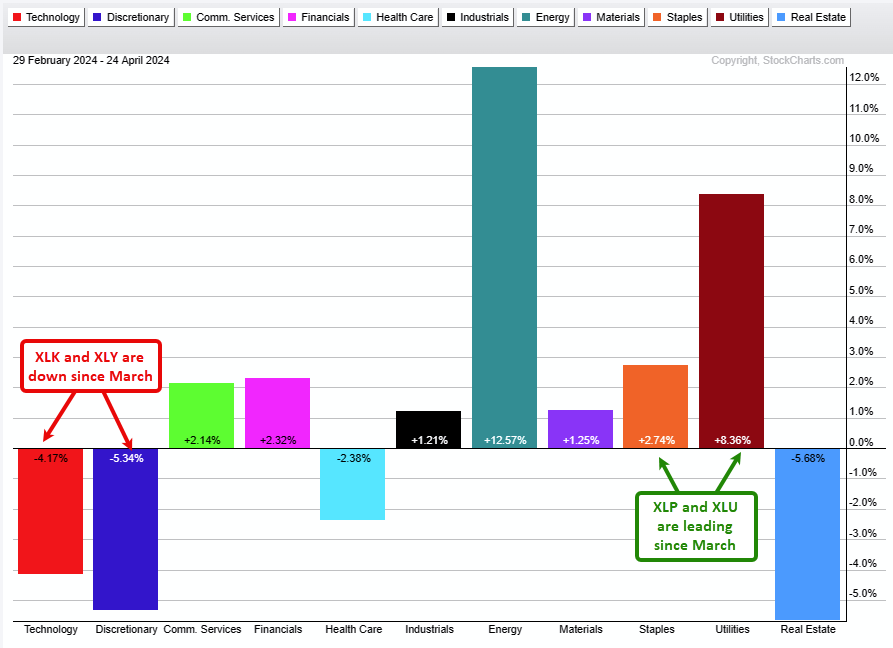
Some 75% of stocks in the S&P 500 and Nasdaq 100 report earnings in the next three weeks. Ugh! META reported last night and the stock fell around 13% in after hours trading. Microsoft (MSFT) and Alphabet (GOOGL) report after the close today. AMZN reports on April 30th, Apple (AAPL) reports on May 2nd and Nvidia (NVDA) reports on May 22nd. I will not speculate on earnings, but volatility is rearing its ugly head and the tone is changing. I am not calling for a bear market, but the weight of the evidence calls for a correction. The PerfChart below shows the Technology SPDR (XLK) and Consumer Discretionary SPDR (XLY) with losses since March. Meanwhile, the Energy (XLE), Consumer Staples SPDR (XLP) and Utilities SPDR (XLU) are the top performing sectors. The market favors defense over offense now. XLP, XLU, XLV and PBJ were featured on Tuesday.
Breadth Indicators Remain in Corrective Mode
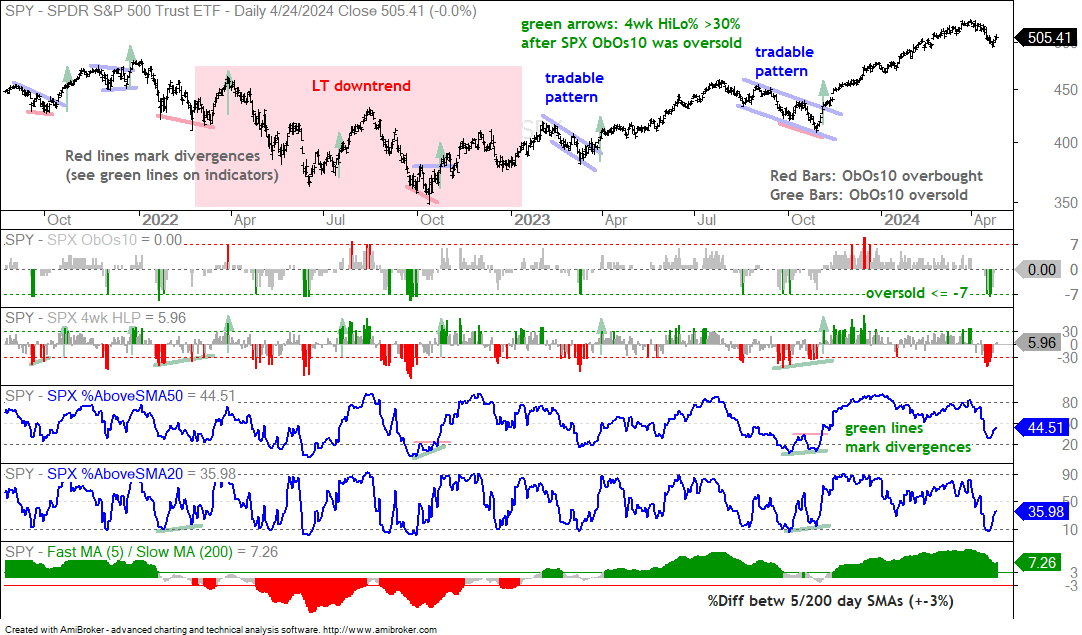
The chart below shows SPX ObOs10 becoming oversold last week with dips to -7 or lower (top indicator window). This indicator is explained in detail below the second chart. An oversold reading alerts us for a bounce and SPY bounced the last three days. This bounce, however, was not strong enough to signal the end of the correction as 4wk High-Low Percent did not exceed +30%. I do not see a tradable pattern on the price chart because the April decline was too steep for a falling flag or wedge. Furthermore, the %Above 50 and 20 day indicators have not had time to form divergences, as they did in September-October (green lines). Thus, I will let this correction run its course until the oversold setup turns into a bullish signal.
The next chart shows QQQ with the same indicators. NDX ObOs10 became oversold last week and QQQ bounced this week. The setup is the same as with SPY. NDX 4wk High-Low Percent needs to clear +30% to turn this oversold setup into a bullish signal. It is not even close. I do not see a tradeable pattern on the chart because the April decline was too steep for a falling flag or wedge. The NDX %Above 50-day and %Above 20-day indicators became oversold as well last week, but have not had time to form divergences that could also provide a setup/signal. Thus, I will let the correction run its course.
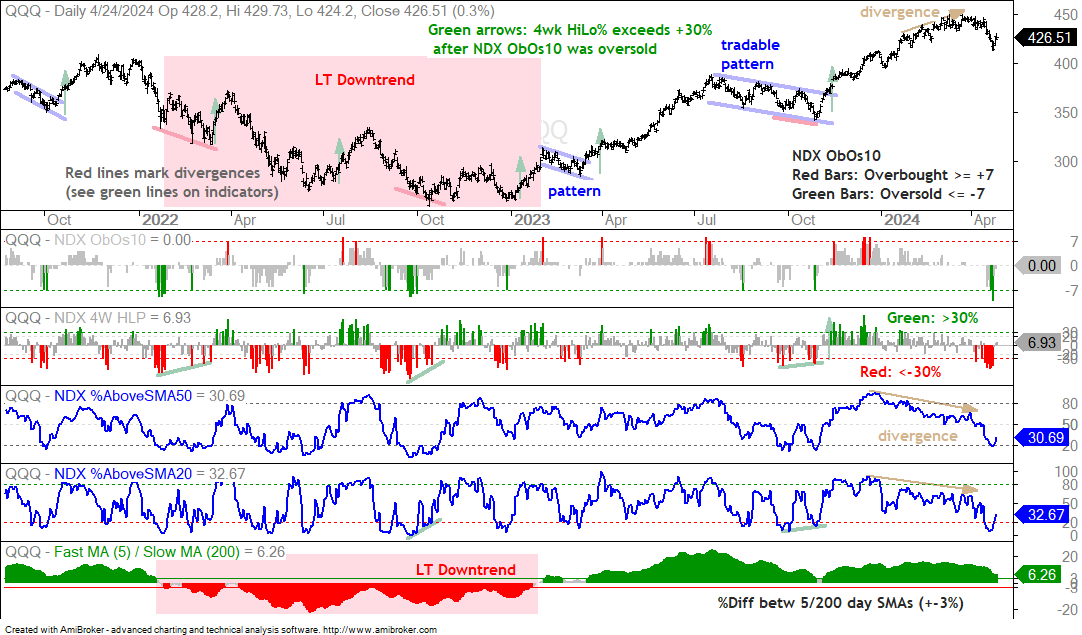
About the Indicators: The first window shows SPX ObOs10, which is an overbought and oversold oscillator based on five S&P 500 breadth indicators and five momentum indicators. NDX ObOs10 uses five Nasdaq 100 breadth indicators and the same five momentum indicators. The breadth indicators are the McClellan Oscillator, %B, 10-day EMA of AD%, %Above 50-day SMA and 4wk High-Low Percent. The momentum indicators are %B, RSI, CCI, Stochastics and Normalized ATR (ATR%). Basically, the ObOs10 indicators aggregate overbought and oversold signals using 10 indicators. They are overbought when at +7 or higher and oversold when at -7 or lower. Overbought and Oversold readings are NOT signals. After an overbought or oversold reading, we turn to the charts and the individual indicators to look for signals. For example: a tradable pattern (falling wedge/channel breakout), an indicator divergence or a 4wk High-Low Percent surge at +30%.
Charles Dow on Retracements and Forecasting
The next charts show SPY and QQQ with the first correction targets (blue shading). A 7% decline from the high would put SPY in the 485 area and near the 33% retracement. According to Charles Dow, secondary declines retrace between one and two thirds of the prior advance. One third is the minimum, two thirds is the maximum and half is the “base case”. The correction from August to October retraced almost two thirds. Even though Dow speculated on retracement amounts, he also asserts that we cannot forecast the length or the duration of a price move. Try as we may. This is why it is best to monitor the decline and wait for signs of a reversal or improving breadth.
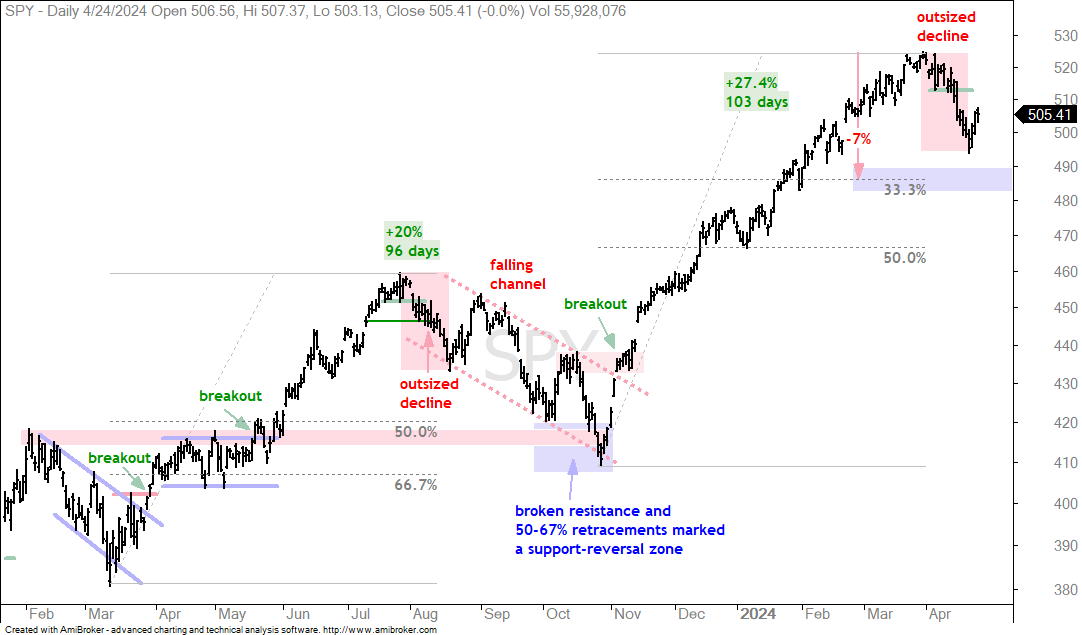
Both charts show two outsized declines (red shading), which are above average declines that derail an uptrend. Outsized declines in August 2023 derailed the uptrends from March to July and led to an extended correction. SPY and QQQ experienced outsized declines in April and these also derailed the uptrends. QQQ fell the hardest and hit its 33% retracement last week. It became oversold last week and bounced this week. I do not view this as the correction ending bounce. Thus, there is a chance that QQQ extends to the 50% retracement in the 400 area.
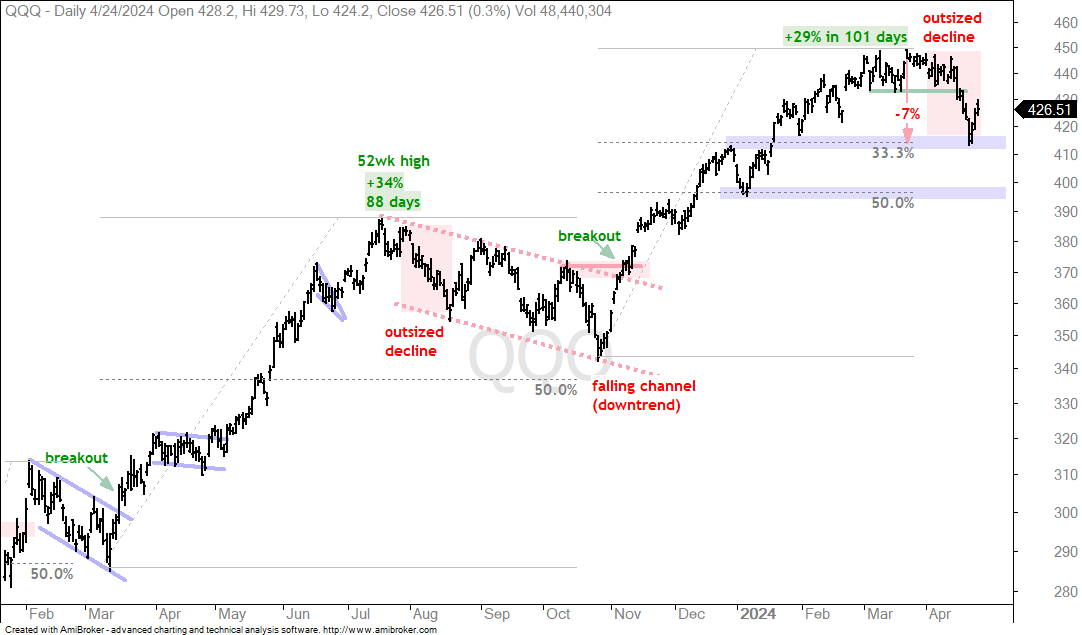
Chart Analysis, Setups and Trading Ideas
META's Reversal and Lesson from October
The chart below shows META with the 125-day SMA, the price-relative (META:RSP ratio) and volume. META jumped 20% after its report on February 1st and then consolidated above 450. The stock is poised to open around 426 (yellow hash mark) and an island reversal would form as long as prices remain below 450. Basically, anyone buying from February 2nd to April 24th would be trapped on the island with losses. Even though this is a bearish reversal pattern, I could still argue that this is a correction within a long-term uptrend. META was up over 80% from late October to early April and is entitled to a corrective process.
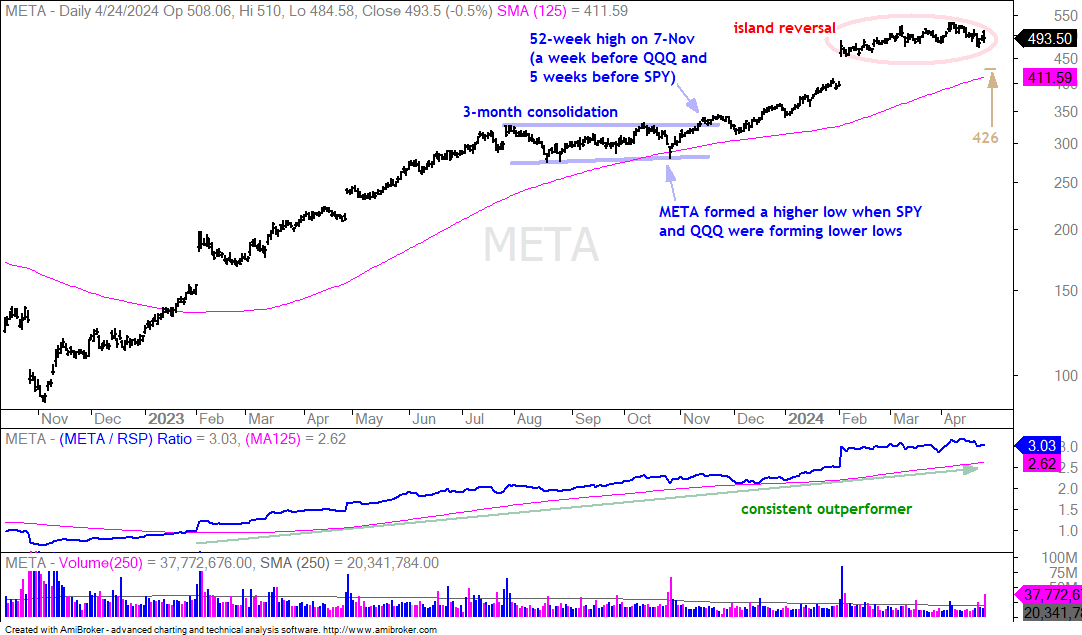
There is a valuable setup and learning experience on this chart. One that we can use in the coming weeks to find the leaders when the current correction in SPY/QQQ ends. The last correction in META was flat and lasted three months (August to October). Notice that META held above its August low in October. SPY and QQQ were forging lower lows at the time and META showed relative strength in late October. This provided the early sign that META was poised to lead. The stock broke out and recorded a 52-week high on November 14th. QQQ forged a 52-week high on November 20th and SPY did not hit a new high until mid December.
I will be watching these two things in the coming weeks. First, look for stocks and ETFs that hold up better than SPY and QQQ during the correction. Second, look for stocks and ETFs that break out ahead of SPY and QQQ. Stocks that hold up better and break out first are often the leaders on the next leg higher.
NVDA's Correction and Lesson from January
The next chart shows Nvidia (NVDA) with a cup-with-handle and breakout in early January. NVDA held up better than SPY and QQQ during the decline from August to October. However, NVDA also forged a lower low in October and did not show as much relative strength as META. NVDA’s moment came in early January as it formed a cup-with-handle, which is a classic bullish continuation pattern that was featured here on January 2nd. The stock was lagging in December, but turned into a leader on January 8th as it broke resistance and forged a 52-week high. SPY and QQQ did not record fresh 52-week highs until January 19th. The early breakout and new high in NVDA showed relative strength that foreshadowed out performance into early March.
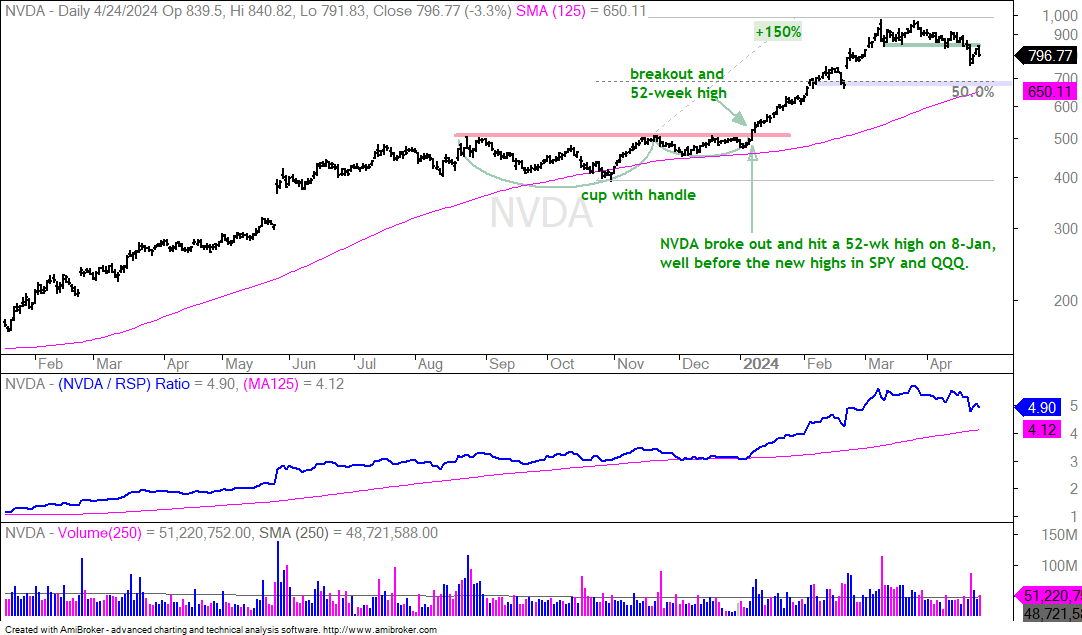
That was then, and this is now. NVDA is currently in correction mode as it peaked in March and broke short-term support in April. A 50% retracement of the October-March advance would return to the 680-690 area and test the mid February low. This is a Support-Reversal Zone to watch in the coming weeks.