Northrop Grumman Bounces off Support-Reversal Zone
Lockheed Martin Goes for a Breakout
Watching the Swing within the Pattern for Eli Lilly
The next Chart Trader will be posted on Thursday morning, January 4th.
Broad Market Recap
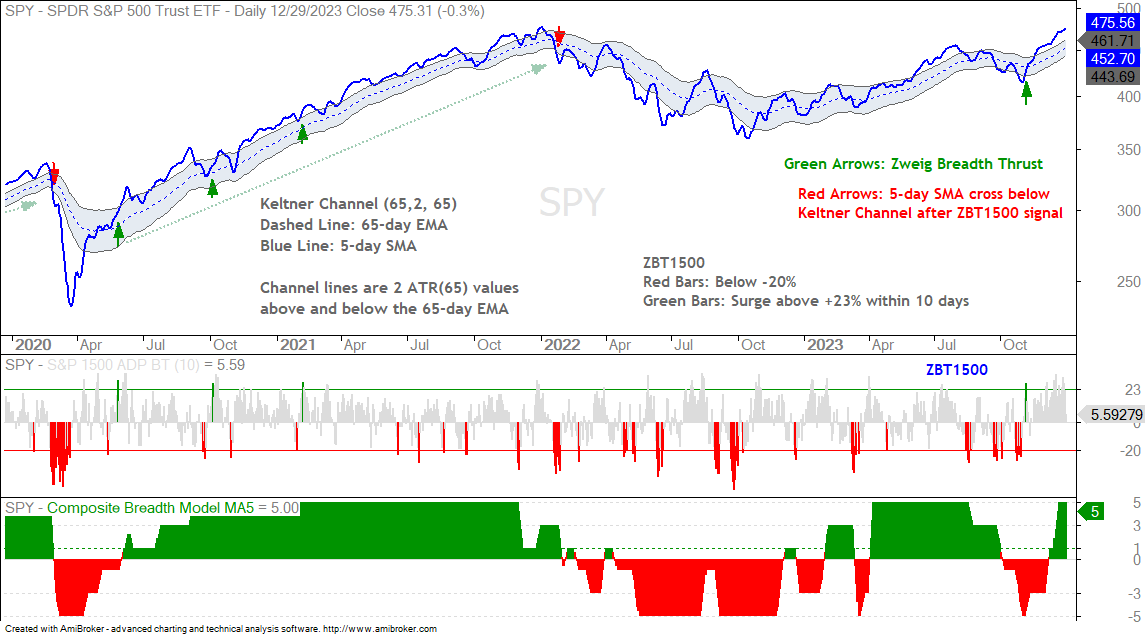
Let’s first recap the broad market environment. The most recent bull run started with an S&P 1500 Zweig Breadth Thrust on November 3rd. This initial surge extended throughout November and the Composite Breadth Model turned bullish on December 7th, which is when the 5-day SMA of the CBM hit +1. The CBM is currently at +5 because all five inputs are bullish. These include the S&P 500 Thrust and Trend Models, the S&P 1500 Thrust and Trend Models, and the 5/200 day SMA cross for the S&P 500.
Short-term, stocks are extended after sharp gains since October 30th (43 days). The major indexes are up more than 10%: SPY +14.74%, QQQ +18.66%, IWM +23.73%. 90 of the 272 ETFs in the MasterList are up more than 20%. As we know, stocks can become short-term overbought and remain overbought. Stocks were “overbought” in early November and remained strong throughout December. We will eventually see a correction, but timing a correction is not easy with the bulls running wild.
SPY and QQQ are Near New Highs
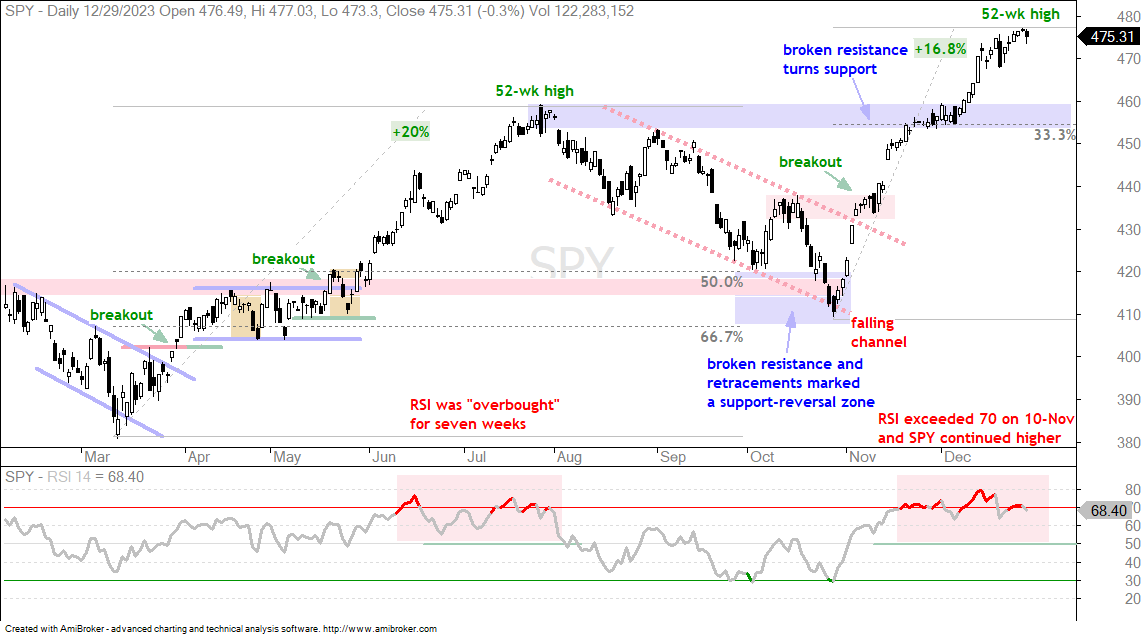
The chart below shows SPY hitting new highs throughout December and finishing the year near a new high. SPY is in a long-term uptrend with the new high and a short-term uptrend since the early November breakout. This is one steep advance that shows little sign of reversing. Once a pullback starts, I would look for support near broken resistance and the 33% retracement (blue shading).
The indicator window shows RSI moving above 70 on November 10th to become “overbought”. Becoming short term overbought is NOT bearish. Why? Because overbought is a sign of strong buying pressure. Technically, RSI becomes overbought when it moves above 70. While a move below 70 means it is no longer overbought, RSI is still bullish as long as it remains above 50. This is the mid point of the RSI range, which is from 0 to 100. The cup is half full when above 50 (bullish) and half empty when below 50 (bearish). After a move above 70, RSI remains bullish until it moves below 50. On the chart above, RSI exceeded 70 on June 12th and did not break below 50 until early August, some seven weeks later. Currently, RSI became “overbought” and remains well above 50 (six weeks and counting).
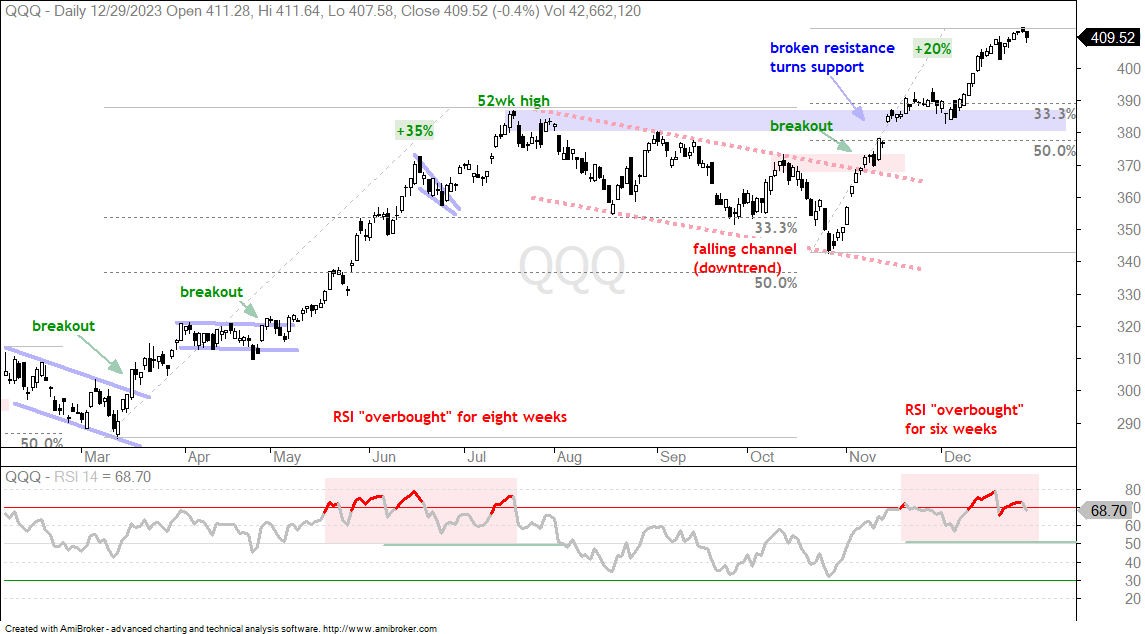
The next chart shows QQQ with a 20% advance off the late October low. QQQ hit new highs from mid November into yearend, and finished the year near a new high. As with SPY, QQQ is short-term extended, but showing no signs of weakness. Should we see a pullback, broken resistance turns first support (blue shading). This area also marks a 33-50 percent retracement of the 20% advance.
The indicator window shows RSI exceeding 70 in mid November and remaining strong for six weeks now. Notice how RSI hovered in the 70 area for eight weeks from mid May to mid July (red shading). I would consider RSI overbought and bullish as long as it holds above 50. A move below 50 would show a loss of momentum that could foreshadow a correction.
Semis, Software and RSI
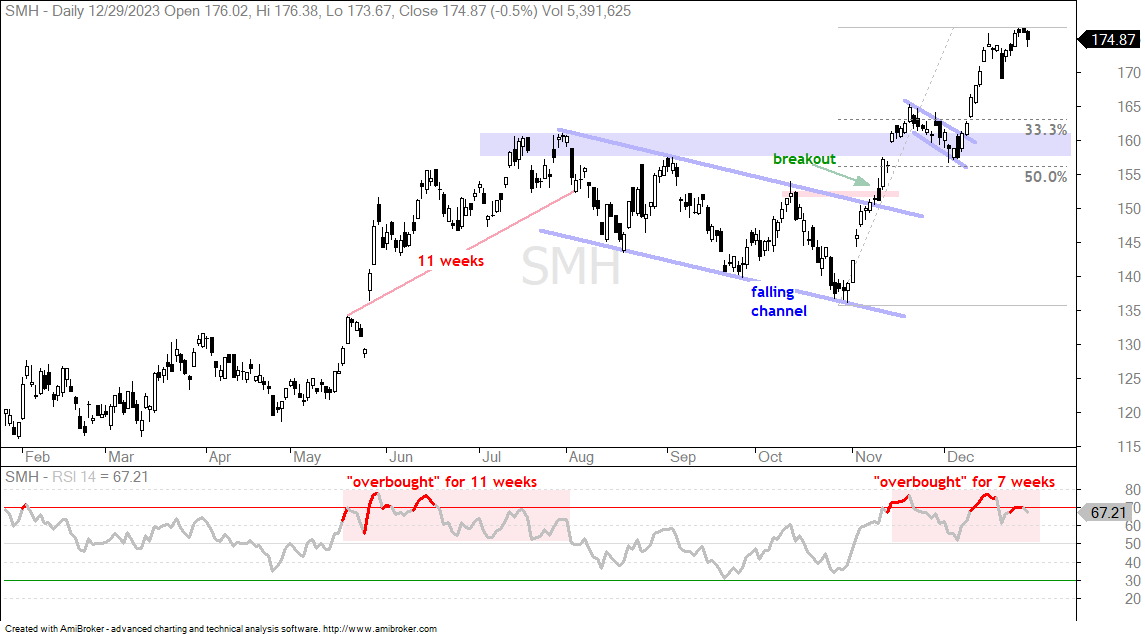
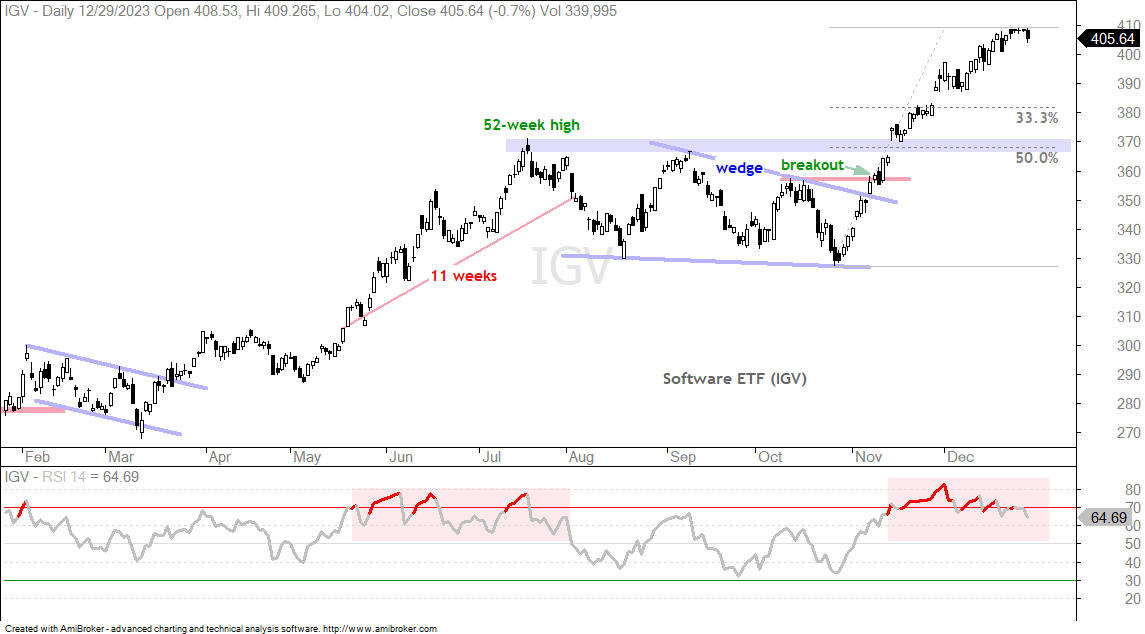
The charts below shows the Semiconductor ETF (SMH) and Software ETF (IGV) with characteristics similar to QQQ. RSI moved above 70 in mid-May and did not break below 50 until early August. Most recently, RSI moved above 70 on November 14th and remains bullish as long as it holds above 50.
Seasonal Pattern for S&P 500
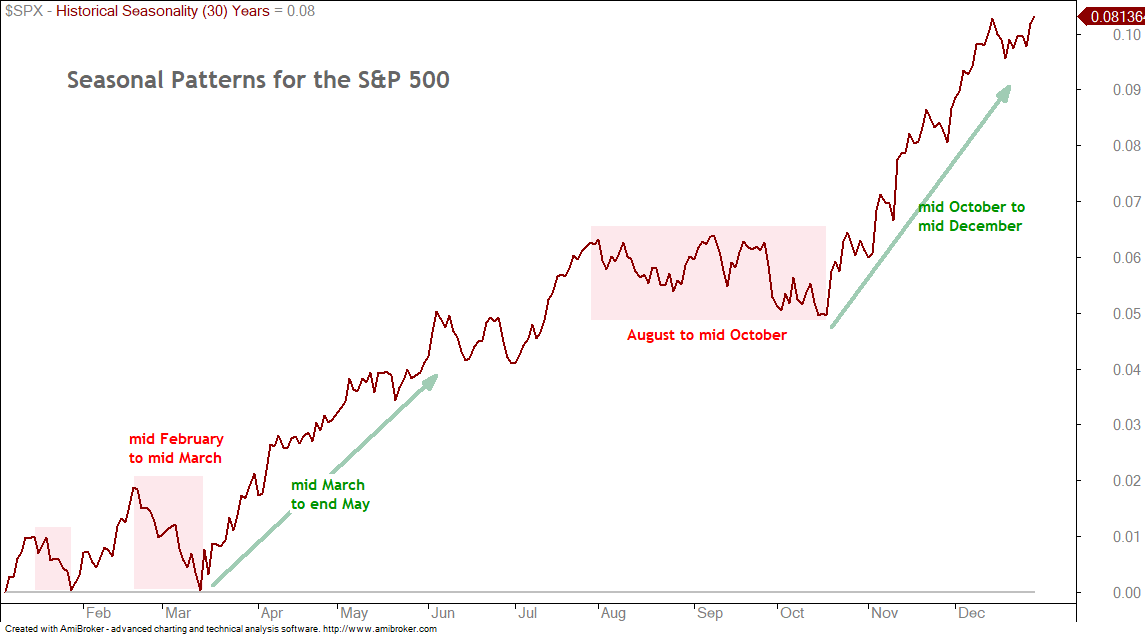
Seasonal patterns may offer a clue for the coming weeks. The chart below shows the seasonal pattern for the S&P 1500 over the last 30 years. Four periods stand out. First, there are two exceptionally strong periods: mid-March to end-May and mid-October to mid-December (green arrows). The first period ends along with the best six months pattern, which is always featured in the Stock Trader’s Almanac. According to Jeffrey Hirsch, the best six months runs from November to April (sell in May and go away). The worst six months runs from May to October.
The two negative periods are from mid February to mid March and August to mid October (red shading). Seasonally speaking, February is one of the weakest months. This weak period then gives way to an exceptionally bullish period. Weakness from August to mid-October also gives way to an exceptionally bullish period the rest of the year.
Looking ahead for the current market, one could envision strength into mid-January and then a pullback in the second half of January. This first pullback will likely entice buyers and produce a bounce into early February. We could then see a decent pullback or correction from mid-February into March.
Chart Analysis, Setups and Trading Ideas
Energy ETFs Firm in Support-Reversal Zones
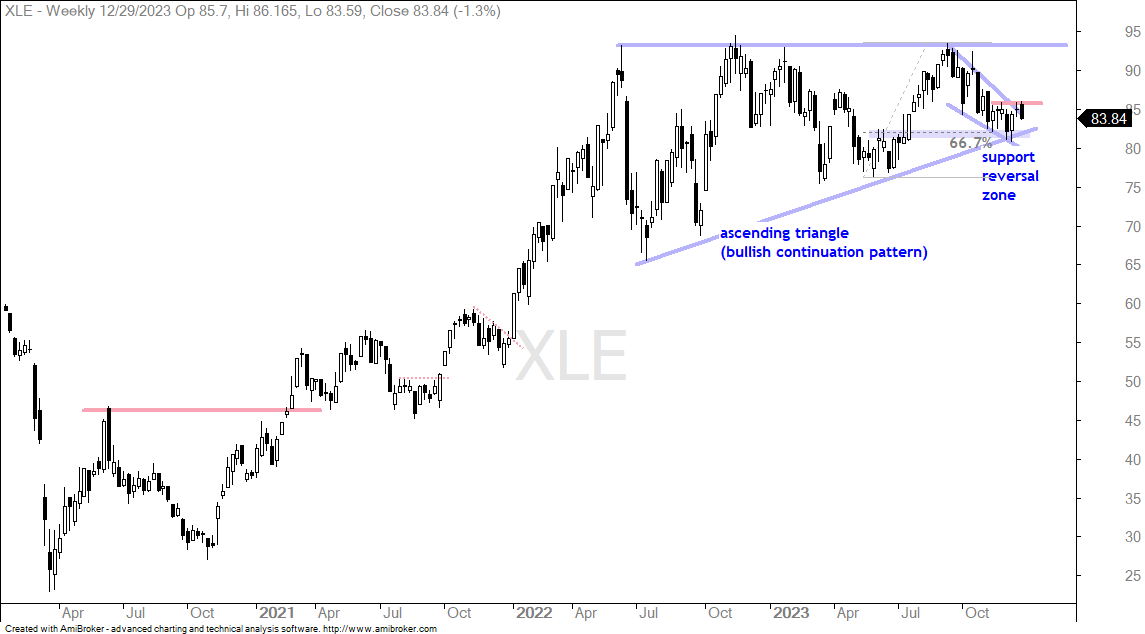
The Energy SPDR (XLE) and Oil & Gas Equipment & Services ETF (XES) did not partake in the broad market advance the last two months. Even so, both are in long-term uptrends and firming in support-reversal zones. The first chart shows XLE with a large Ascending Triangle taking shape. This is a bullish continuation pattern and a break above the summer high would confirm the pattern. The swing within the pattern is down as a falling wedge formed. XLE is finding support near the 67% retracement and broken resistance. This is a support-reversal zone. A breakout at 86 would reverse this downswing and increase the odds for a bigger breakout.
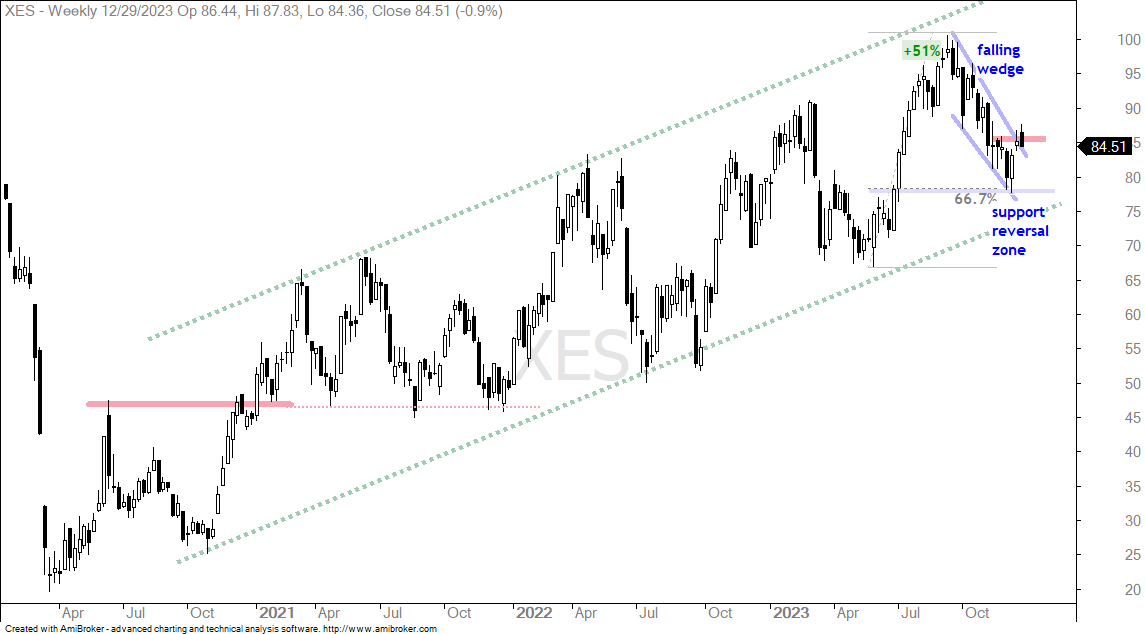
The next chart shows XES with a very choppy uptrend since the breakout in late 2020 (green dashed lines). XES hit a new high in mid September and then fell the last 14 weeks. Overall, the decline retraced around 67% of the prior 51% advance. It also returned to the breakout zone, which turns support. The falling wedge defines this downswing with resistance marked at 86. A breakout here would be bullish.
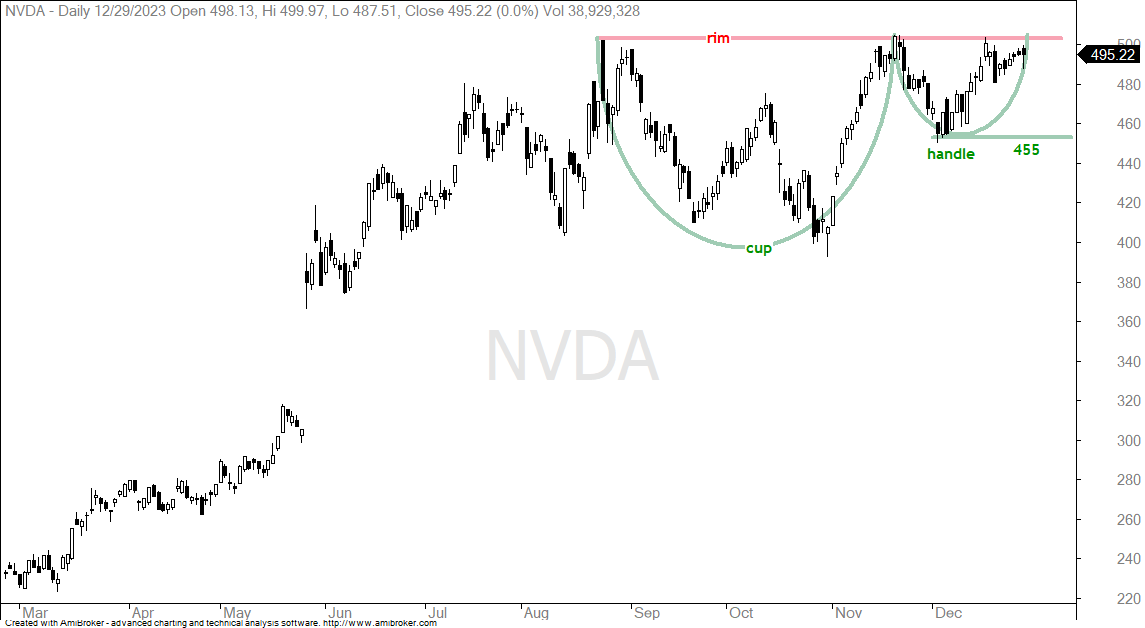
Nvidia Forms Cup-with-handle
Nvidia (NVDA) is tracing out a classic bullish continuation pattern. Popularized by William O’Neil of IBD, the cup-with-handle is a consolidation pattern that forms after a big advance. The green lines mark the cup and the handle, while the red line marks rim resistance. Overall, notice that NVDA hit 500 in August and traded flat the rest of the year. This is a consolidation within an uptrend. NVDA is near rim resistance and a breakout here would be bullish. Handle support is set at 455 and a close below this level would negate the pattern.
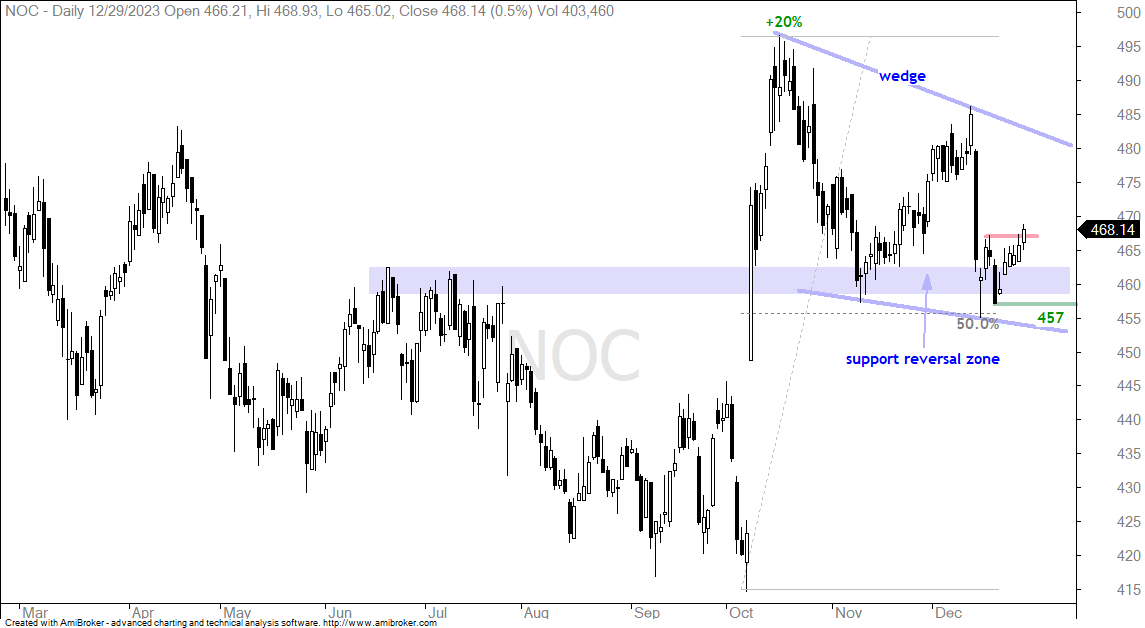
Northrop Grumman Bounces off Support-Reversal Zone
Northrop Grumman (NOC) is part of the Aerospace & Defense ETF (PPA), which is one of the strongest groups right now. NOC, however, has been lagging because it corrected after the 20% surge in October. I consider the decline back to the 455 area as a correction because of the pattern and the retracement amount. A falling wedge formed and this decline retraced half of the 20 percent advance. The decline also returned to broken resistance, which turns support. Overall, the blue shading marks a support-reversal zone. I am using the swings within the falling wedge to get a jump on a bigger breakout at 485. NOC fell sharply in mid December with a long black candlestick. It firmed and broke short-term resistance with a bounce the last seven days. This breakout reverses the downswing within the bigger wedge pattern. It is bullish with first support marked a 457.
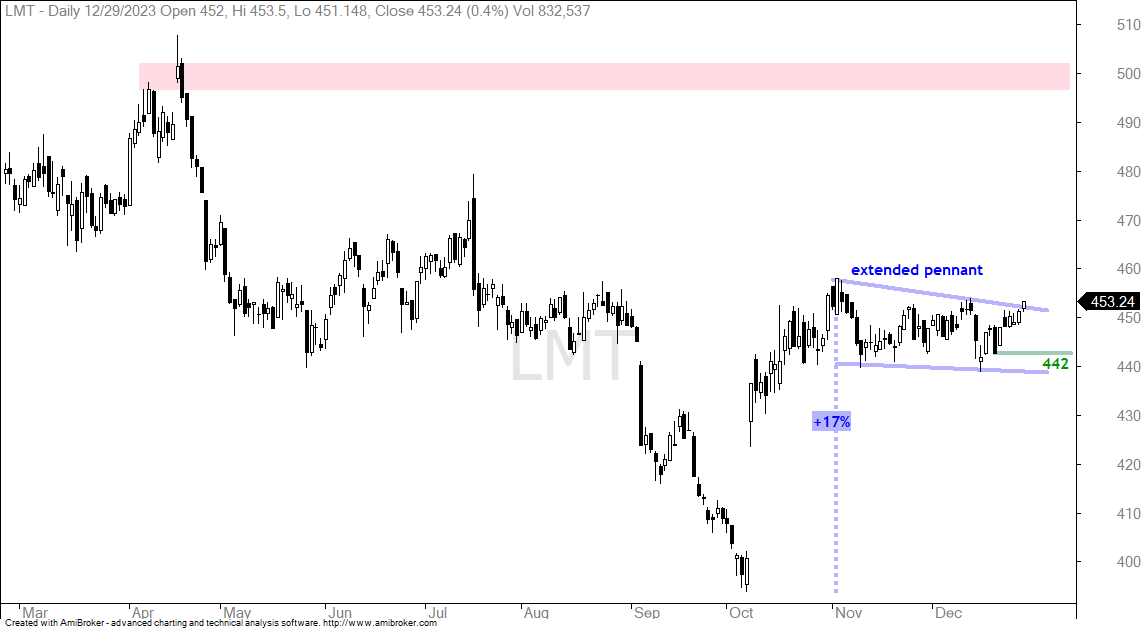
Lockheed Martin Goes for a Breakout
Lockheed Martin (LMT) is also part of the Aerospace & Defense ETF (PPA) and lagging over the last two months. Nevertheless, I see a bullish continuation pattern and a breakout in the making. The stock surged 17% in October and then consolidated with an extended pennant. Pennants are continuation patterns that are dependent on the prior move for their trading bias. The prior move was up so this is a bullish continuation pattern. LMT surged over the last two weeks and is breaking out of this pennant. The upside target is next resistance in the 500 area. Initial support is set at 442 and a close below this level would negate the pennant.
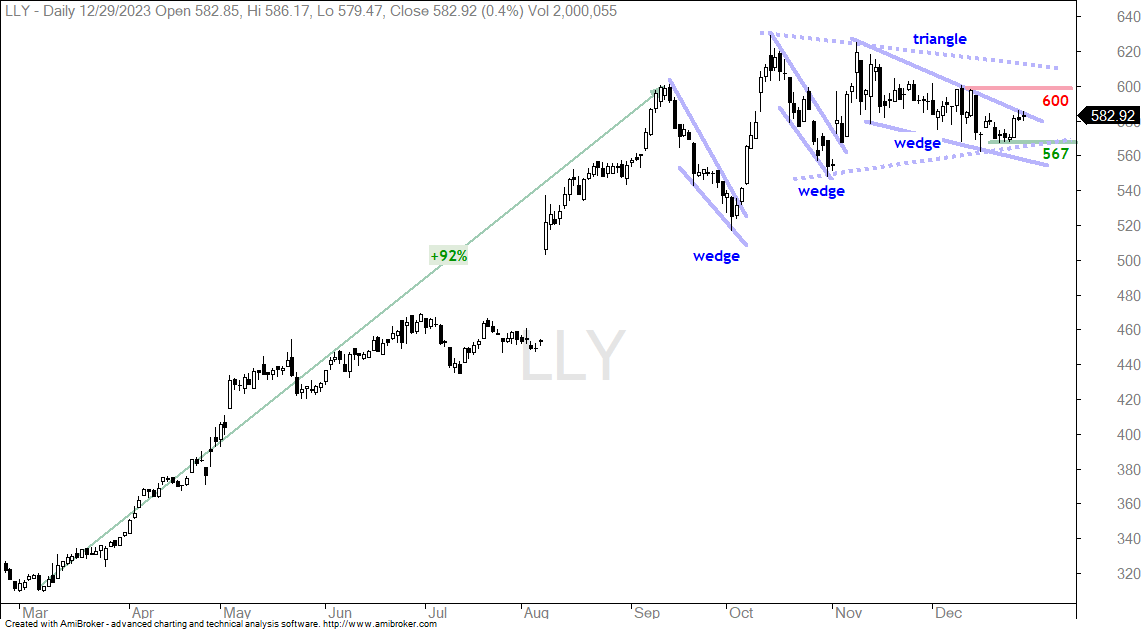
Watching the Swing within the Pattern for Eli Lilly
Eli Lilly (LLY) is in a long-term uptrend with a triangle consolidation possibly forming (dashed lines). The stock hit a new high with a move to 620 in October and then traded sideways the rest of the year. Overall, I view this as a consolidation within an uptrend and a bullish continuation pattern. A breakout in the 620 area would be bullish. The swing within the pattern is down with a falling wedge taking shape. I am marking wedge resistance at 600 and a breakout would reverse this downswing. This is the breakout that provides the early jump on the triangle breakout. Upon a breakout at 600, I would mark first support at 567.