

Mid-Cap Breadth Indicator Sets Up as Underlying ETF Battles Make or Break Zone
- Arthur Hill, CMT
Welcome to the Chart Fix!
The S&P Mid-Cap 400 ETF was hit hard September, but the long-term uptrend remains intact as the ETF hits a make or break zone this month. Breadth also took a hit as it became oversold for the first time since March. This oversold condition could lead to a thrust signal as mid-cap breadth improved in October. Today’s report will detail the breadth setup and define the make or break zone for IJH.
Recent Reports and Videos at TrendInvestorPro
- XLE Outperforms XLK, Oil Services and MLP ETFs Set Up (Thur)
- Software vs Semis, IGV/XSW Hold Uptrends, Adobe Turns (Wed)
- Yield Spreads Widen as Stress Hits Credit Markets (Wed)
- QQQ Outsized Decline, Tech Stumbles, Semis/AI Breakdown (Tues)
- Click here to take a trial and gain full access.
Mid-Cap Breadth Becomes Oversold as Potential Thrust Sets Up
The chart below shows the S&P Mid-Cap 400 %Above 50-day SMA ($MIDA50R) in the top window. This medium-term breadth indicator identifies oversold conditions and subsequent breadth thrusts. Mid-Caps become moderately oversold when this indicator moves below 30%, and truly OVERSOLD when below 20%. Aggressive traders can look for moderately oversold conditions to trade pullbacks within a strong uptrend.
Dips below 20% represent a seriously oversold condition that can lead to a breadth thrust. A move below 20% means more than 80% of mid-caps are below their 50-day SMAs, which is an extreme. A subsequent move above 60% shows a material improvement in upside participation. This means the vast majority of mid-caps participated in the recovery, which gives the recovery legs.
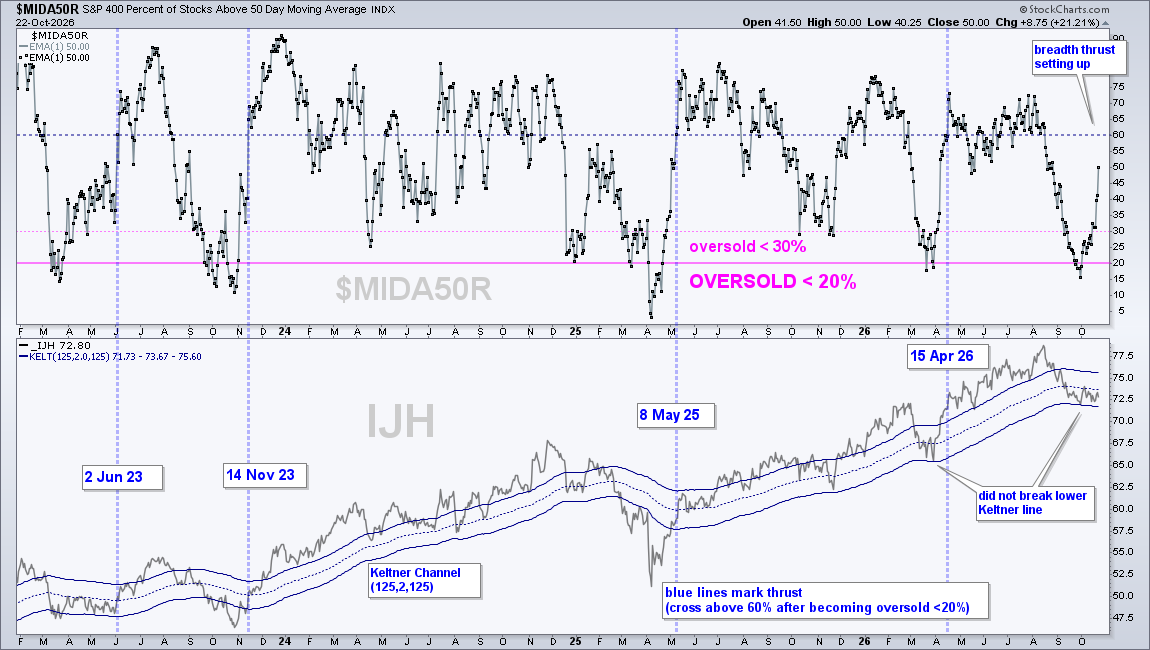
The vertical blue lines show four thrust signals over the last four years (two in 2023, one in 2025 and one in 2026. The indicator set up again in October with a move below 20%. Breadth improved over the last few week as the percentage of mid-caps stocks above their 50-day SMA surged to 50%. This is a great start. Follow through above 60% would trigger a thrust signal.
The bottom window shows IJH with the Kelter Channels (125,2,125). This is a trend-following indicator that chartists can use in conjunction with the thrust setups and signals. A break above the upper line signals an uptrend, while a break below the lower line signals a downtrend. IJH held just above the lower line in September, just as it did in March. A break below the lower line would reverse the long-term uptrend.
The percentage of stocks above the 50-day SMA is one of several indicators chartists can use to identify oversold setups and thrusts. In addition, StockCharts provides breadth indicators for an array of indexes. TrendInvestorPro issued a special report and video covering these indicators and thrust setups. We continue to watch these setups as the market moves into a seasonally favorable, and volatile, period. Click here to take a trial and get this report.
S&P Mid-Cap 400 ETF Hits Make or Break Zone
The S&P Mid-Cap 400 ETF (IJH) is at a make or break zone as it trades just above the lower Keltner Line and near the rising 200-day SMA. IJH fell sharply from mid August to September and then consolidated with a pennant. This is a short-term consolidation that takes its trading bias from the direction of the prior move, which was down. A break below the mid October lows would signal a continuation lower. Such a move would likely lead to a break below the lower Keltner line (see first chart) and put IJH decisively below the 200-day SMA. This is the “break” scenario.
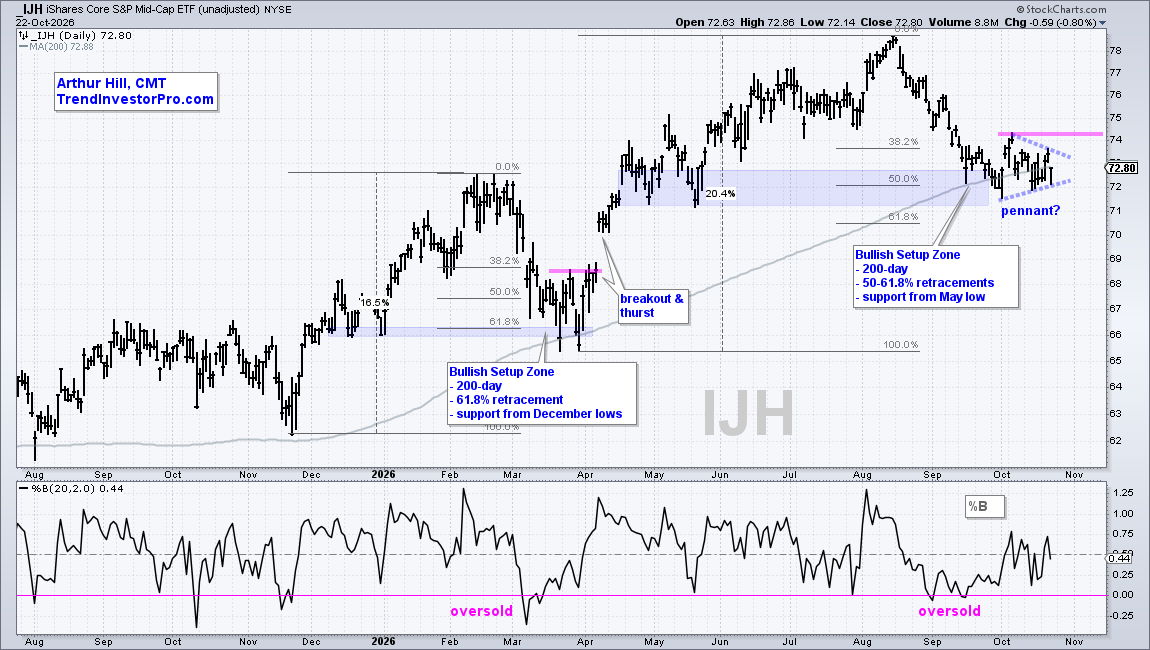
There is also a “make” scenario similar to what we saw in March. IJH surged 20.5% from late March to mid August and then fell to the Bullish Setup Zone in the 72 area (blue shading). Here we have the rising 200-day SMA, the 50% retracement, support from the May low. When an ETF corrects within an uptrend, I use these tools to define an area that could give way to firming and a reversal. Note how IJH firmed in the Bullish Setup Zone in the second half of March and then broke out in early April.
IJH is currently firming in this bullish setup zone as it consolidated in the 73 area since mid September. There was a breakout attempt in early October with the surge above 74, but this failed and the ETF fell back below the 200-day SMA. This pop and drop provides a short-term resistance level to watch for a breakout. A break above the early October high would be bullish, especially if accompanied by a breadth thrust. TrendInvestorPro will follow up on this setup.
TrendInvestorPro specializing in finding tradable pullbacks within uptrends. We brought the IJH setup to our subscribers’ attention in early April, and we are currently following this and other setups. Click here to take a trial to TrendIvestorPro