
Tech Stumbles, but Other Sectors Pick up Slack – Weight of Evidence Bullish
- Arthur Hill, CMT
Welcome to the Chart Fix!
Even though technology is the biggest sector in the S&P 500, there is more to the market than technology, much more. Tech is under pressure, but the weight of the evidence shows that we are still in a bull market. SPY is above its 200-day SMA, as are eight of the eleven sectors. In addition, the vast majority of S&P 500 stocks are above their 200-day SMAs and new highs expanded in November.
Recent Reports and Videos at TrendInvestorPro
- Growth Lags Value as Junk Bonds Signal Risk Off
- Breadth Models Remain Bullish, but Yield Spreads Widen
- Setups for Mag7, Energy, Agribusiness and Cybersecurity
- Industrials SPDR Firms as Aero-Defense ETF Breaks Out
- Click here to take a trial and gain full access.
SPY and Component Stocks in Long-term Uptrends
The first chart shows the 5 and 200 day SMAs for SPY. Note that the price plot is invisible to focus on the 5/200 day cross. Smoothing the close with a 5-day SMA reduces whipsaws and maintains timeliness. SPY is in an uptrend when the 5-day is above the 200-day, which has been the case since early April.
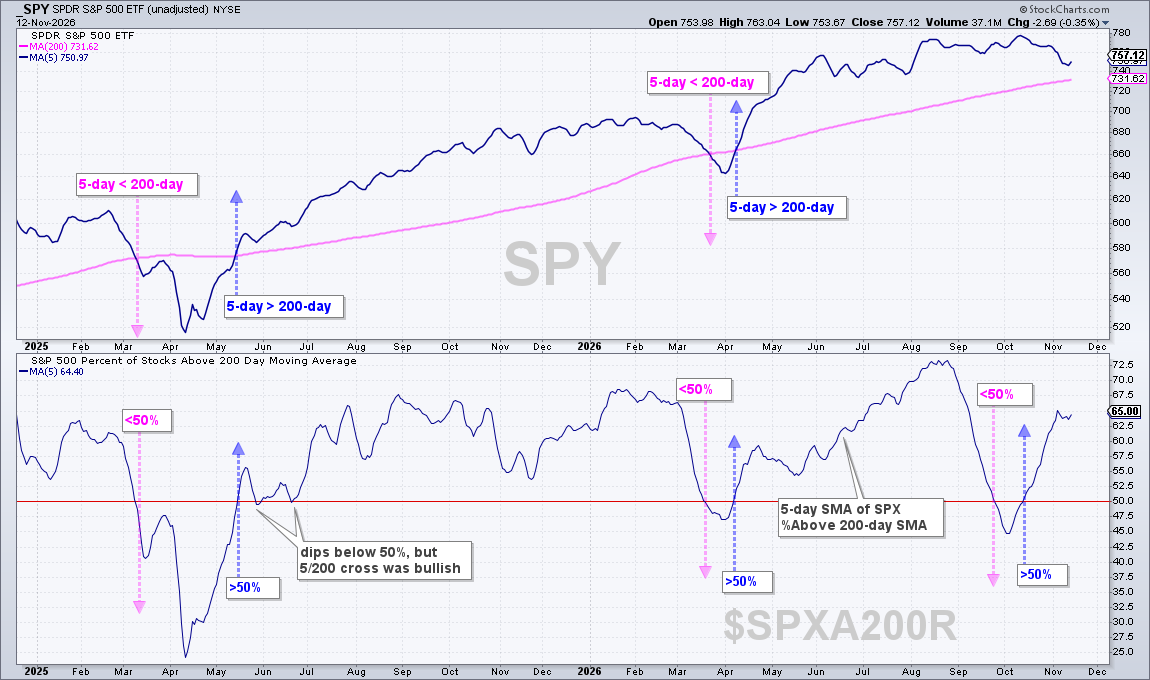
The indicator window shows the 5-day SMA for SPX %Above 200-day SMA ($SPXA200R), which is the percentage of S&P 500 stocks above their 200-day SMAs. Again, smoothing with a 5-day SMA can reduce whipsaws. Currently, 65% of S&P 500 stock are above their 200-day SMAs. The vast majority of S&P 500 components are in long-term uptrends and this supports the bull market thesis. The trouble starts when this 5-day SMA moves below 50%.
There is a bull market somewhere when the 5/200 cross signals uptrend and the majority of S&P 500 stocks are in uptrends. The S&P 500 is the most important benchmark for US stocks and the 200-day SMA is the most widely used long-term trend indicator. When the market environment is bullish, consolidations and pullbacks offer traders opportunities to trade in the direction of the bigger uptrend. In addition, traders should look for bullish setups and focus on areas of strength in bull markets.
This week at TrendInvestorPro, we identified setups in ETFs related to Industrials, Aerospace & Defense, Energy, Agribusiness and Cybersecurity. Even though seasonal patterns are bullish, the market still shows risk aversion that could make or break a yearend rally. Our reports analyzed yield spreads, growth versus value and junk bonds to identify the key risk on/off levels. Click here to take a trial.
New Highs Expand as Other Sectors Pick Up the Slack
The next chart shows SPY with the High-Low Line and New Highs/Lows in the indicator windows. The High-Low Line is a cumulative measure of net new highs (new highs less new lows). It rises when new highs outnumber new lows and falls when new lows outnumber new highs. The High-Low Line turned up in mid October, which means new highs are outpacing new lows. This is also bullish.
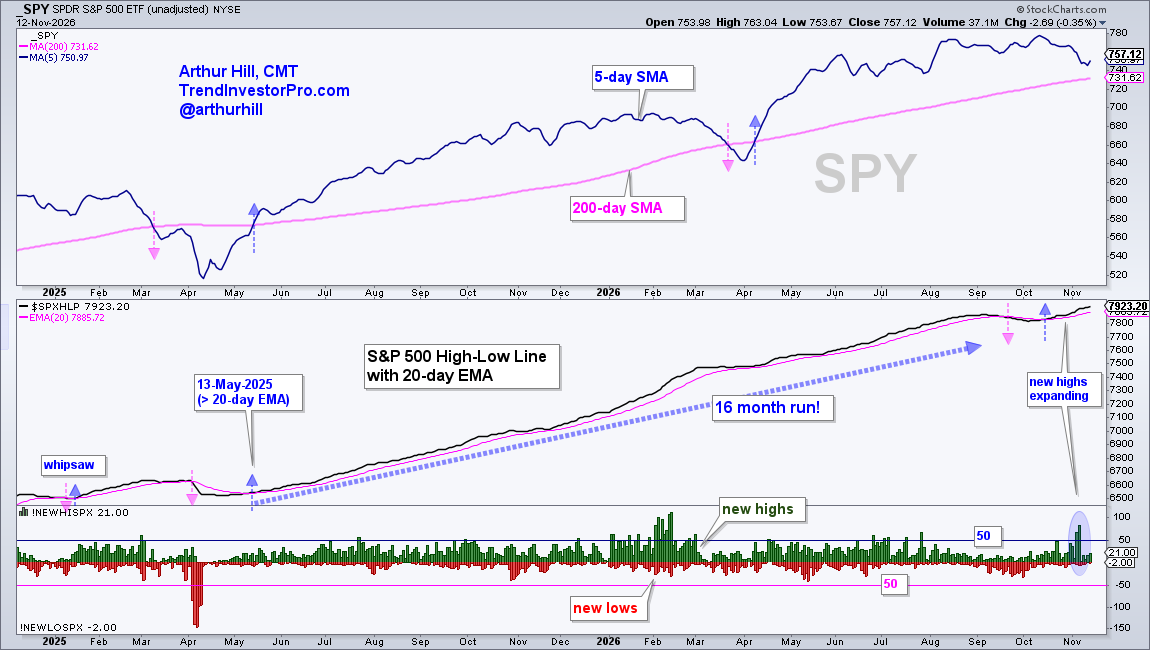
The indicator window shows new highs expanding in November and exceeding 50 twice, which means more than 10% of S&P 500 stocks hit new highs. Stocks hitting new highs are in leading uptrends and this is where we should be focused. Sectors with the most new highs in November include: Finance, Consumer Staples, Healthcare, Industrials, Materials and Energy.
The weight of the evidence remains bullish, but we must also ask ourselves what could go wrong. There is a bonus section in today’s video that addresses this issue using the S&P 500 EW ETF (RSP) and the 10-yr Treasury Yield ($UST10Y).
TrendInvestorPro specializing in finding tradable pullbacks within uptrends. Click here to take a trial and gain full access to our reports and videos.