Systematic Strategies and Next Level Technical Analysis
Bond Breakout – Utes Lead – Gold Forms Bullish Pattern – Healthcare Oversold
Arthur Hill, CMT
Archive
Charts
Use CRTL+P to Print
Report Headlines
– High Yield ETFs on the Move (AMLP, XLU, IYR) – IEF Holds Breakout – Plus Key Level for TLT – TIP Extends on Breakout – GLD forms Bullish Pattern as GDX Breaks out – IBIT Turns Quiet with Tight Range – Healthcare SPDR is Long-term Oversold
The Fed will make its policy statement on Wednesday afternoon and this could cause some volatility in inter-market related assets. These include stocks, bonds, gold, the Dollar and Bitcoin. Yes, Bitcoin is a new addition to the intermarket arena. Today’s report will cover the 7-10Yr TBond ETF (IEF), which is breaking out ahead of the Fed announcement. We are also seeing high-yield ETFs move higher (Utes, REITs and MLPs). I am not sure what drives gold, but GLD formed a bullish continuation pattern within a strong uptrend. Bitcoin is also in a long-term uptrend with a high and tight flag forming. And finally, we will look at the long-term oversold condition in Healthcare.
High Yield ETFs on the Move (XLU, IYR, AMLP)
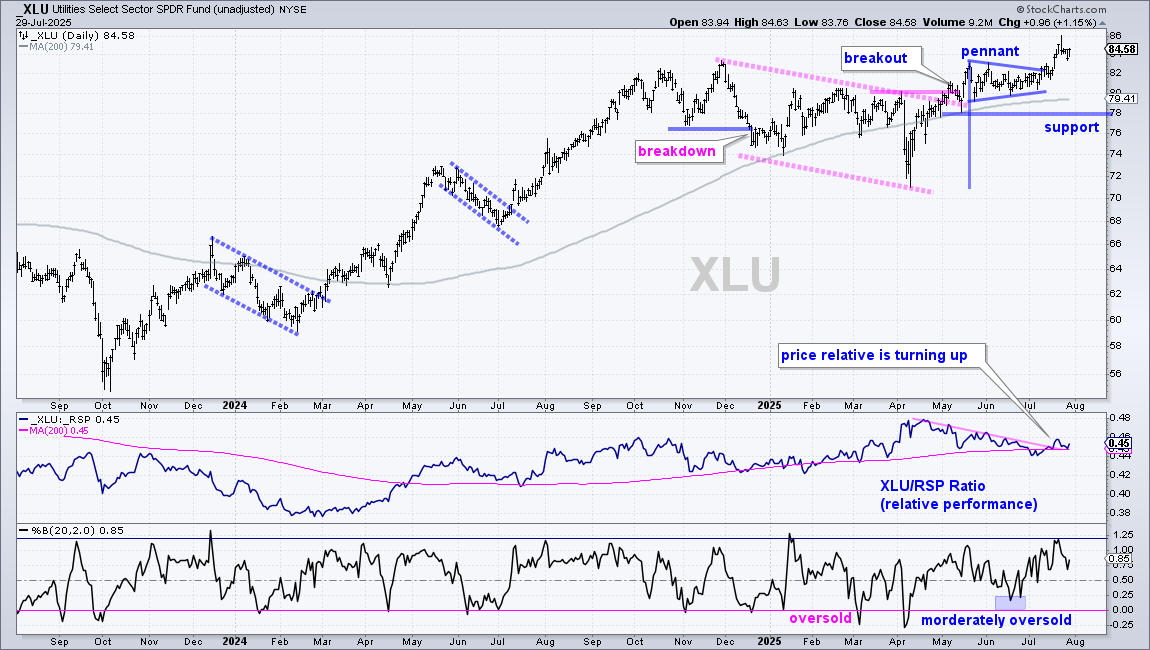
The Utilities SPDR (XLU) may not be leading in percentage terms, but it is leading on the price chart with a new high in July. XLU first caught my attention when it broke out of a falling channel in mid May. This channel represented a correction after the advance from February to November and the breakout signaled a continuation higher. Short-term, XLU surged from 72 to 82 (April-May) and then formed a pennant into early July. The ETF broke the pennant line in mid July and extended to new highs with a move above 84. ETFs recording new highs are in strong uptrends and showing some sort of upside leadership. The middle window shows the price-relative (XLU:RSP ratio) falling into early July and turning up the last few weeks. XLU is starting to show relative strength again.
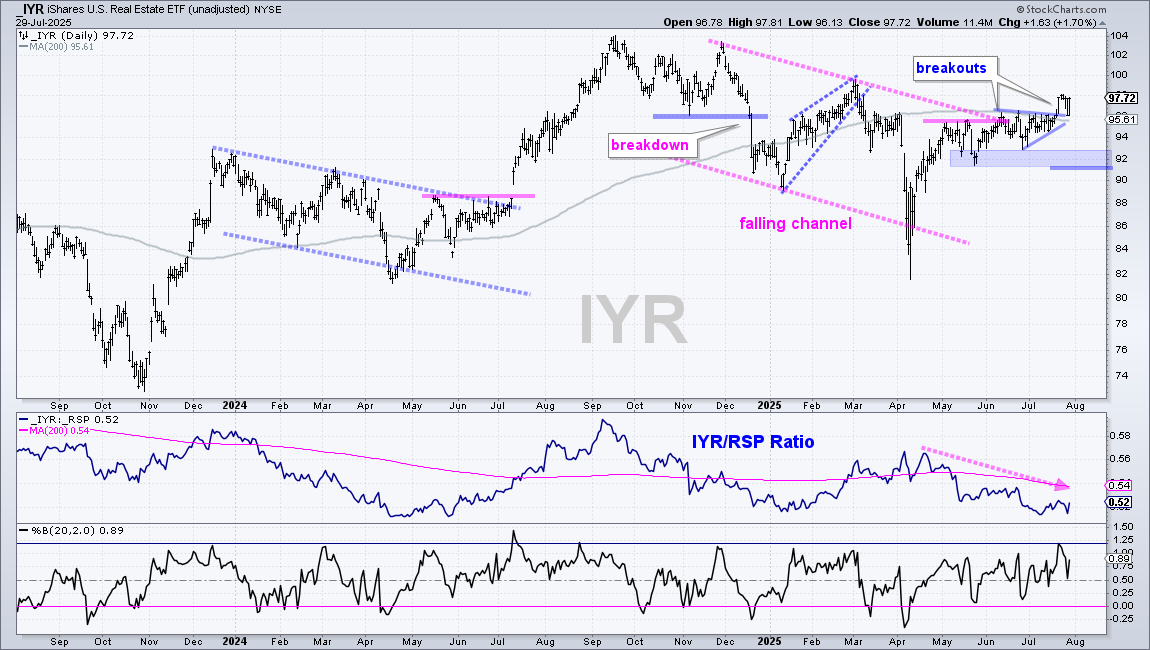
The REIT ETF (IYR) is also an ETF with an above average yield. For reference, here are the yields for four ETFs: SPY 1%, XLU 2.6%, IYR 2.5% , DVY 3.3%, and AMLP 7%. AMLP is the clear standout. The chart below shows IYR with a breakout in mid June as it exceeded the upper trendline of the falling channel and the May highs. IYR then consolidated with a triangle and broke out with a surge last week. This move also pushed the ETF above its 200-day SMA. Despite the recent breakouts, IYR remains a laggard because the price-relative (IYR/RSP Ratio) is well below its 200-day SMA.
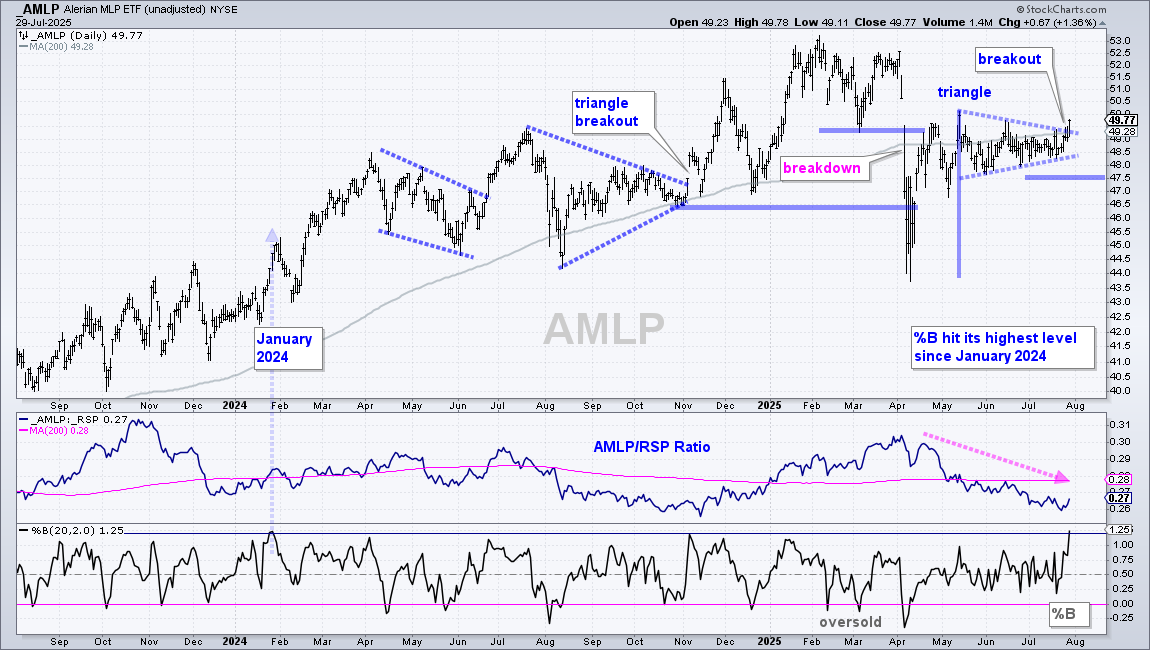
The next chart shows the MLP ETF (AMLP) breaking out of a triangle and reclaiming the rising 200-day SMA. AMLP surged from 44 to 50 in April-May, formed a triangle consolidation into July and broke out with a surge the last five days. The triangle is a short-term bullish continuation pattern and the breakout signals a continuation of the April-May advance. I am using the triangle lows to mark re-evaluation support at 47.50 (blue line).
IEF Holds Breakout - Plus Key Level for TLT
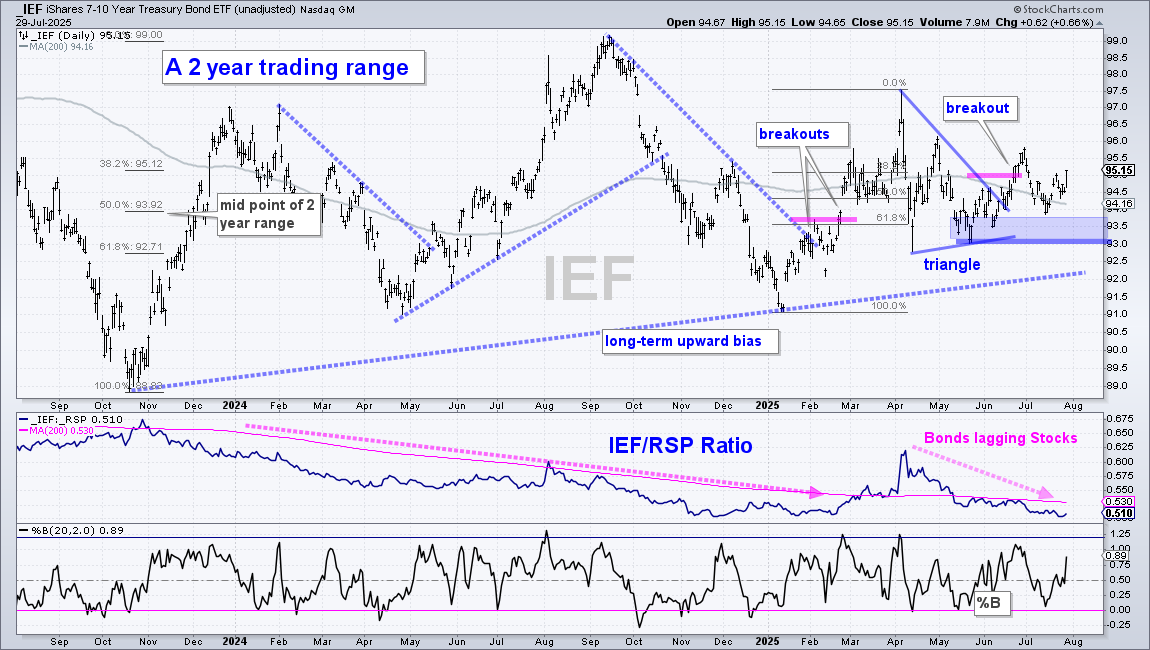
The 7-10Yr TBond ETF (IEF) is in a long-term uptrend and sports a short-term breakout in late June. First, I see a long-term upward bias with the higher lows since October 2023 and the higher high in September 2024. Admittedly, this is not the strongest uptrend because IEF is trading near the midpoint of its two year range. Short-term, the ETF surged in Q1, consolidated with a volatile triangle in Q2 and broke out at the end of June. This breakout is the active signal and argues for a continuation of the Q1 advance. I am marking re-evaluation support at 93.
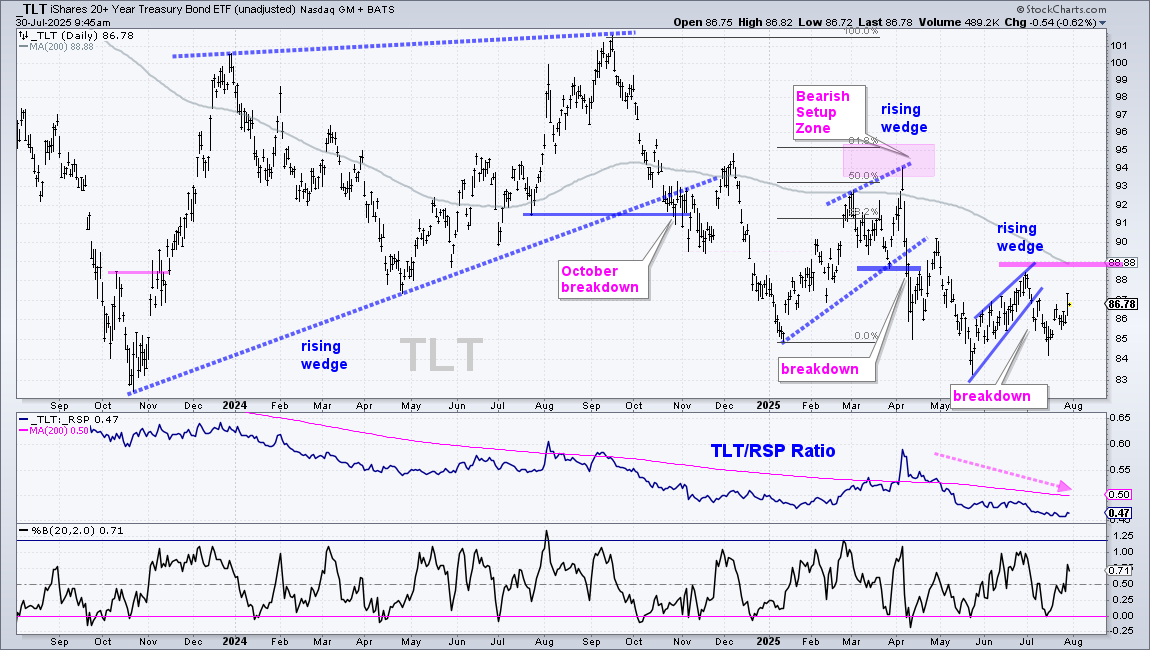
In contrast to IEF, the 20+Yr TBond ETF (TLT) is in a downtrend with wedge breaks in October, April and July. TLT also sports a series of lower lows and lower highs the last six months. The ETF got a bounce with the rest of the bond market over the last two weeks. I am marking resistance at 89 and a breakout here would be bullish. The falling 200-day and late June high mark resistance here.
TIP Extends on Breakout
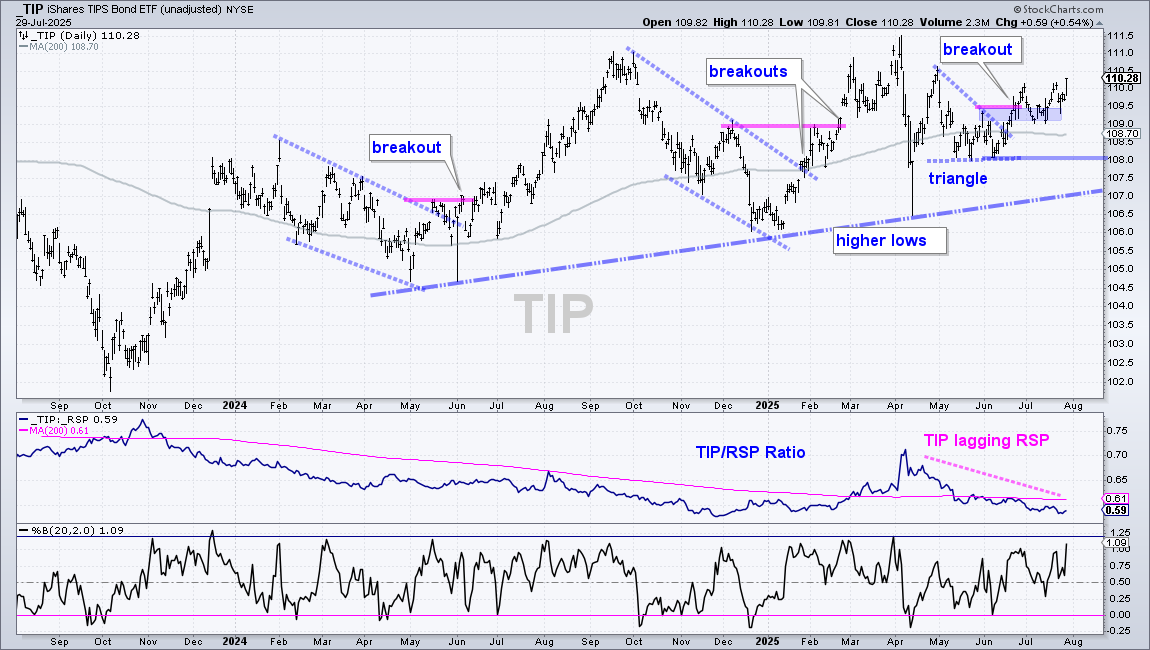
The 0-30Yr TIPS Bond ETF (TIP) is stronger than the 7-10Yr TBond ETF (IEF). This inflation-protected bond sports higher highs and higher lows since late 2023, and a strong uptrend. Most recently, TIP advanced in Q1, consolidated into Q2 and broke out in late June. This breakout is bullish with re-evaluation support set at 108.
GLD forms Bullish Pattern as GDX Breaks Out
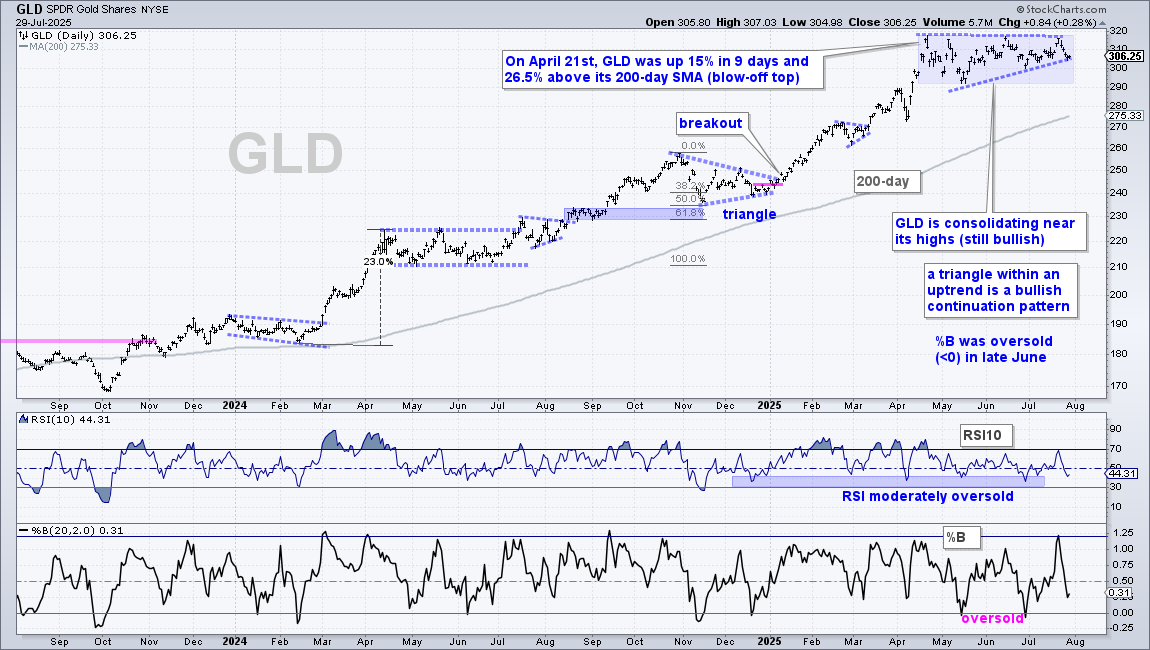
The Gold SPDR (GLD) remains in a leading uptrend and a leader in 2025 with a 26.5% year-to-date gain. After becoming overbought on April 21st, the ETF moved into a consolidation phase with a triangle taking shape since late April. Consolidations work off overbought conditions and pave the way for further gains. As such, this is a bullish continuation pattern and a breakout at 320 would signal a continuation higher. Note that GLD became oversold during this triangle as %B dipped below zero twice (mid May and late June). Oversold conditions present opportunities to partake in uptrends.
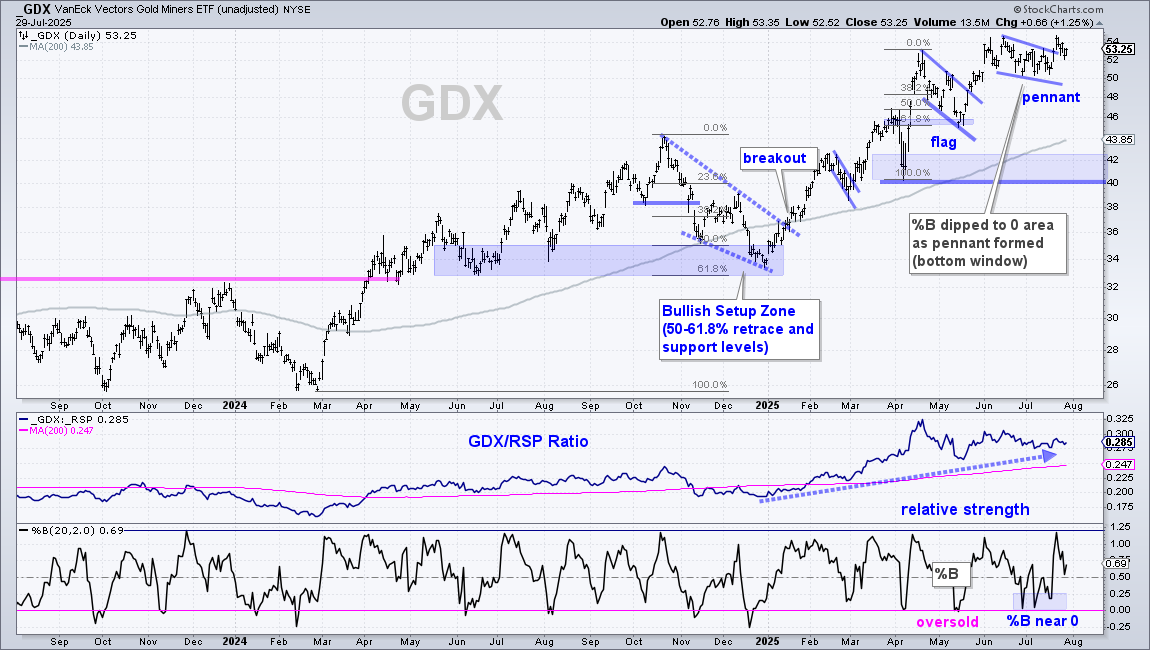
The Gold Miners ETF (GDX) is also in a leading uptrend with a new high this week and price well above the rising 200-day SMA. GDX is up 57% year-to-date, which earns first place in our core ETF list. The Silver Miners ETF (SIL) is second with a 55.3% year-to-date gain. Short-term, GDX surged to a new high in June, corrected with a pennant into July and broke the pennant line with a surge this week. This breakout signals a continuation of the long-term uptrend. Notice that %B dipped to the zero area as the pennant formed. This means the close was near the lower Bollinger Band (20,2) and GDX was moderately oversold (short-term).
IBIT Turns Quiet with Tight Range
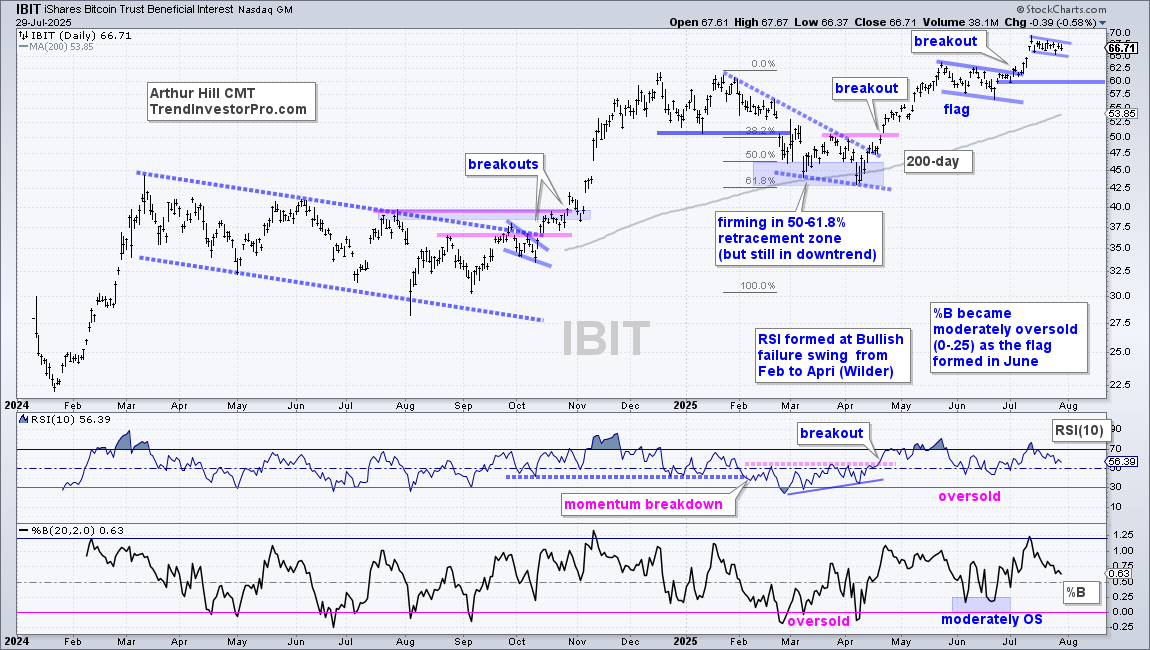
The Bitcoin ETF (IBIT) remains in a leading uptrend with a new high in mid July and price well above the rising 200-day SMA. Short-term, the ETF hit a new high in May, corrected with a falling flag and broke the flag line in early July. This flag was featured in reports on June 26th and July 3rd. IBIT consolidated around the flag breakout zone so I am marking re-evaluation support at 60.
After a sharp move from 60 to 70 in mid July, the consolidated with a high and tight flag, which is also a short-term bullish continuation pattern. A breakout would signal a continuation higher. Personally, this pattern is too small (tight) and the risk of whipsaw is above average. IBIT could break out and then move below the flag lows with normal volatility. The better setup would be to wait for a short-term oversold condition (%B near zero).
Healthcare SPDR is Long-term Oversold
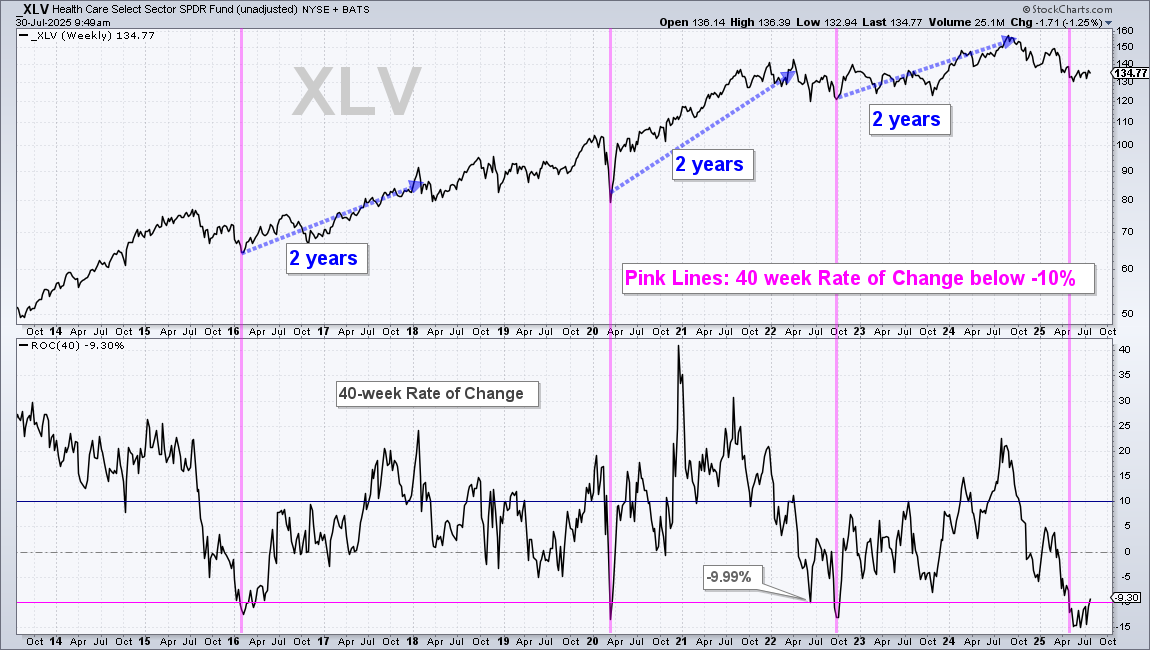
The next chart shows weekly bars for the Healthcare SPDR (XLV) and the 40-week Rate-of-Change indicator dipping below -10% in May. This is a long-term oversold condition that could lead to a bounce, but not necessarily right away. The pink vertical lines show prior dips below -10% and the ETF was 20+ percent higher two years later. Note that this strategy worked pretty well over the last 25 years. The 2008-2009 bear market is the big exception because XLV fell another 30% into March 2009.
There is one big different between equity ETFs and individual equities. Individual stocks can go to zero, but equity-based ETFs cannot go to zero. As with the S&P 500 SPDR (SPY), sector SPDRs will eventually bounce back. It is a question of when, not if.
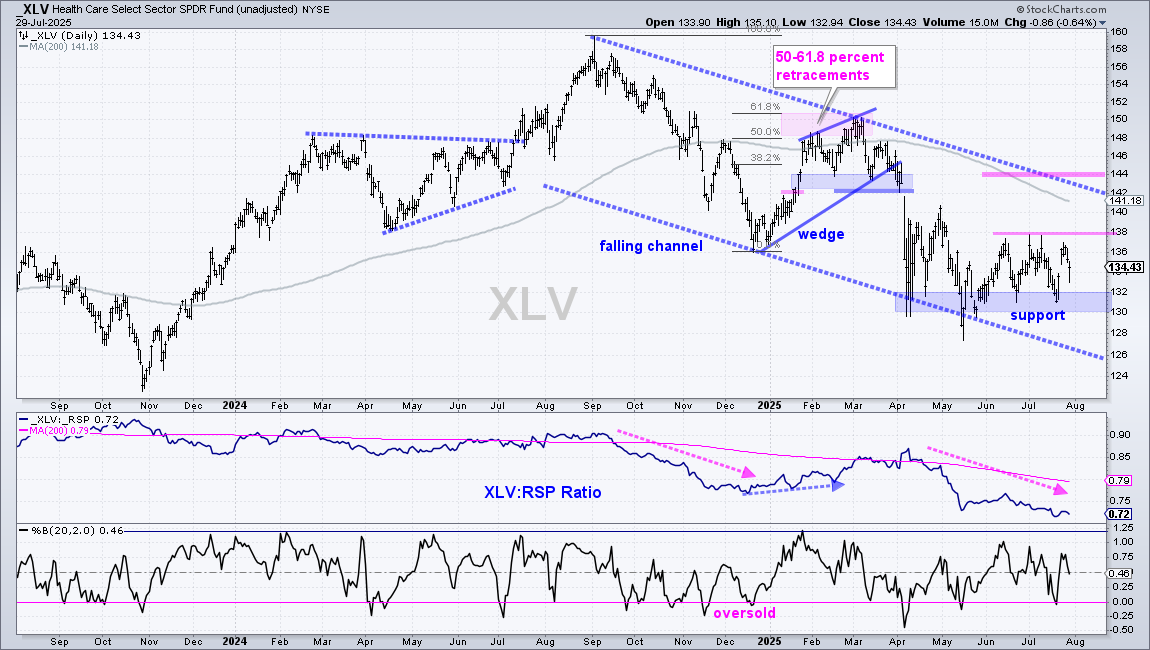
The next chart shows daily bars for XLV. There is a clear downtrend since September and 52-week lows in April. Despite this downtrend, XLV is managing to firm in the low 130s the last few months. First resistance is set at 138 and a breakout here would be short-term bullish. Longer term, I am marking resistance at 144. A breakout here would take out the 200-day SMA and push prices out of the falling channel.
Send feedback to support(at)trendinvestorpro.com or use the contact form.