Stocks remain strong with tech and AI plays leading the way higher. QQQ and XLK recorded fresh new highs on Monday. SPY, QQQ and several tech-related ETFs look extended, but they continue to extend as buying pressure outpaces selling pressure. We are in the middle of earnings season with some big tech names reporting on Wednesday and Thursday. The Fed starts its two-day meeting with a policy statement on Wednesday afternoon. This combination may lead to above average volatility Tuesday-Wednesday. As such, I will let the dust settle and cover the equity ETFs on Thursday. In the meantime, here is a PDF file with the annotated charts in my ChartList.
Today’s report will take a step back and analyze the historic surge off the April low. History suggests that this powerful move is long-term bullish. We will then look at the V reversal off the March 2020 low and see what worked as the bull market extended. In particular, we will show the short-term bullish patterns and oversold conditions that offered opportunities.
SPY and QQQ Stretch to New Highs
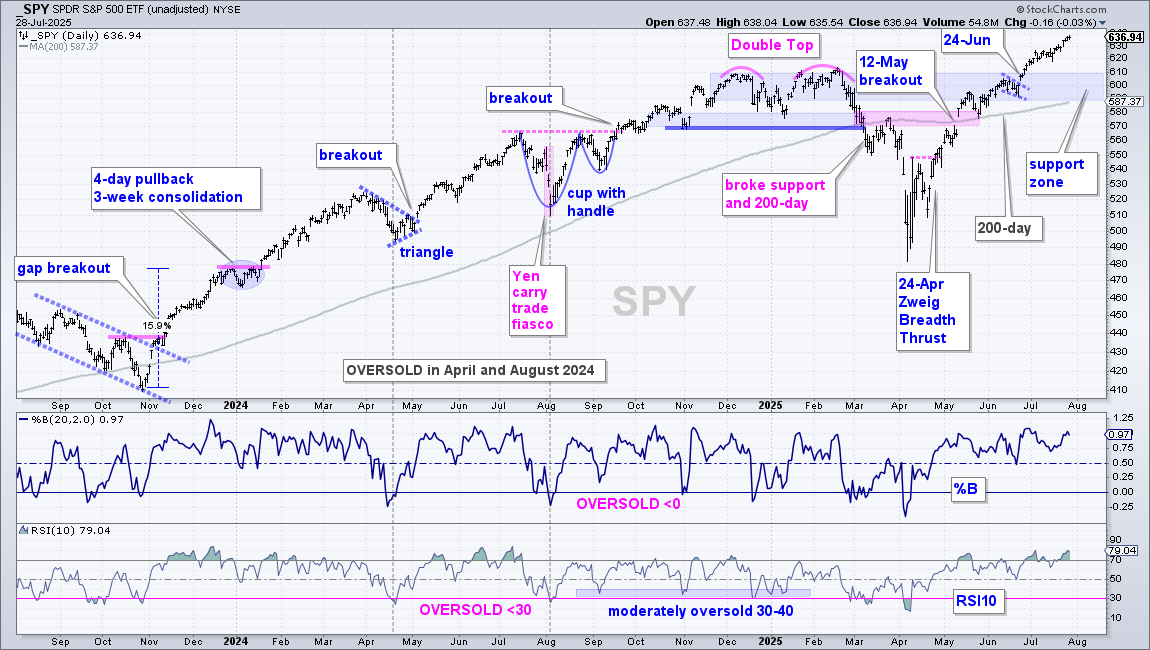
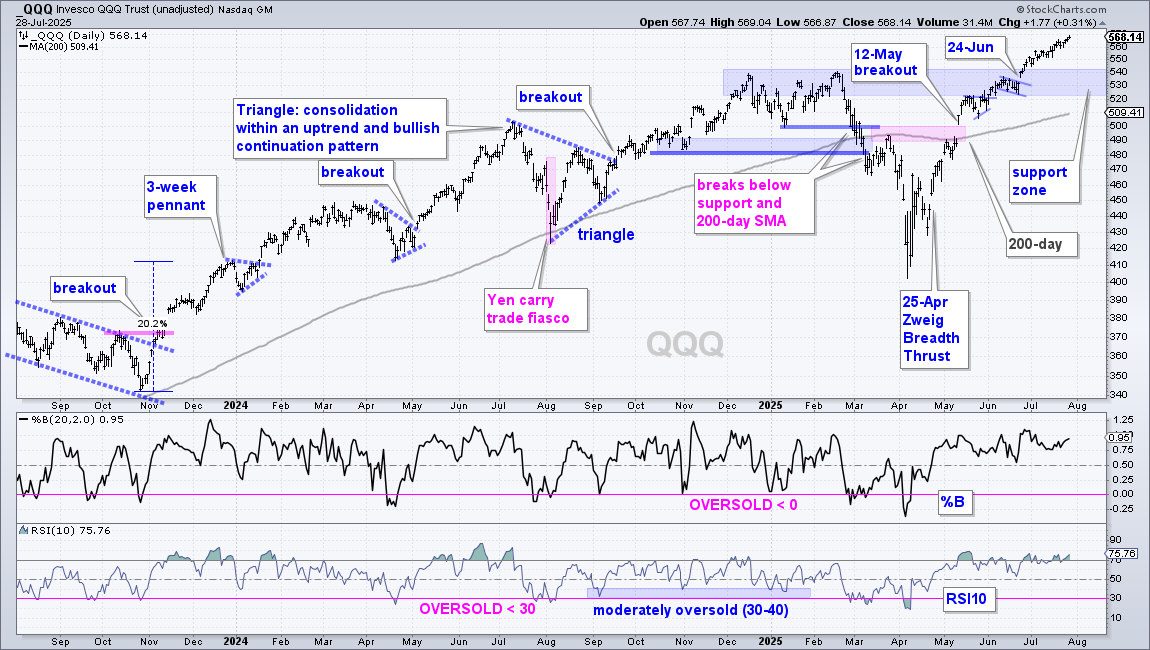
SPY and QQQ continue to lead the major index ETFs with new highs. SPY hit a new closing high on Friday and is up 28.2% since April. QQQ recorded a new high on Monday and is up 36.55% since April (75 trading days). We do not need a momentum oscillator to suggest overbought conditions.
The chart below shows SPY with the Zweig Breadth Thrust on April 24th, the trend-reversing breakout on May 12th and new highs beginning in late June. SPY is above its rising 200-day SMA and in a strong uptrend. It is difficult, if not impossible, to time a pullback in a strong uptrend. Should we get one, I would mark the first support zone in the 600 area (blue shading). Here we have broken resistance turning into support and the rising 200-day SMA.
The next chart shows QQQ with the support zone in the 520-540 area. This zone stems from broken resistance (Dec-Feb highs) and the June low. This zone is above the 200-day SMA, but this SMA is rising and could reach the 520 area in a few weeks.
An (almost) Unprecedented Advance
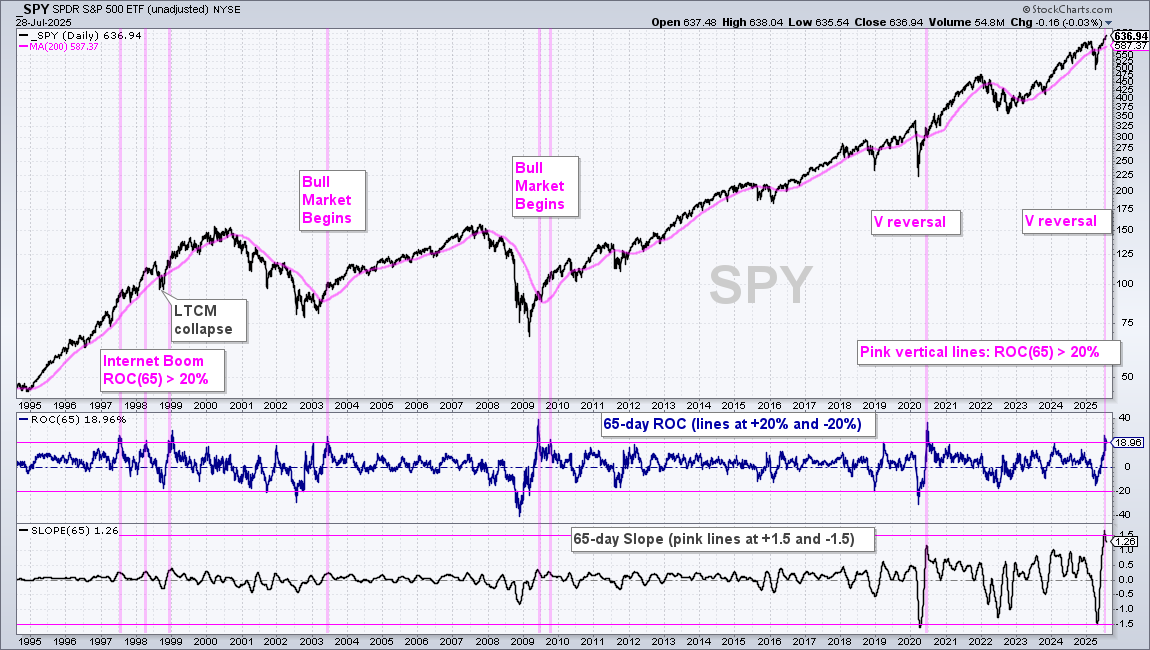
The 65-day Rate-of-Change exceeded +20% for the eighth time in 30 years (vertical pink lines). Such moves are usually long-term bullish and mark the start of a bull run. The chart below shows SPY with ROC(65) and Slope(65) in the indicator windows. 65 days covers around three months (a quarter). 65-day ROC exceeded 20% three times from 1995 to 1999 (internet boom). The 20+ percent surge in 1998 occurred after a sharp decline triggered by the LTCM collapse.
The next three surges marked the beginning of bull markets in June 2003 and June-October 2009. June 2020 marked a V reversal off the March 2020 low and the rally extended until December 2021. Most recently, stocks plunged into April and sharply recovered with another V reversal. ROC(65) exceeded 20 percent in July. This move is like a rocket lifting off and suggests that the bull market has escape velocity.
Unprecedented Steepness
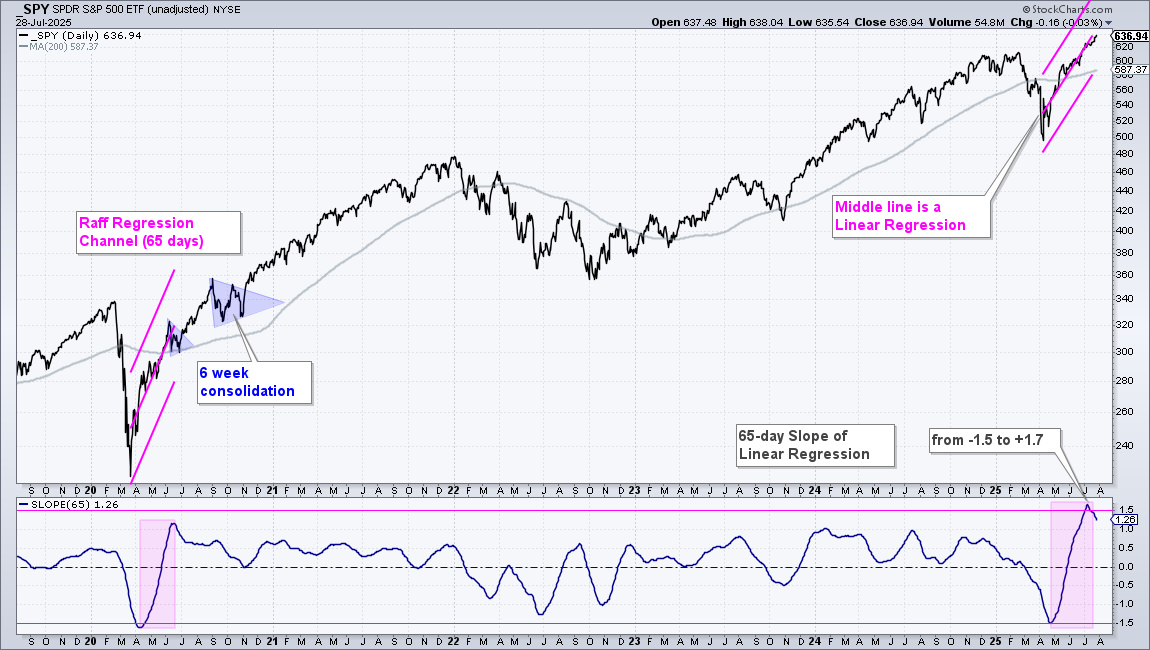
The next chart shows SPY since 2020 and Slope(65) in the indicator window. This indicator captures the steepness of the move by measuring the slope of a 65-day Linear Regression (rise over run). On the price chart, the pink lines show Raff Regression Channels and the middle lines are linear regressions. Most recently, Slope(65) moved from -1.5 to +1.7, which is the biggest reversal in over 30 years. The April dip to -1.5 was not as deep as in March 2020, but the surge off the low is steeper. In fact, 1.7 is the steepest 65-day Slope in 30 years. This is also testament to the power behind the move.
Tradable Setups after the 2020 Low
The power behind the move off the April low suggests that a bull market is underway for S&P 500 and Nasdaq 100 stocks. Chartists should not be on the lookout for short-term bullish continuation patterns and oversold conditions.
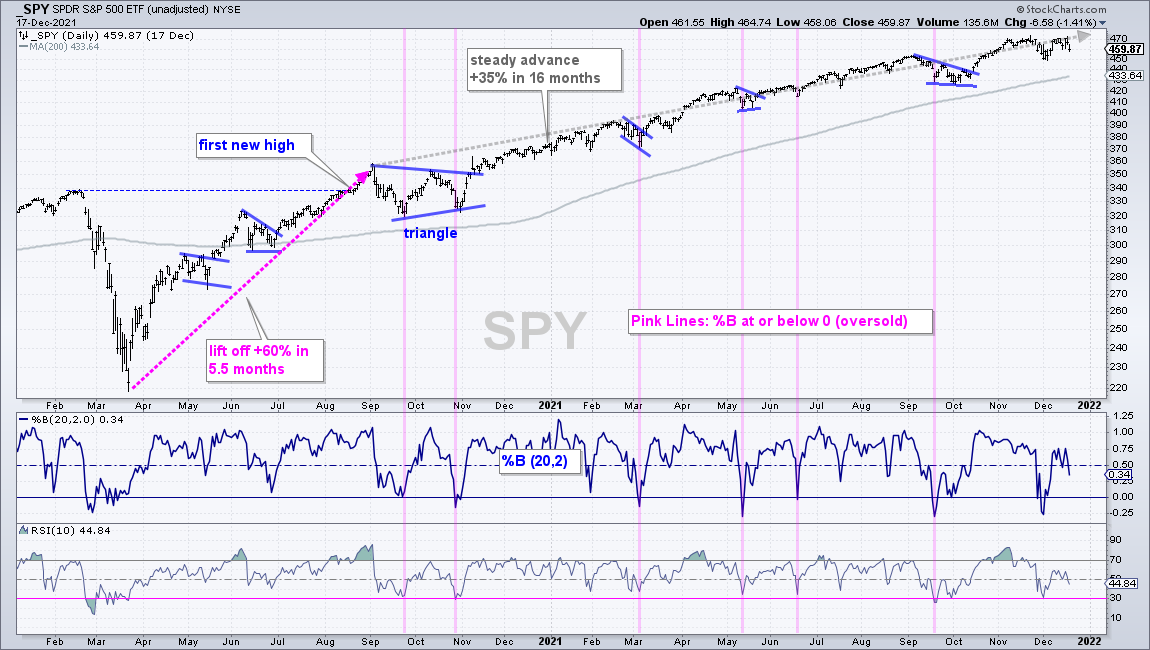
These will offer opportunities to partake in the current uptrend. The next chart analyzes the surge off the March 2020 low and subsequent bull run. First, note that SPY gained 60% in 5.5 months (pink arrow-line) and then another 35% over the ensuing 16 months (gray arrow-line). Most of the gains occurred during the initial surge. There were two small bullish continuation patterns during the initial surge (flag and pennant). The first “decent” correction was in September-October as a triangle formed. There were then three small bullish continuation patterns in 2021.
The vertical pink lines show when %B (20,2) dipped to zero or lower for an oversold condition within uptrend. %B below zero means the close was below the lower Bollinger Band (20,2). In an uptrend this means price is short-term oversold and traders should be on alert for a bounce.
Send feedback to support(at)trendinvestorpro.com or use the contact form.