Systematic Strategies and Next Level Technical Analysis
Manipulation and Volatility – Downtrend and Bear Market – Volume Spikes – Bitcoin
Arthur Hill, CMT
Archive
Charts
Use CRTL+P to Print
The next report/video will be on Wednesday, April 23rd.
Short-term, the stock market is like the silver ball in a pinball machine: bouncing all over the place as the news flippers push it around. As Dow Theory asserts, short-term price fluctuations are random and subject to manipulation. Long-term trends, in contrast, are not random and not subject to manipulation. Long-term, the trend and the weight of the evidence are clear. SPY and QQQ are in downtrends and the breadth indicators are bearish (see the Market Regime report). The short-term is anyone’s guess, but the long-term picture is quite clear. We are currently in a bear market and I have yet to see evidence to the contrary.
Report Headlines
Lots of 2% Swings
SPY in Long-term Downtrend
SPY and QQQ Fail at First Resistance
S&P 1500 Thrust Indicator Update
Volatile and Short-term Oversold
Volume Spikes in Last 10 Minutes
Bitcoin Goes for a Breakout
Rise of the 2% Swings
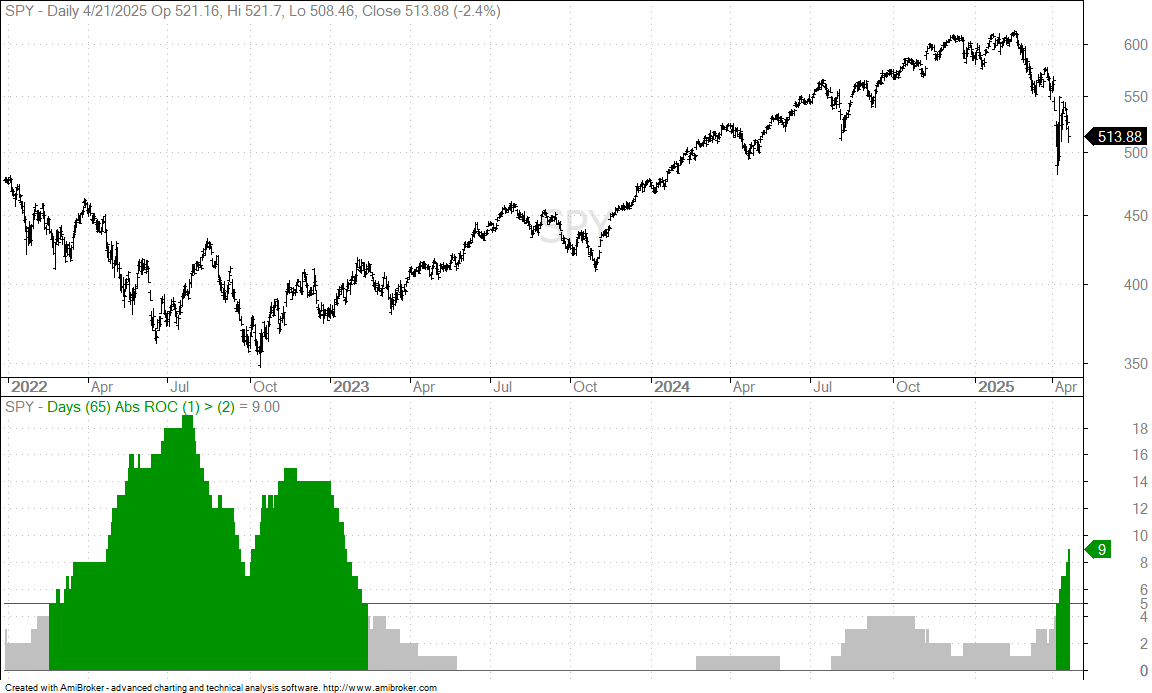
The chart below shows SPY with the number of 2% moves within a 65 day window (indicator window). Currently, there were 9 moves of 2% or greater in the last 65 days (up or down). A 2% move is relatively large for SPY and shows above average volatility, which is negative. Notice how this number exceeded 5 in January 2022 and remained above 5 until February 2024 (green). Volatility like this is more likely in bear markets. In contrast, notice how this number stayed below 5 from mid February 2023 until April 2025. Bottom line: things need to settle down.
SPY in Long-term Downtrend
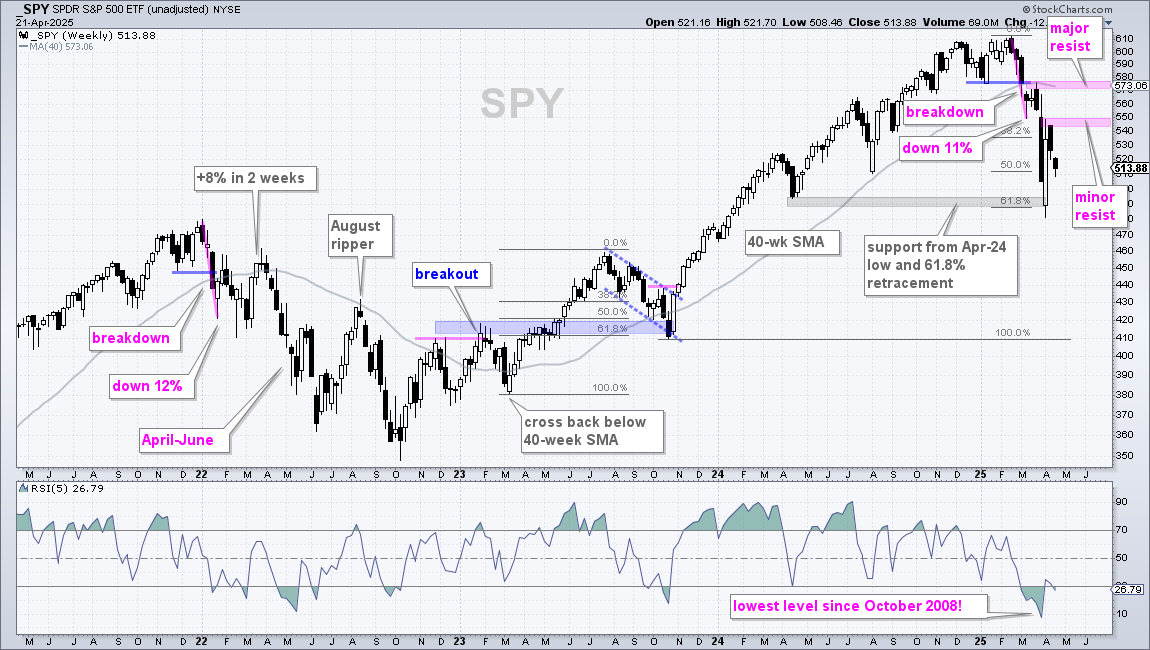
There are two resistance levels in play on the weekly SPY chart. First, we have resistance at 550 from the April highs. I view this as a minor resistance level because a breakout at 550 could still be within the confines of a larger downtrend. The second resistance level is at 580. Here we have broken support, the mid March high and the 40-week SMA, which is turning down. A breakout at 580 would negate the March breakdown and recapture the 40-week SMA. This would be long-term bullish.
SPY and QQQ Fail at First Resistance
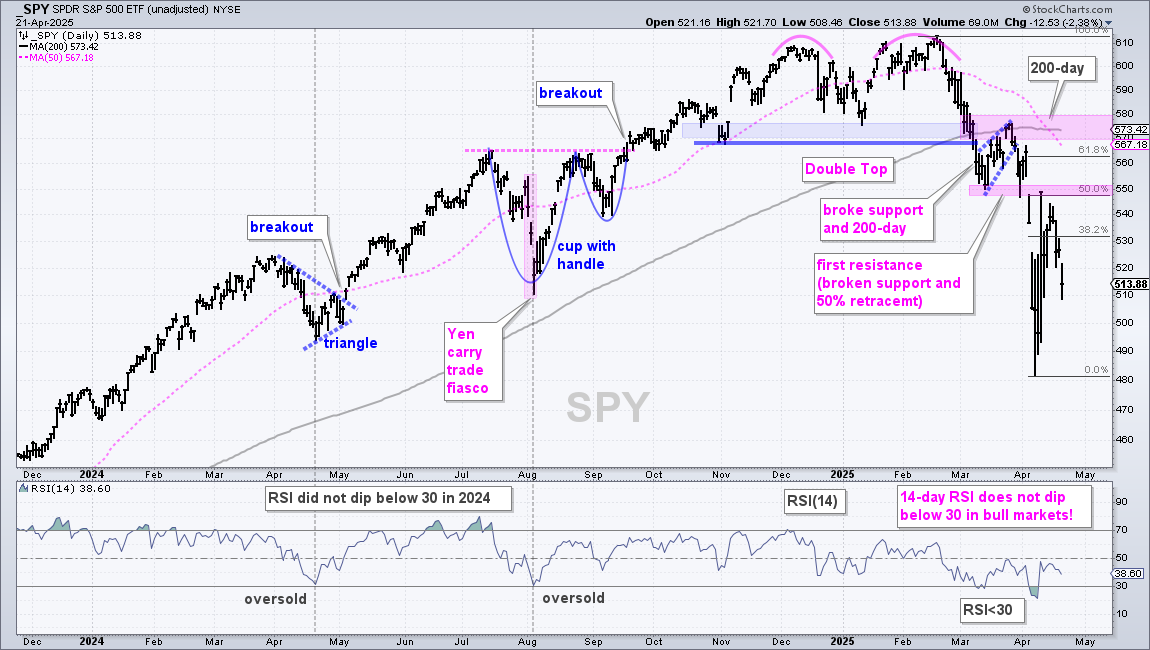
The next chart shows daily bars with a Double Top breakdown in March, plunge to 490 in early April and rebound to 550 on April 9th. This area also marks a 50% retracement of the entire decline. I showed this resistance zone last week Tuesday, and it remains the first challenge for the bulls. As noted above, I would not view a breakout here as bullish, unless it was accompanied by a bullish breadth thrust. Instead, I would view the 550-580 zone as a major resistance hurdle.
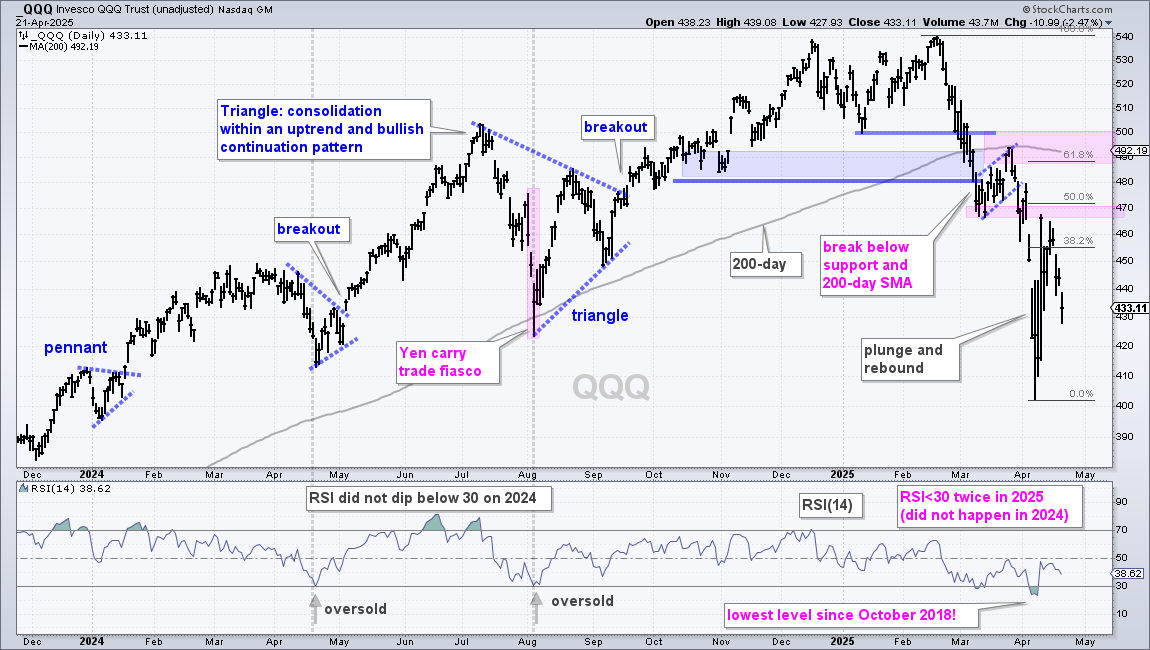
The next chart shows daily bars for QQQ and similar characteristics. There was a clear breakdown in March, an extreme oversold condition in early April, an oversold bounce to first resistance (pink shading) and a sharp decline the last four days. This resistance area also marks a 50% retracement of the entire decline. The 50% retracement represents one step up after two steps down, which is typical for a counter-trend move. As with SPY, a breakout at 470 would not be a major bullish signal because it would not undo the March breakdown. Instead, I see a major resistance zone in the 470-500 area. A break above 500 would negate the March breakdown and recapture the 200-day SMA. This would be something to talk about.
S&P 1500 Thrust Indicator Update
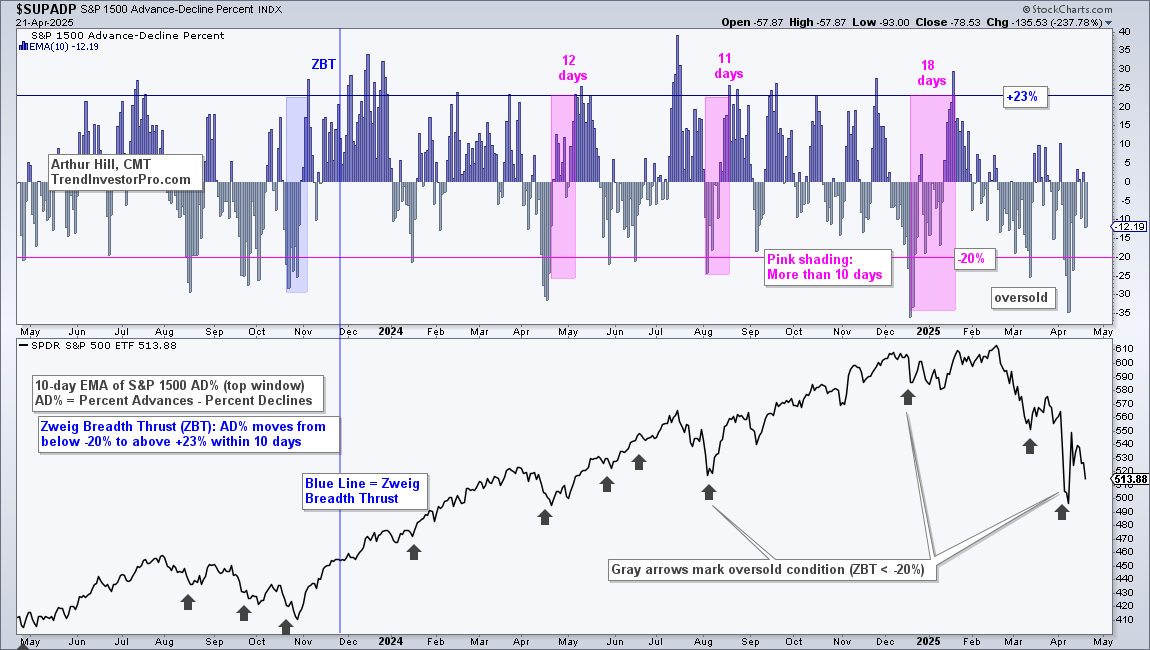
The S&P 500 and S&P 1500 Zweig Breadth Thrust indicators set up on April 8th and April 10th, respectively. This means they were below -20%. See this report and video for details on the Zweig Breadth Thrust. According to Zweig, we need to see a move above +23% within 10 days to trigger a Zweig Breadth Thrust. The S&P 500 has two days left and the S&P 1500 has four days left.
The chart below shows the 10-day SMA of S&P 1500 Advance-Decline Percent ($SUPADP) in the top window and SPY in the lower window with gray arrows marking dips below -20%. This is an oversold condition that can give way to a bounce, as occurred on April 9th. Follow through is the difference between an oversold bounce and a bullish breadth thrust. We have yet to see strong follow through.
Stocks moved back to short-term oversold conditions with a sharp decline the last four days. SPY fell 4.68%, QQQ lost 5.33% and IWM declined 2%. IWM showed less weakness during this four day drop, but keep in mind that it peaked in late November and led the way lower with a 25% decline from its high. I would not read too much into relative strength in IWM (small-caps).
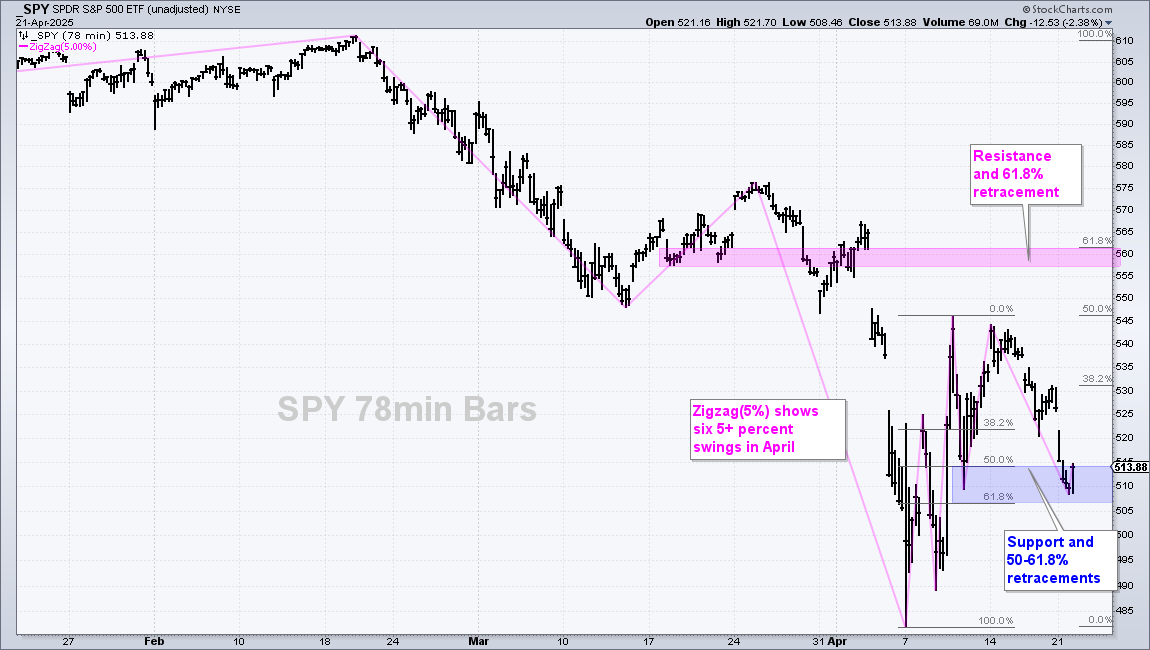
Short-term, I can make the argument for an oversold bounce from current levels. The chart below shows 78 minute bars over the last three months and the Zigzag (5%) indicator (pink line). There are 390 minutes in a trading day and five 78 minute bars per day. Before looking at the setup, note that SPY experienced six 5+ percent swings in April, and we still have a week to go. This means volatility is HIGH and trading is only for the nimble.
SPY is short-term oversold after a 6% decline from ~545 to ~510. The ETF is also trading in a short-term Bullish Setup Zone marked by the 50-61.8% retracements and support from the April 10th low (blue shading). Oversold conditions and a potential reverse zone could give way to a bounce. As far as a target, the pink shading marks the 560 area (broken support and the 61.8% retracement).
What is wrong with this setup? The bigger trend is DOWN, which means the setup is for a counter-trend move. This setup does not have a tailwind (long-term uptrend or bull market). In a long-term downtrend or bear market, the ideal setup is after a bounce (sell into strength) and when price is near a Bearish Setup Zone (broken support and key retracements). A bounce to the 550-560 area would provide a better setup within a downtrend.
Volume Spikes in Last 10 Minutes
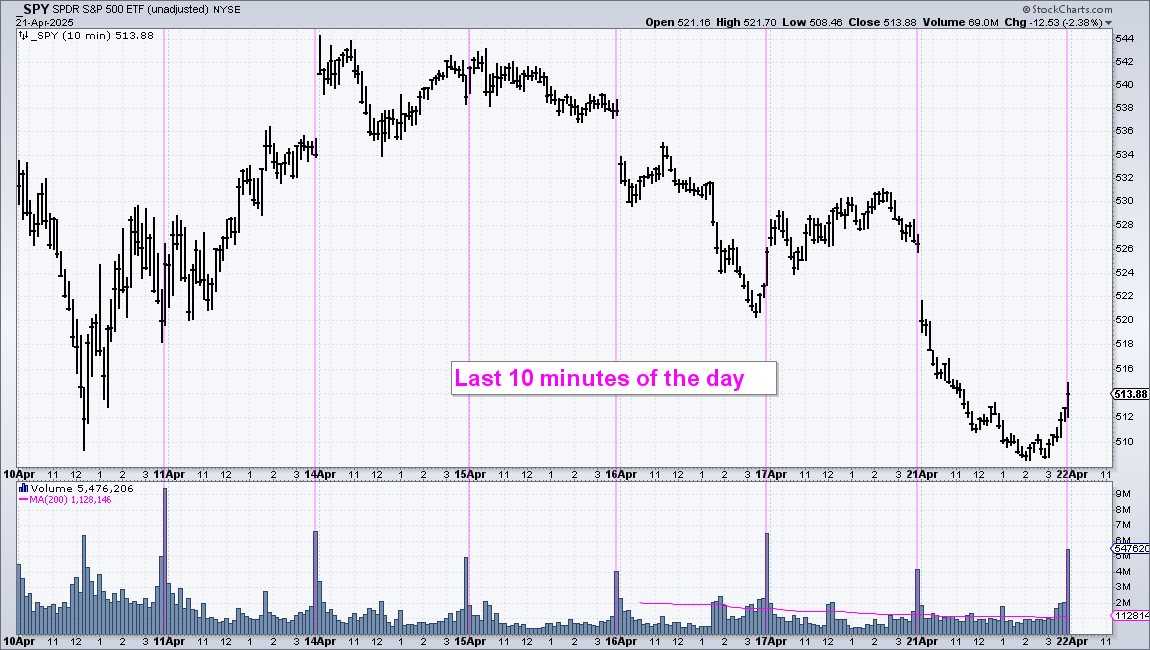
Bloomberg reports that the last 10 minutes of the trading day accounts for a third of trading volume in S&P 500 stocks. Passive investing is the driver because these funds typically place their orders at the end of the day. SPY is not a stock, but we can still see the volume spike in the last 10 minutes. The chart below shows SPY with the pink vertical lines marking the last 10 minute bar. This is another reason why I do not use volume in my analysis.
Bitcoin Goes for a Breakout
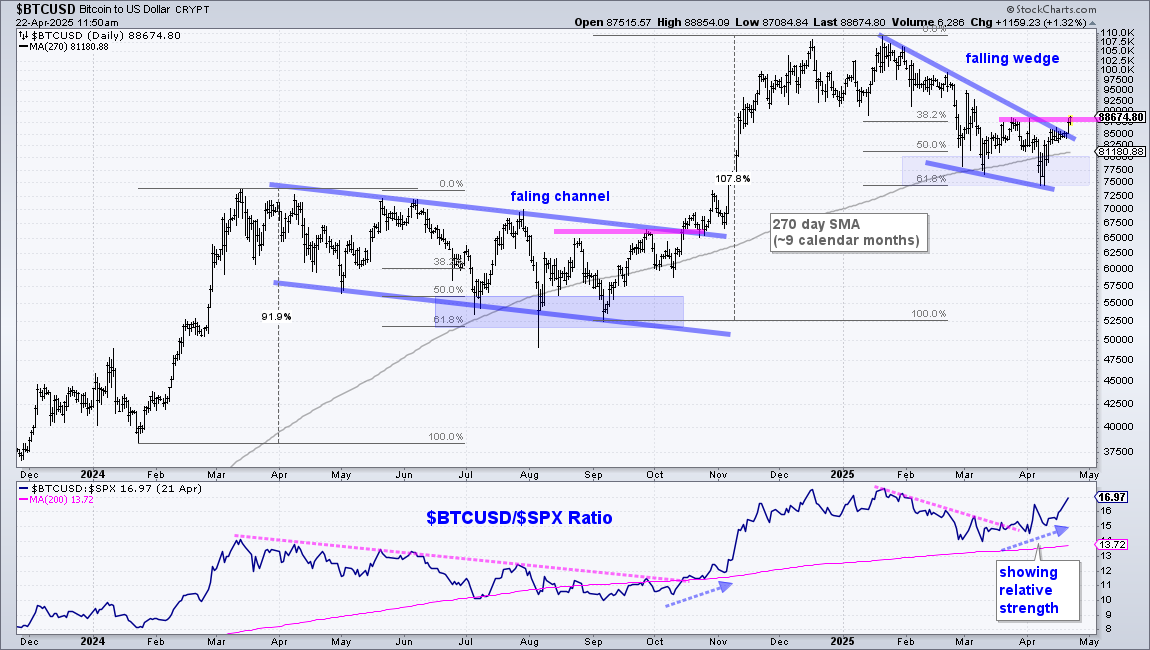
I featured the Bitcoin ETF (IBIT) last Thursday as it set up and Bitcoin ($BTCUSD) on Monday as it broke the wedge line. The first chart shows $BTCUSD with a falling wedge that retraced around 61.8% of the prior advance (107.8%) and found support in the 75000-80000 area. Bitcoin broke above the wedge line on Monday and edged higher in early trading on Tuesday. I view this wedge as a big correction after an even bigger advance. A breakout would signal a continuation higher. A close below the 270-day SMA would call for a re-evaluation.
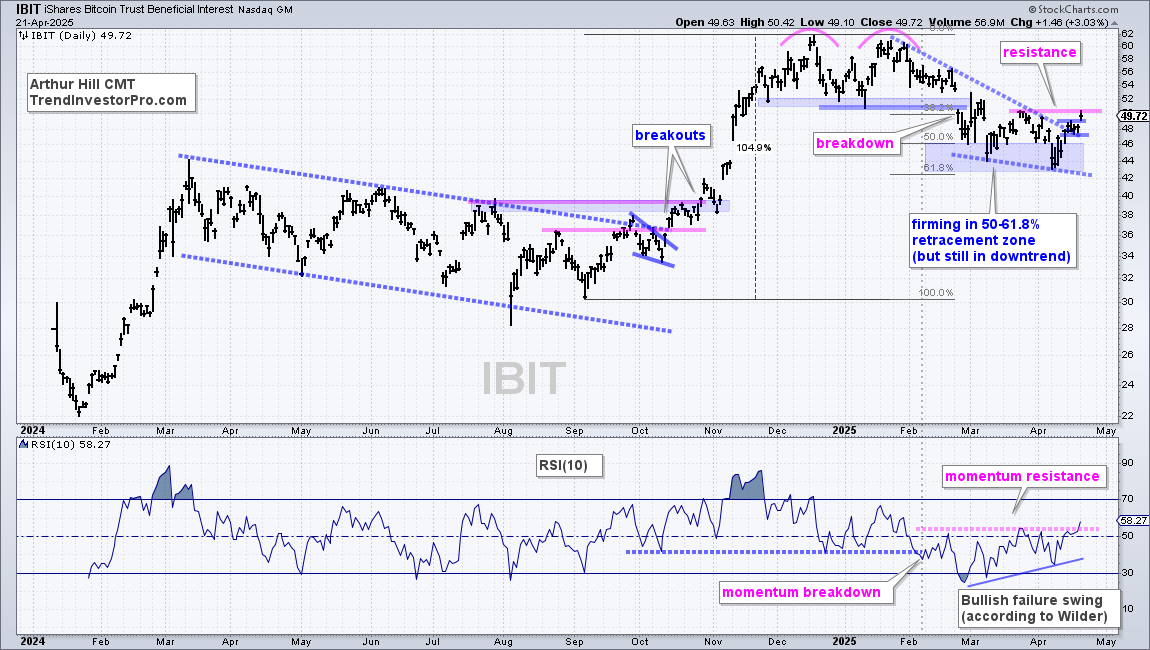
The next chart shows IBIT breaking the wedge line last week and breaking out of a small flag this week. A break above the late March high would forge a higher high and fully reverse the 2025 downtrend. The indicator window shows RSI(10) with a bullish failure swing from February to April and a break above the March high. This shows the strongest momentum since January.
Send feedback to support(at)trendinvestorpro.com or use the contact form.