

New Leaders Emerge – Old Leaders Correct – Charting Corrections in Tech ETFs

Headlines

  • Technology and Consumer Discretionary Diverge
  • New Leaders Emerge as Old Leaders Correct
  • Tech-Related ETFs Correcting
  • Mag7 ETF Holds Rising Channel
  • SMH Stalls as SOXX Battles Flag Breakout
  • ARTY, CIBR and IGV Correct with Falling Wedges
  • BLOK Consolidates above Breakout Zone

The next report/video will be on Wednesday morning (27-Aug)

Correction and Rotation Underway

There is a short-term rotation underway in the stock market. Small and mid caps are starting to outperform large-caps and large-techs. Consumer Discretionary and Finance are starting to outperform Technology and Industrials. Keep in mind that these rotations started in late August, which means they are still short-term.

Tech-related ETFs are still outperforming long-term and remain in long-term uptrends. However, many are in correction mode as they digest the big gains from April to July. We do not know how long these corrections will last or how far they will extend. Today’s report will analyze the current rotation and the corrections in several tech ETFs. The correction is likely to extend should MAGS, XLK and SMH break their August lows.

Technology and Consumer Discretionary Diverge

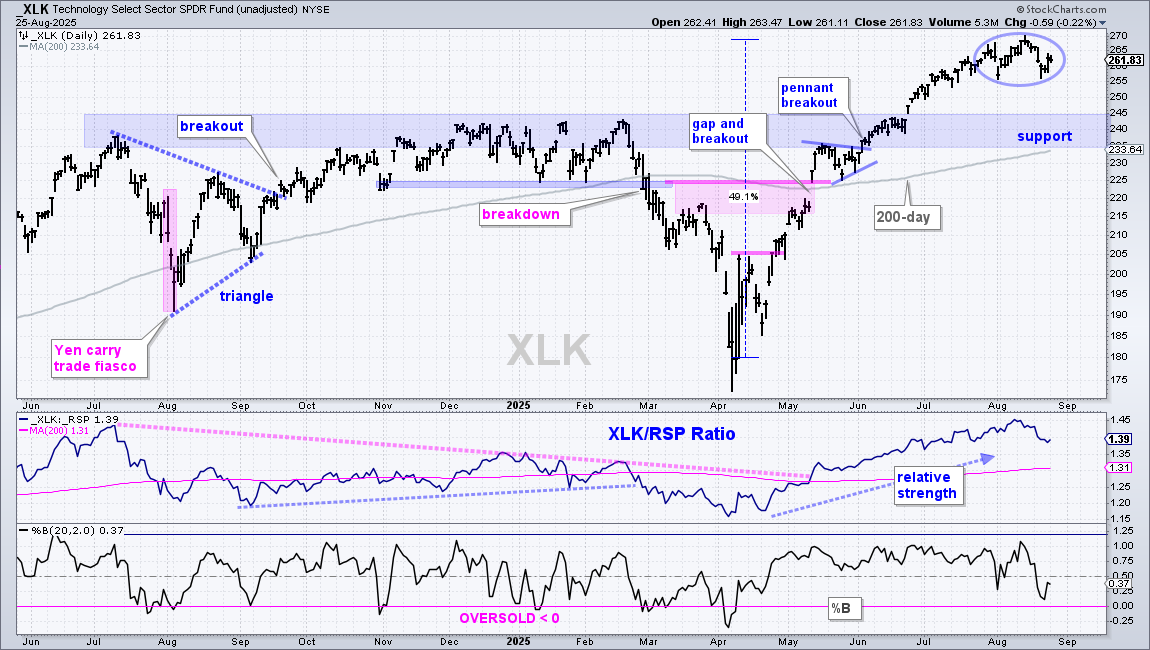
The current rotation is visible when comparing recent performance for Technology (XLK) and Consumer Discretionary (XLY). XLK is largely flat the last four weeks, but XLY powered higher throughout August. The chart below shows XLK with sideways price action the last four weeks (blue oval). This is corrective price action because it is a consolidation within a long-term uptrend. Corrections are healthy because they digest prior gains and pave the way for the next move higher. Support is marked in the 235-245 area (blue shading).

Short-term, XLK is showing relative weakness because the price-relative fell in August (middle window). Long-term, however, XLK remains a leader because the price-relative is well above the rising 200-day SMA. The pullback in the price-relative is a correction in relative performance. The bottom window shows %B dipping below .25 to become moderately oversold last week. A move below zero would show a true oversold condition.

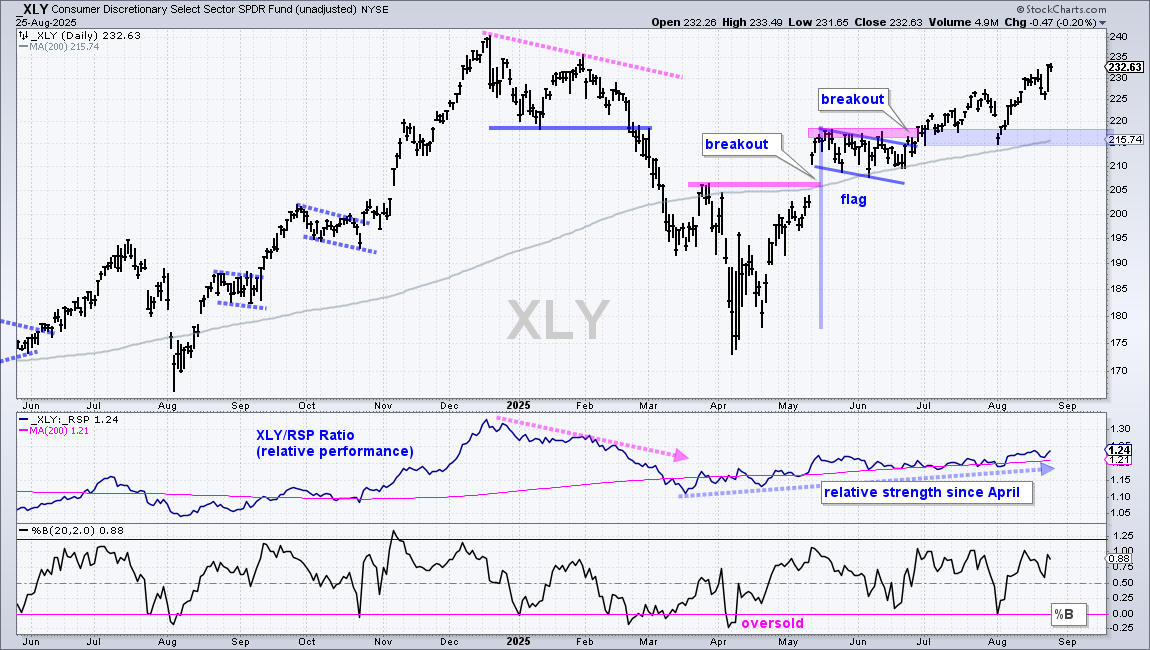
The next chart shows Consumer Discretionary (XLY) in a long-term uptrend since the mid May gap and breakout. XLY tested its rising 200-day SMA in early August and then zoomed to new highs with a surge into late August. XLY hit a new high for the move (since April), but XLK did not. XLY is leading XLK in this regard and new leadership is emerging.

The middle window shows the price-relative (XLY/RSP ratio) turning up in April and working its way higher the last five months. XLY is outperforming the broader market. The bottom window shows %B tagging zero to become oversold on August 1st as XLY tagged the 200-day SMA. Keep this trading setup in mind: pullback to support and %B oversold at zero.

New Leaders Emerge as Old Leaders Correct

The XLK and XLY charts above reflect the rotation underway within the stock market. ETFs related to tech and industrials are correcting. ETFs related to small-caps, mid-caps, Consumer Discretionary and Finance are extending higher and taking the lead.

We can quantify this rotation using the 96 day high, which captures the current move off the April low. I ran a scan to see which ETFs recorded 96 day highs within the last five days. These ETFs are the current leaders because they forged a 96 day high last week.

  • S&P 500 SPDR (SPY)
  • S&P 500 EW ETF (RSP)
  • S&P MidCap 400 ETF (IJH)
  • S&P SmallCap 600 SPDR (IJR)
  • Consumer Discretionary SPDR (XLY)
  • Finance SPDR (XLF)
  • Consumer Staples SPDR (XLP)
  • Home Construction ETF (ITB)
  • Homebuilders ETF (XHB)
  • Retail SPDR (XRT)
  • Bank SPDR (KBE)
  • Regional Bank ETF (KRE)
  • KBW Bank ETF (KBWB)
  • Airline ETF (JETS)
  • Solar Energy ETF (TAN)
  • Biotech ETF (IBB)
  • Biotech SPDR (XBI)
  • Infrastructure ETF (IFRA)
  • Telecom ETF (IYZ)

We can also see which ETFs are lagging short-term because they are missing from this list. Keep in mind that these ETFs are still in long-term uptrends and still leading long-term. They are just not keeping up with the ones that recorded higher highs last week. These include:

  • Nasdaq 100 ETF (QQQ)
  • Technology SPDR (XLK)
  • Communication Services SPDR (XLC)
  • Industrials SPDR (XLI)
  • Utilities SPDR (XLU)
  • EW Technology ETF (RSPT)
  • Mag7 ETF (MAGS)
  • Global AI & Tech ETF (AIQ)
  • Robotics AI ETF (ARTY)
  • Cloud Computing ETF (SKYY)
  • ARK Innovation ETF (ARKK)
  • ARK Fintech Innovation ETF (ARKF)
  • Semiconductor ETF (SMH)
  • Semiconductor ETF (SOXX)
  • Software ETF (IGV)
  • Aerospace & Defense ETF (ITA)

Tech-Related ETFs Correcting

The next charts cover the current corrections in the tech-related ETFs. Most recorded new highs in July and August with leading advancing. They also became seriously overextended after massive gains. This made them ripe for corrections and many are currently correcting with trading ranges or pullbacks. The corrections are at work in progress until there is a breakout or upside catalyst that signals a reversal. This means the corrections could extend.

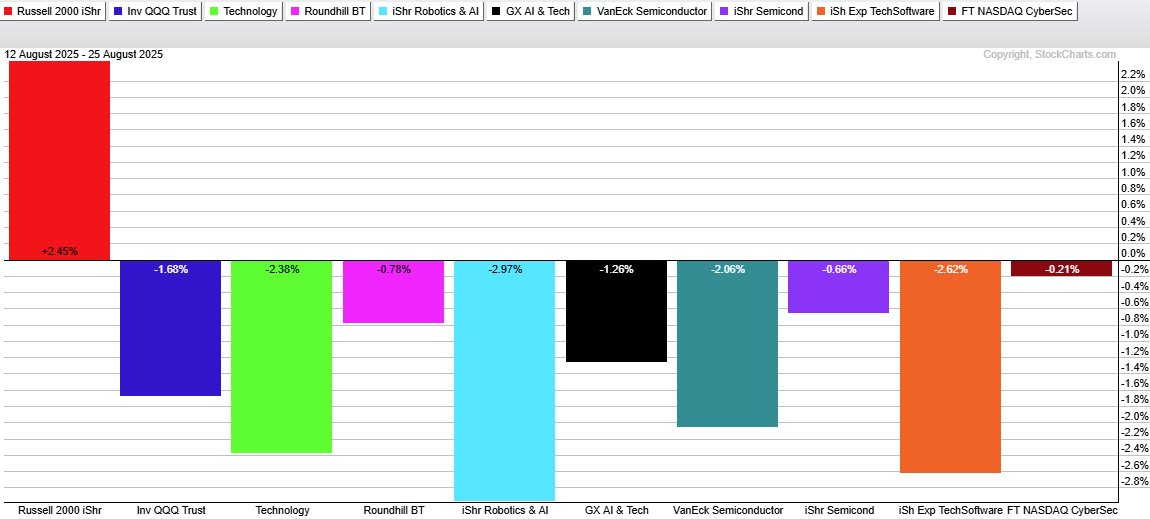
The PerfChart below shows IWM with a 2.5% gain the last nine days (far left). The nine techs ETFs are down over this period. XLK (green) is down 2.38% and ARTY (light blue) is down 2.97%. CIBR is holding up the best with the smallest loss (far right). 

Mag7 ETF Holds Rising Channel

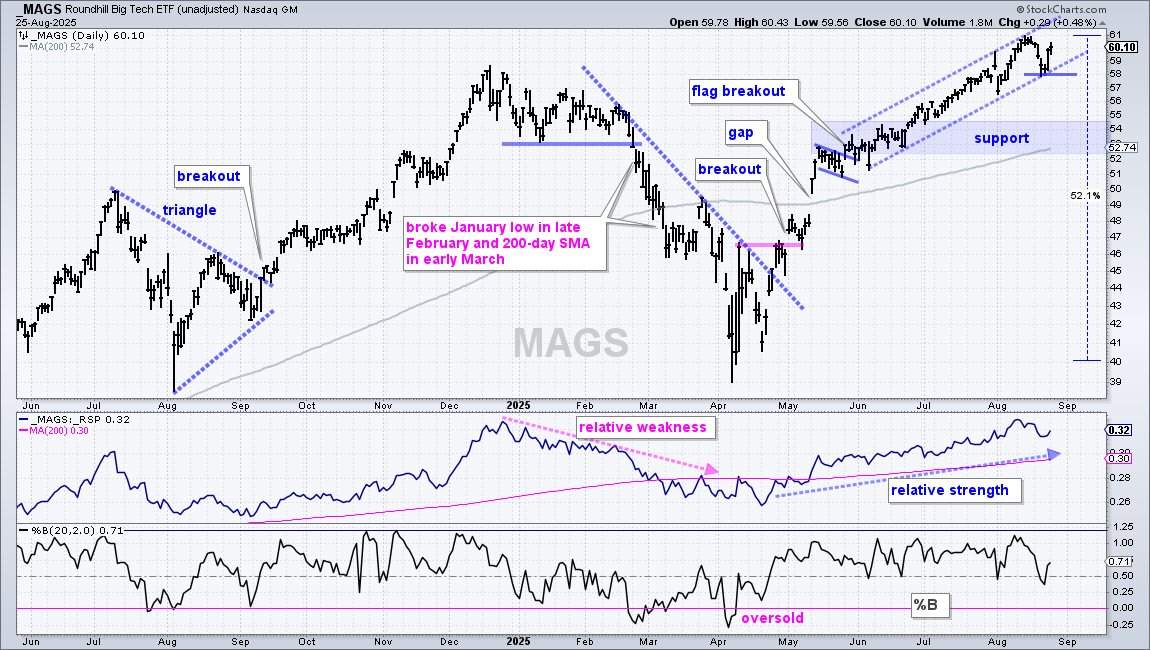
The first chart shows the Mag7 ETF (MAGS) with a trend-changing breakout in early May, a continuation gap in mid May and a flag breakout in late May. The ETF extended higher into August and was up over 50% since early April. MAGS is overdue for a correction, but pullbacks remain minimal as it holds within a tight rising channel. I am marking support at 58. A break here would reverse this upswing and argue for a correction.

SMH Stalls as SOXX Battles Flag Breakout

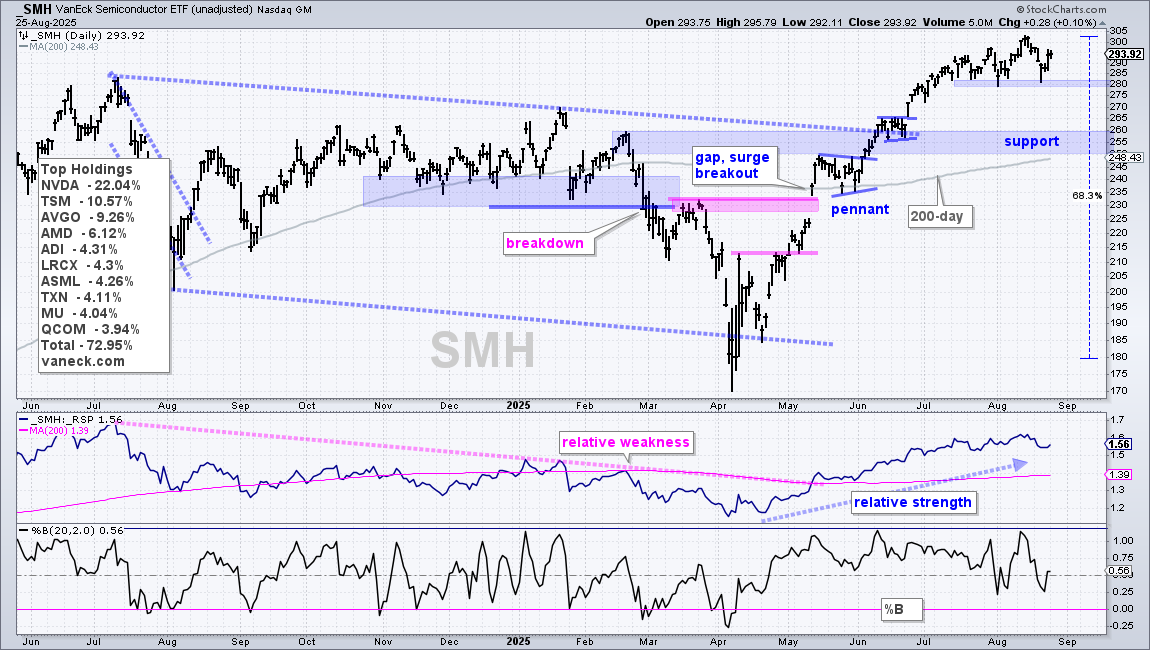
The next chart shows the Semiconductor ETF (SMH) hitting a new high on August 14th, but largely stalling since late July. The long-term trend is up with price well above the rising 200-day SMA and the price-relative (SMH/RSP ratio) is in a clear uptrend (relative strength). As with many tech and AI trades, SMH is up over 60% since early April and looking quite extended. The August lows mark first support, a break of which would argue for a deeper correction. Lower support is set in the 250-260 area (broken resistance and the rising 200-day SMA). Nvidia (NVDA), the largest holding (22%), reports earnings on Wednesday.

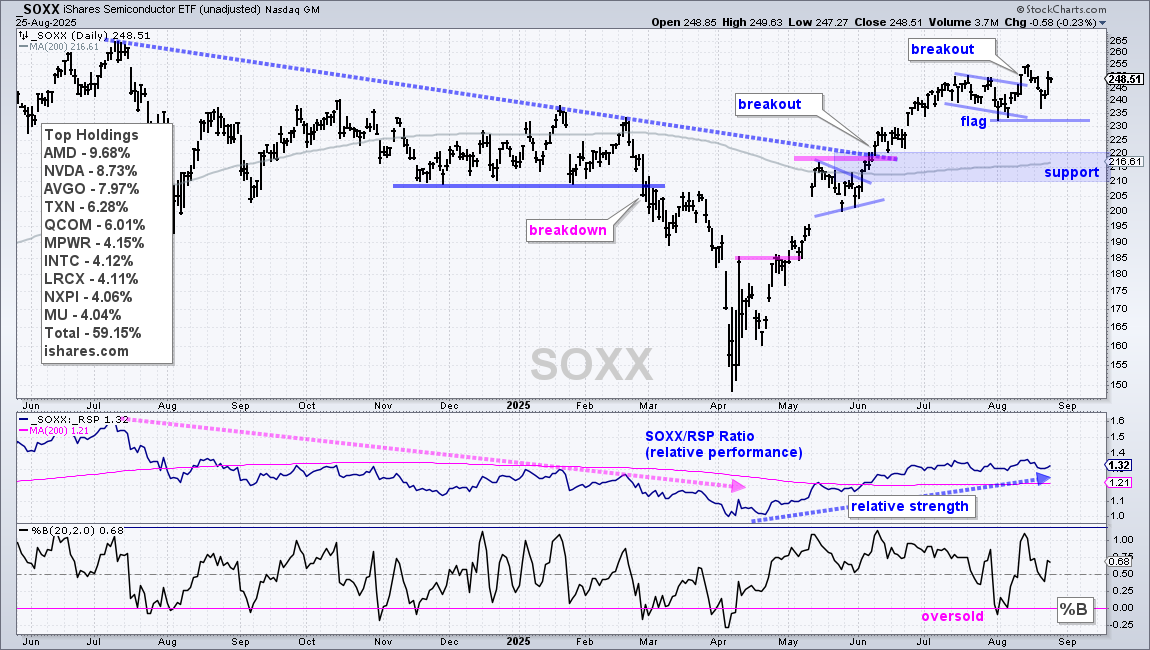
The next chart shows the Semiconductor ETF (SOXX) with a flag breakout in early August and a dip back into the flag last week. Overall, the flag breakout is holding because SOXX did not break below the flag lows. A break below 232 would negate the flag breakout and argue for a deeper pullback. I would still consider a pullback as a correction within a bigger uptrend because SOXX is above the rising 200-day SMA. Support is set in the 210-220 area.

ARTY, CIBR and IGV Correct with Falling Wedges

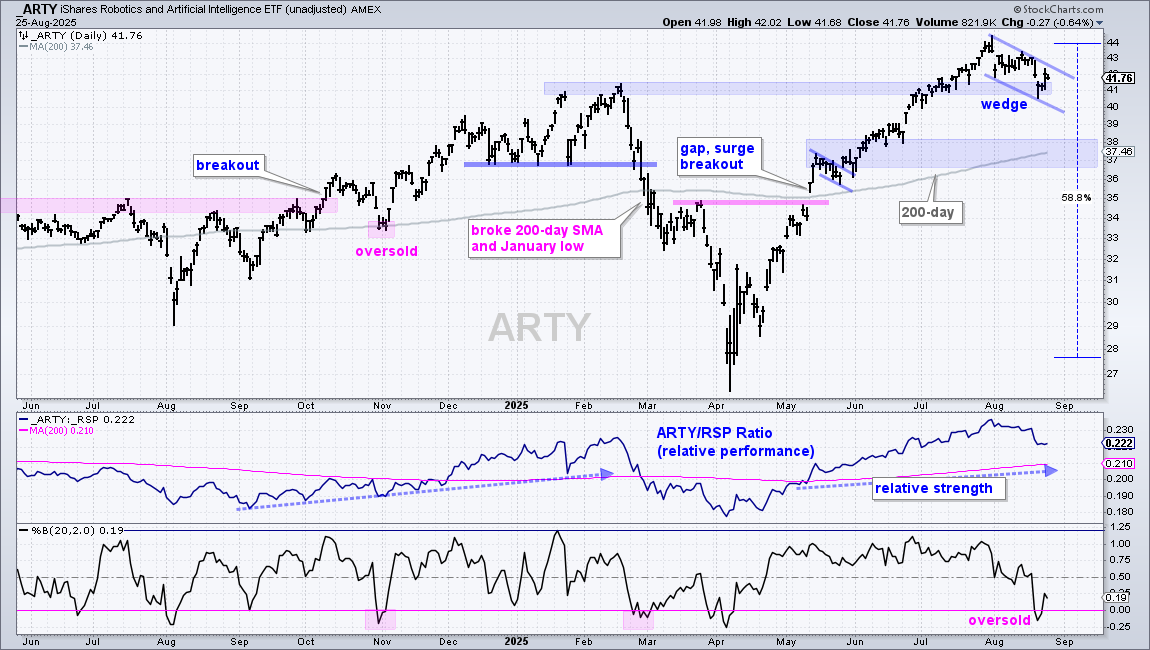
The next chart shows the Robotics AI ETF (ARTY) with a short-term bullish setup: long-term uptrend, short-term pullback, oversold condition and tradable pattern. ARTY is in a leading uptrend with new highs in July. Short-term, ARTY pulled back in August with a falling wedge back to the January-February highs, which turn first support. The falling wedge is a correction within the uptrend and a breakout at 42.50 would be bullish. Also note that %B became oversold with a dip below zero in late August. Barring a breakout, the correction remains a work in progress and could extend further because ARTY was up over 50% in less than four months.

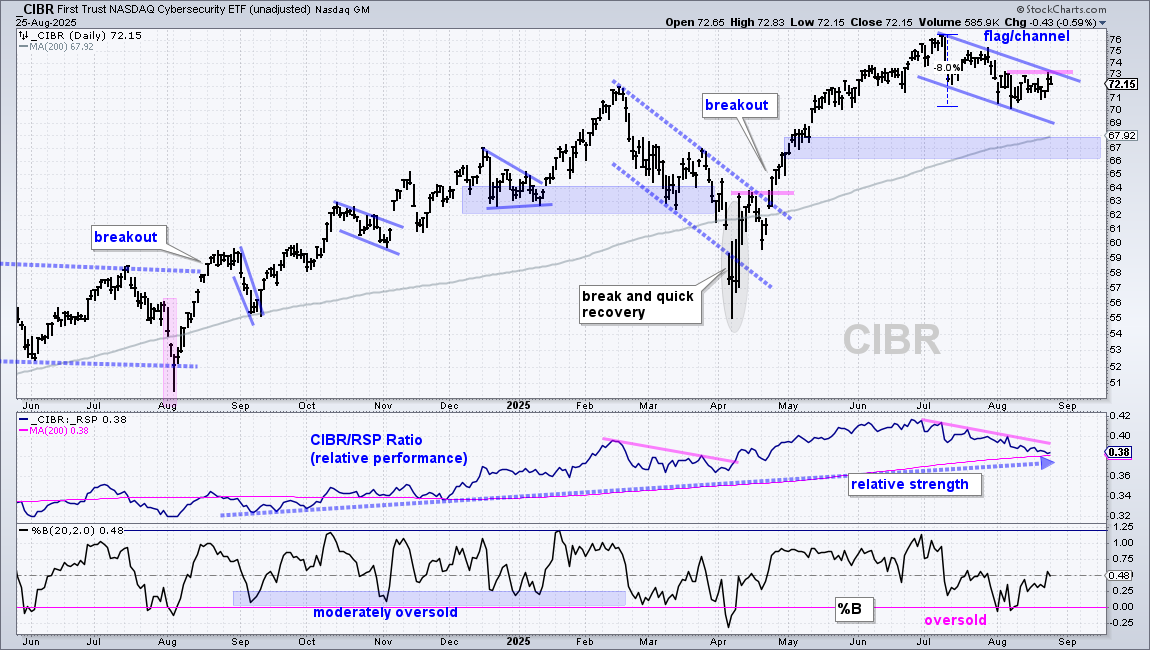
The next chart shows the Cybersecurity ETF (CIBR) with a correction underway. Note that corrections come in all shapes and sizes. They can be short (2-4 weeks), long (2-4 months), deep (test of 200-day SMA) and shallow (test of 50-day SMA). And every thing in between. The corrections from September to January were short (2-4 weeks). The current correction is seven weeks with a falling flag/channel taking shape. CIBR fell 8% from high to low and %B became oversold with two dips below zero. The setup is here. We just need an upside catalyst to reverse the downswing – and signal an end to the correction. CIBR established short-term resistance at 73.25 and a breakout here would be bullish. Note that Crowdstrike (CRWD) reports earnings on Wednesday.

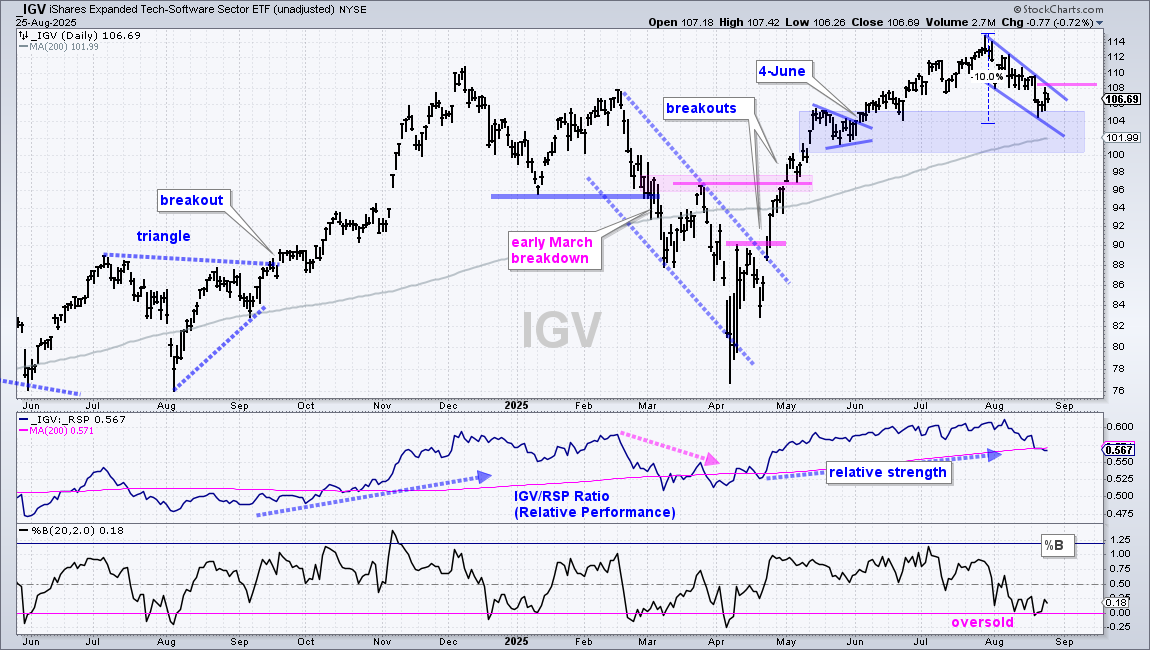
The next chart shows the Software ETF (IGV), which corrected with a 10% pullback from high to low. A falling wedge formed as the ETF reached the top of its support zone. IGV also became oversold as %B dipped below zero. The setup is here: long-term uptrend, short-term pullback, falling wedge and oversold. The immediate trend is down and the upside catalyst is missing. A breakout at 109 would reverse this slide.

BLOK Consolidates above Breakout Zone

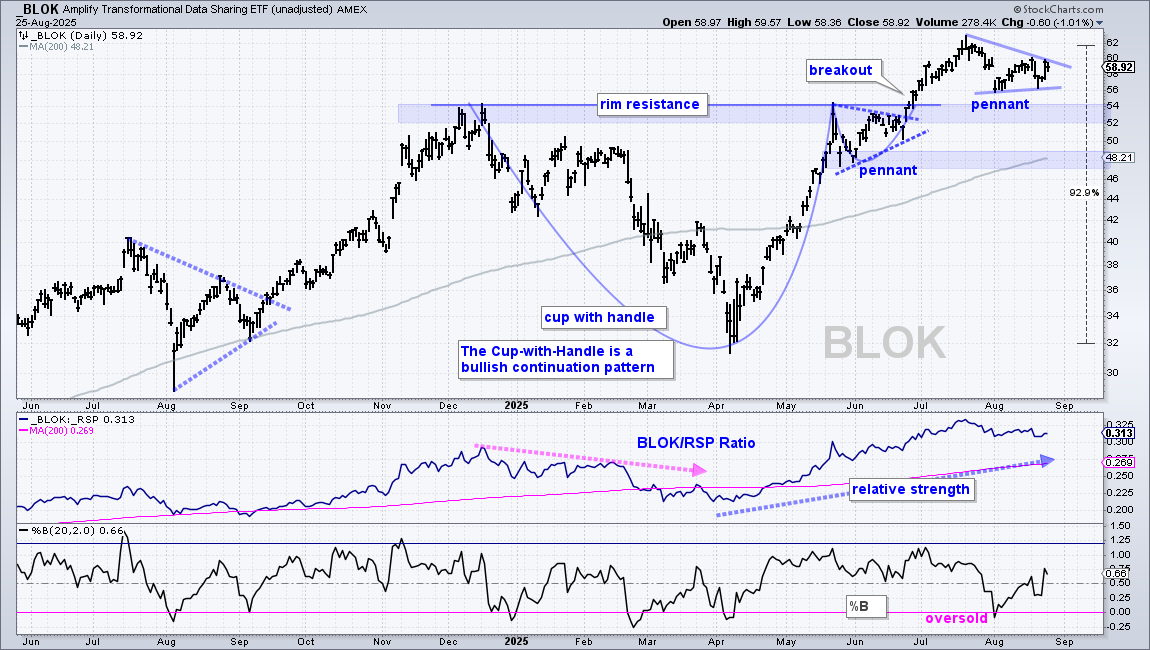
The next chart shows the Transformational Data Sharing ETF (BLOK) with a breakout and new high in late June. The breakout zone in the 52-54 area turns first support and BLOK is consolidating with a pennant above this level. Pennants are short-term bullish continuation patterns that take their bias from the prior move, which was up. A breakout at 60 would signal a continuation higher. Careful with this one because volatility is through the roof. BLOK was up over 90% from early April to mid July.

Send feedback to support(at)trendinvestorpro.com or use the contact form. 

Thanks for tuning in and have a great day!
Scroll to Top