
Headlines
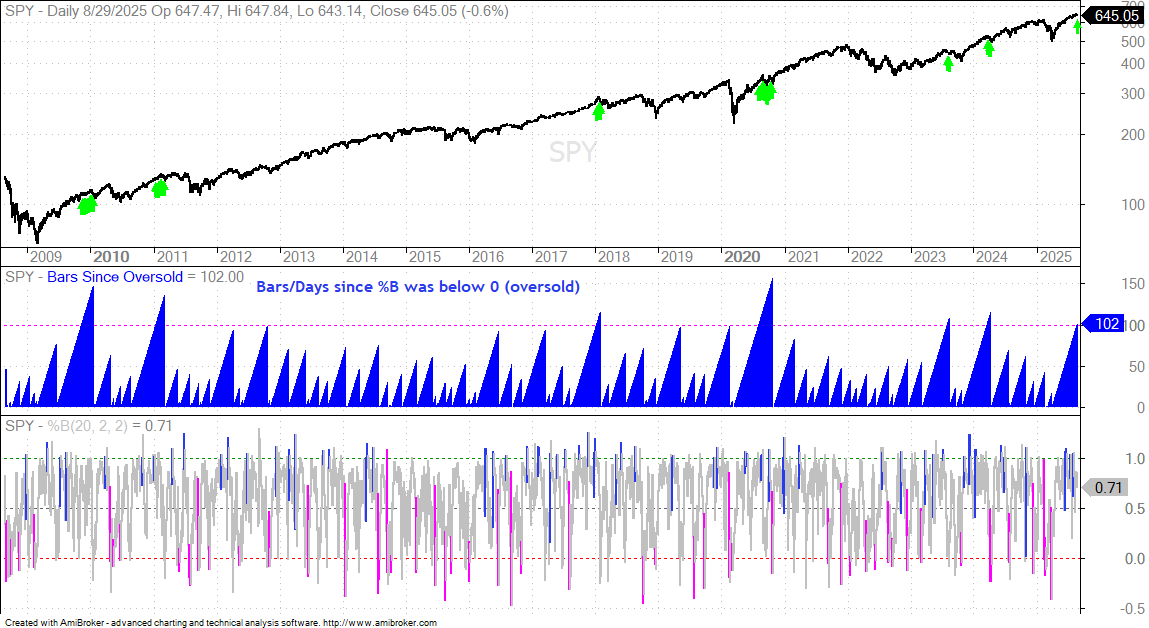
- SPY Recorded New All Time High in late August
- IWM Hit Highest Level of the Year in Late August
- Over 60% of Stocks above their 200-day SMAs
- Yield Spreads Are Narrow and Show Confidence
- 10 year Yield Falling since late May (lower rates)
- 3 month Bill Yield Fell Sharply in August (Fed Cut)
The next report/video will be on Wednesday, Sept 3rd.
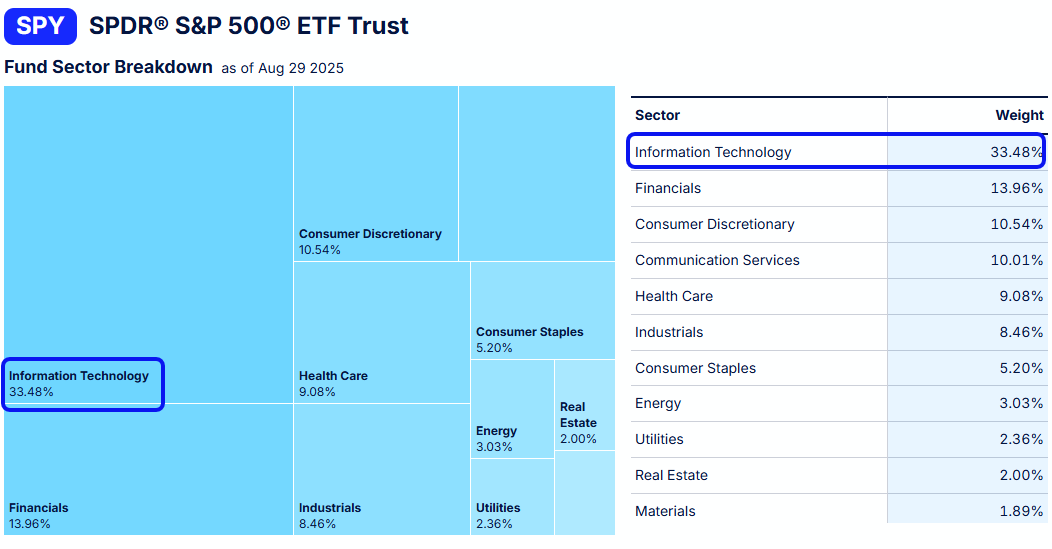
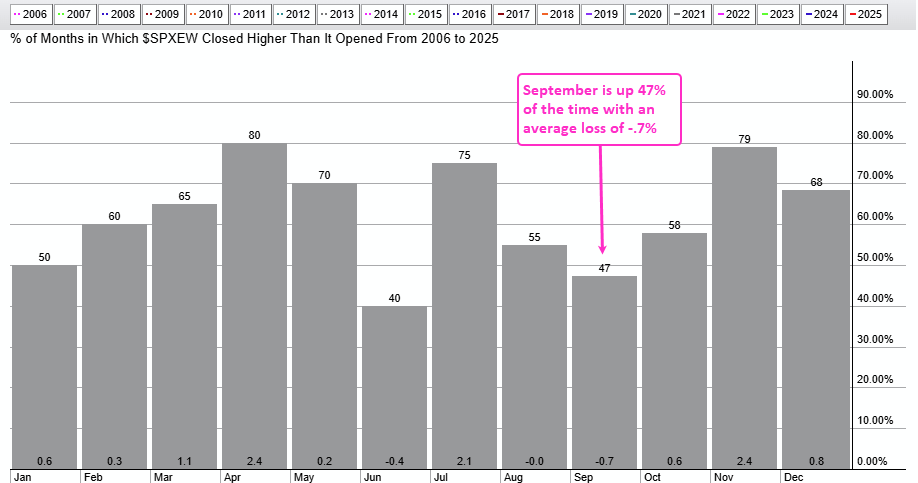
The long-term trend is up for the major index ETFs, breadth indicators are majority bullish and yield spreads remain narrow. These three items support the bull market for stocks (see report here). Short-term, however, signs are emerging that a correction could be coming. First, QQQ and the Technology sector show relative weakness the last five weeks. Second, stocks became extended with big moves from April to August and SPY has gone 102 days without an oversold reading (pullback). Third, seasonal patterns are weak from now until mid October. Thus, I would not be surprised to see a correction sometime between now and October.
NDX %Above 50-day SMA Weakest of the Majors
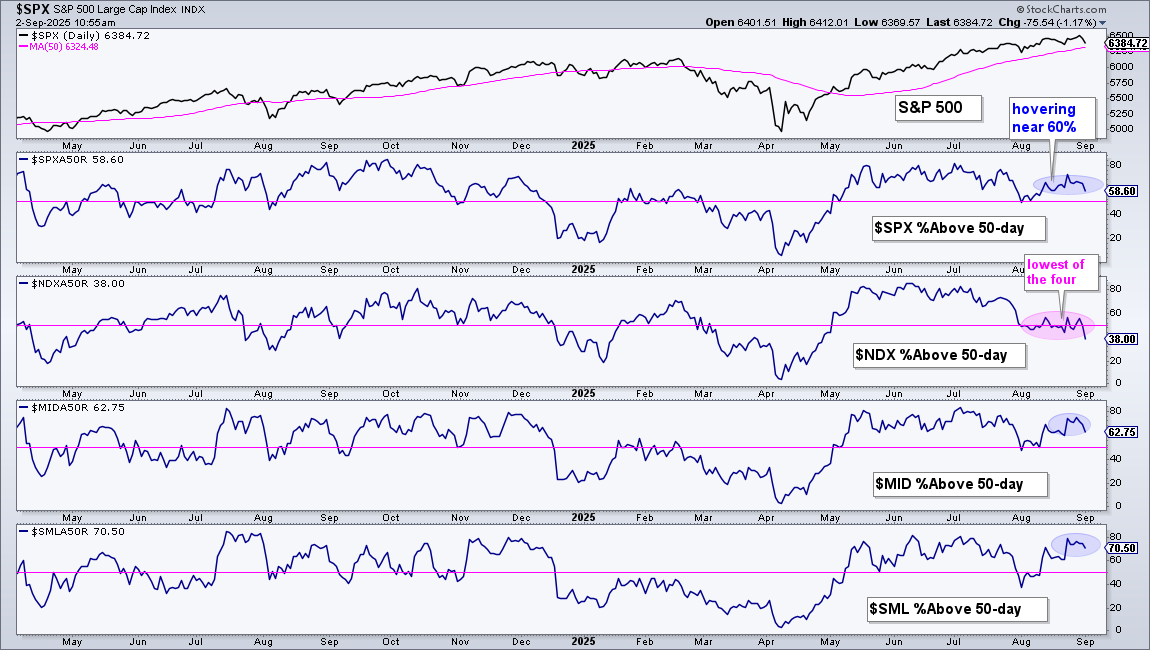
The next chart shows the percentage of stocks above their 50-day SMA for the four major indexes. Over 55% of S&P 500, S&P MidCap 400 and S&P SmallCap 600 stocks are above their 50-day SMAs (blue shading). In contrast, fewer than 40% of Nasdaq 100 stocks are above their 50-day SMAs (pink shading). In fact, $NDXA50R moved to its lowest level since late April. Nasdaq 100 stocks are under the most selling pressure.
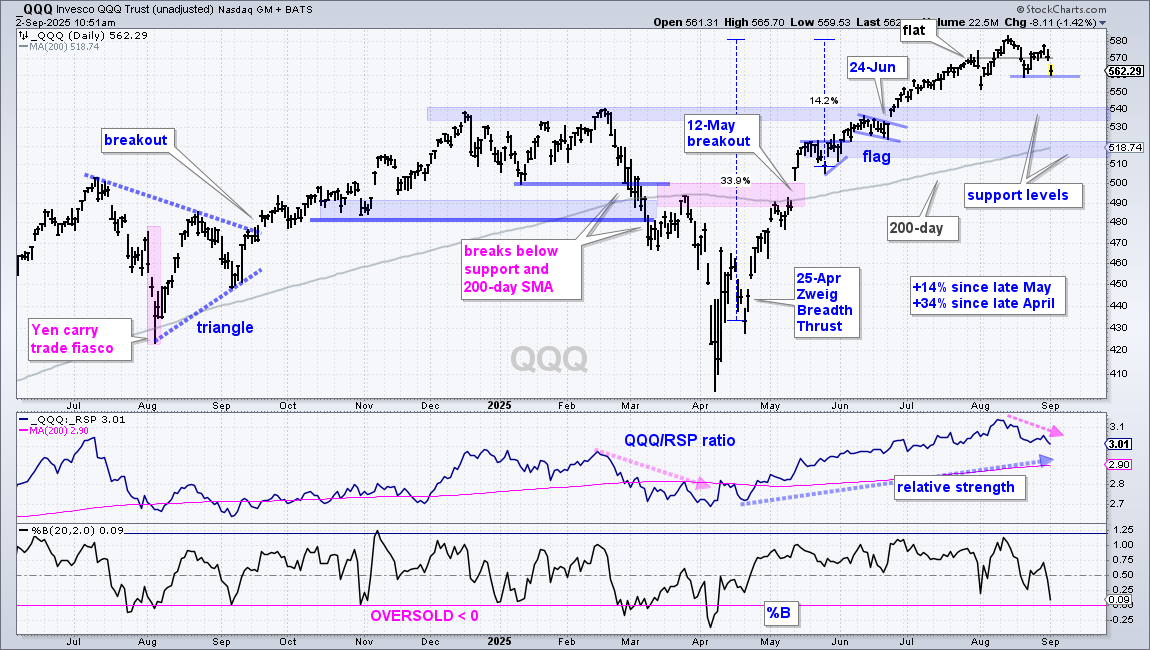
QQQ and XLK are Flat since late July - Relative Weakness
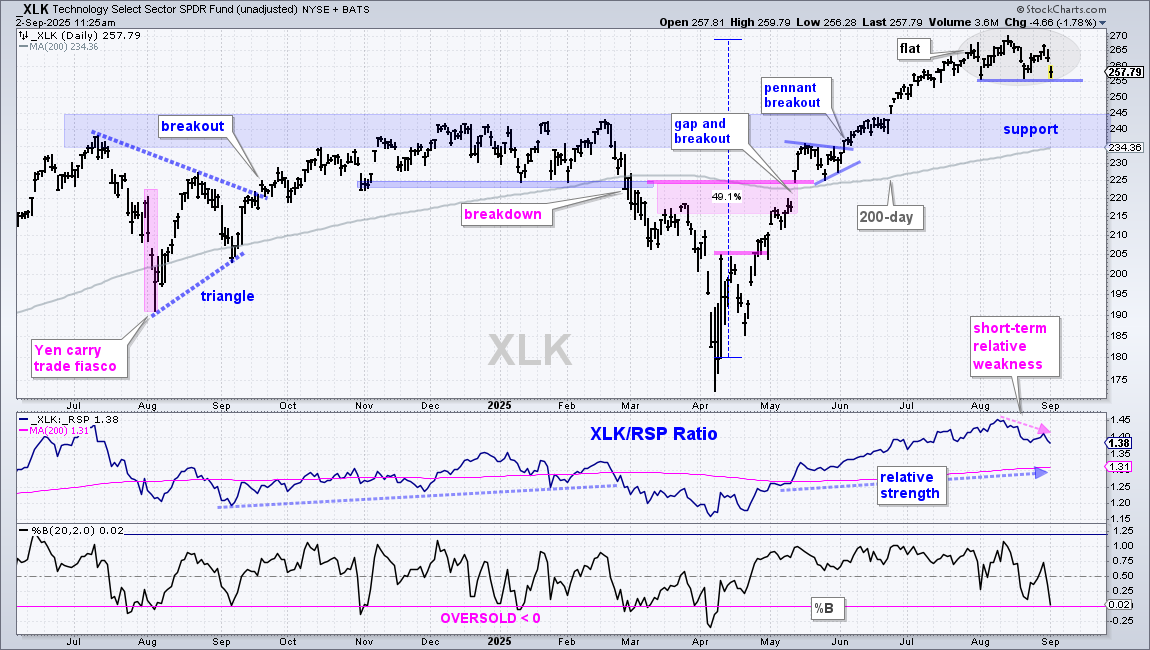
The next chart shows QQQ hitting the 570 area in late July and stalling in this area the last five weeks (gray line). QQQ went nowhere as the broader market advanced, which means QQQ underperformed. The price-relative (QQQ/RSP ratio) confirms short-term relative weakness with a decline in August. Support is set at 560. A break would reverse the short-term uptrend and argue for a correction towards the 540 area.
Semiconductors Stall
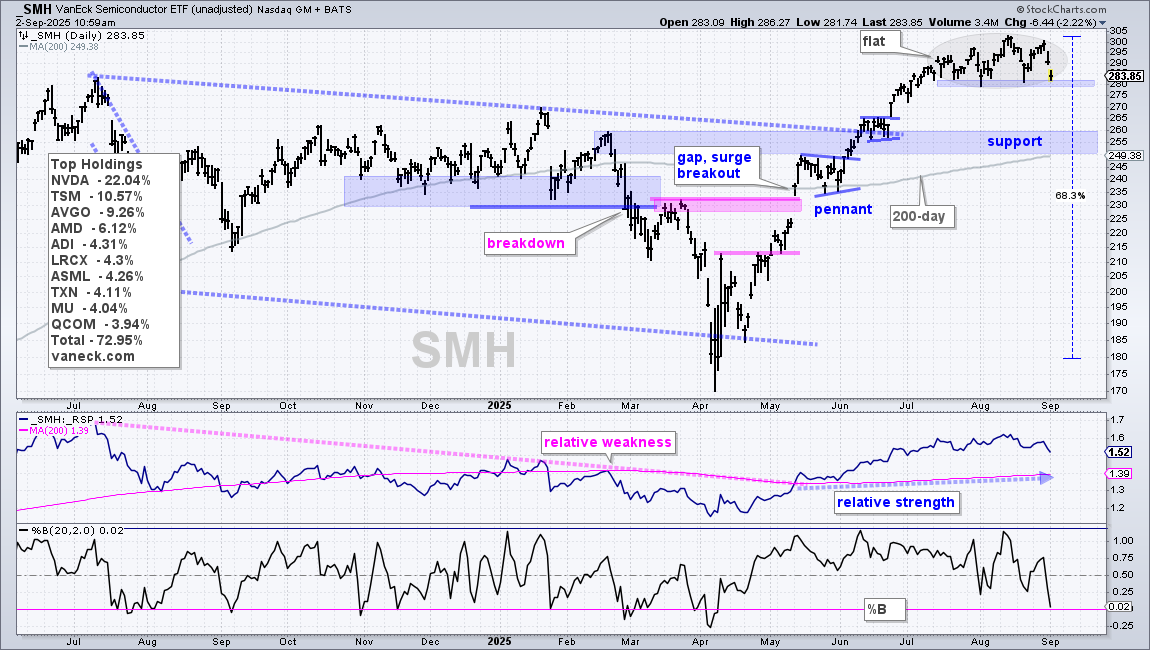
The next chart shows the Semiconductor ETF (SMH) hitting the 290 level in mid July and moving below 290 over the last two days. SMH has gone nowhere for five weeks (gray oval). The ETF established support at 280 in August. A break here would reverse the short-term uptrend and argue for a correction towards support in the 255 area.
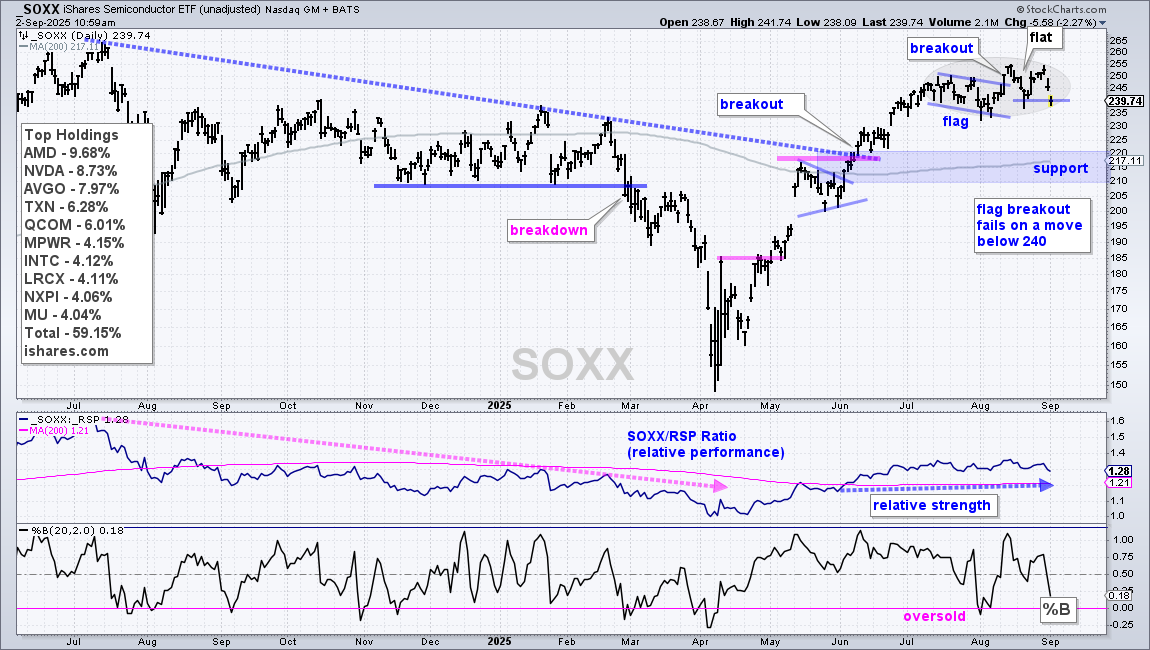
The next chart shows the Semiconductor ETF (SOXX) with a flag forming into early August and a flag breakout in mid August. This breakout is stalling as SOXX fell twice into the flag zone (240-245 area). I am marking re-evaluation support at 240. A close below this level would negate the flag and argue for a deeper correction.
Prior Leaders Holding Support: MAGS, ARKF, ARKK
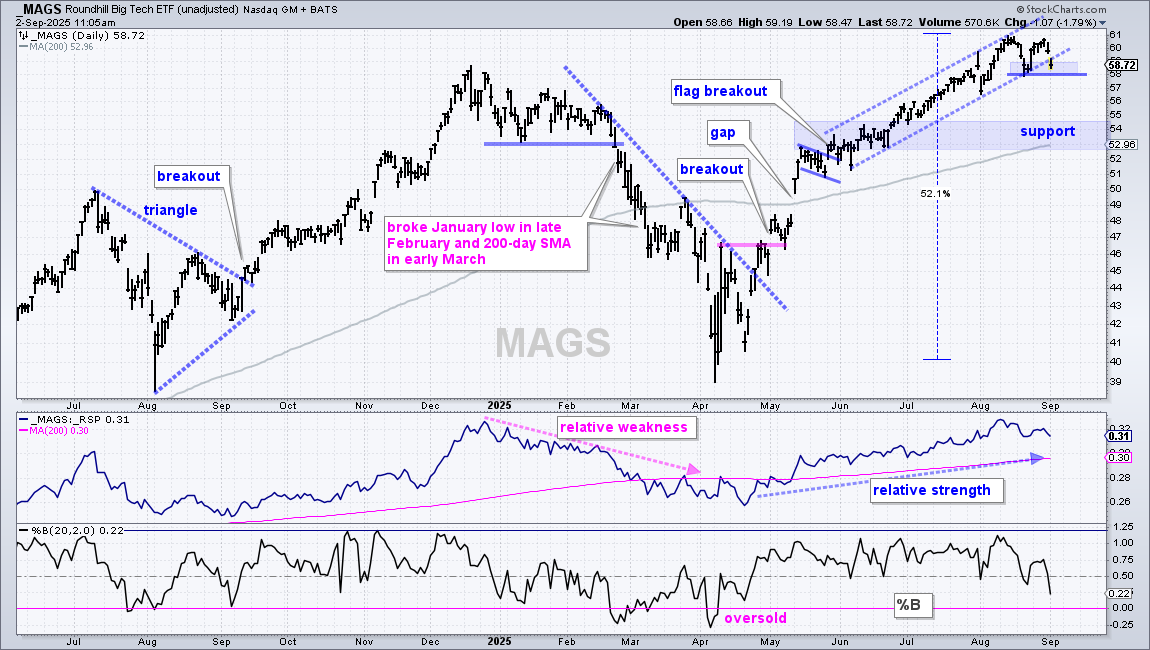
The Mag7 ETF (MAGS) remains in a short-term uptrend with a tight rising channel taking shape. The lower trendline and late August lows mark support in the 58-59 area. A break below 58 would reverse the short-term uptrend and argue for a deeper correction. Next support is set in the 52-54 area.
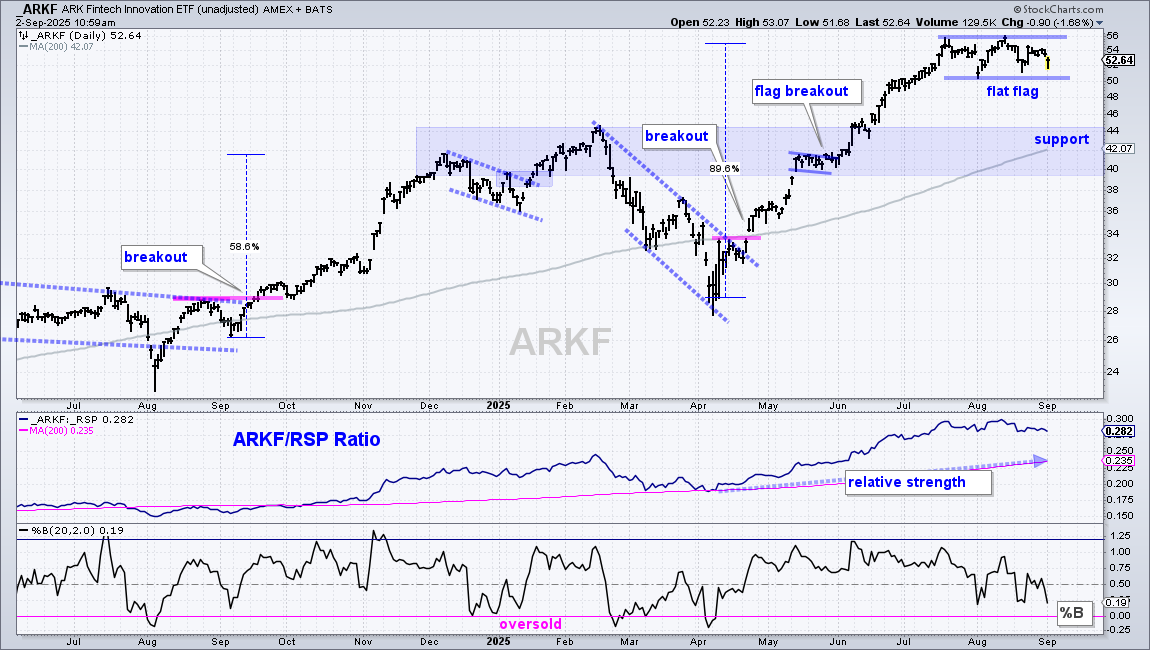
The next chart shows the ARK Fintech Innovation ETF (ARKF) with a massive advance from April to July (89%). ARKF then embarked on a consolidation with a flat flag forming. Technically, a flag consolidation within an uptrend is a bullish continuation pattern. This means a breakout at 56 would open the door to further gains. The August lows mark support at 50. A break here would negate the flag and argue for a correction.
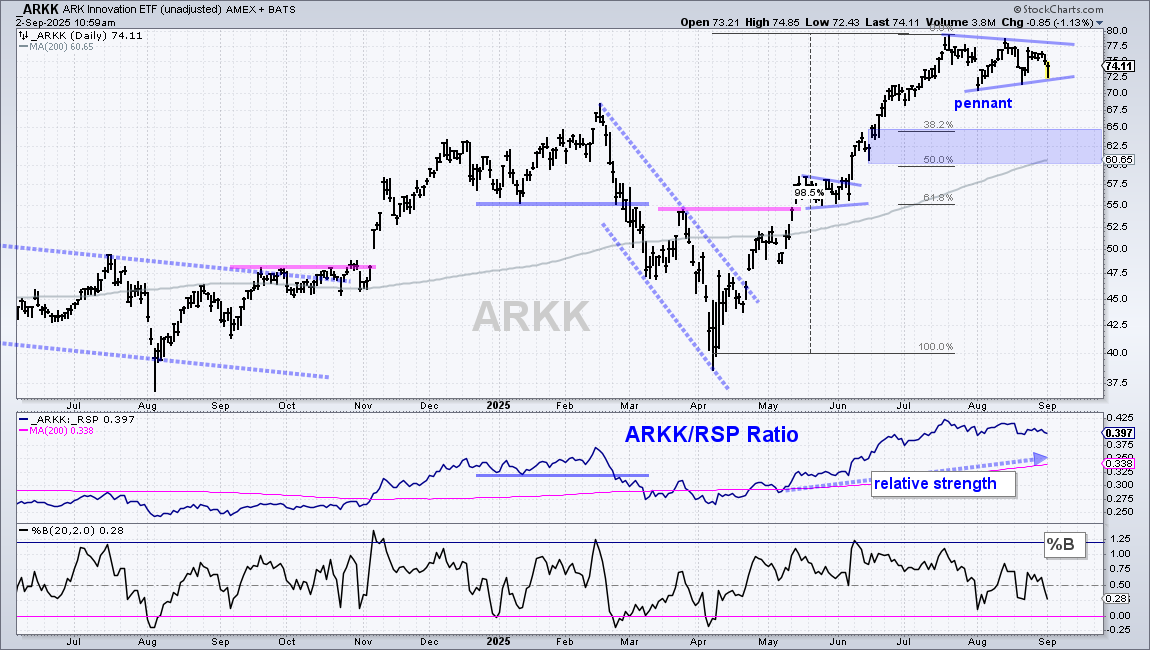
The next chart shows the ARK Innovation ETF (ARKK), which is the king of the high beta tech trade. ARKK surged some 98% from April to July and then consolidated with a pennant. Technically, this is a short-term bullish continuation pattern and a breakout at 78 would be bullish. The late August low marks support at 72. A break here would be short-term negative and argue for a correction.
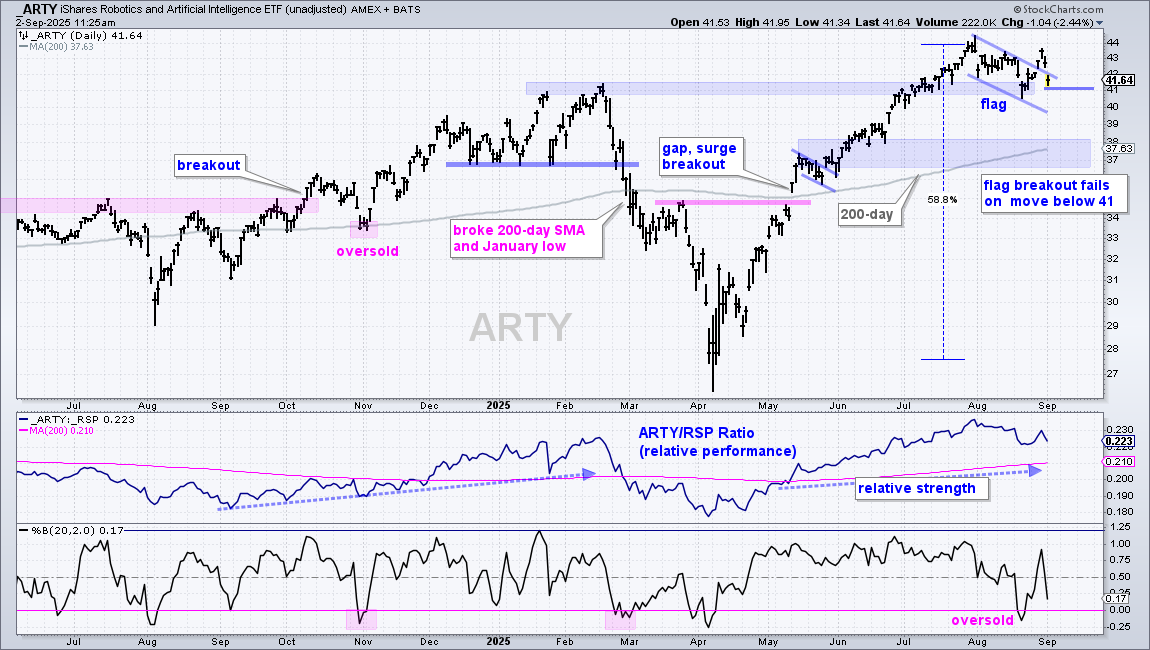
Flag Breakouts to Watch: ARTY, CIBR, IGV
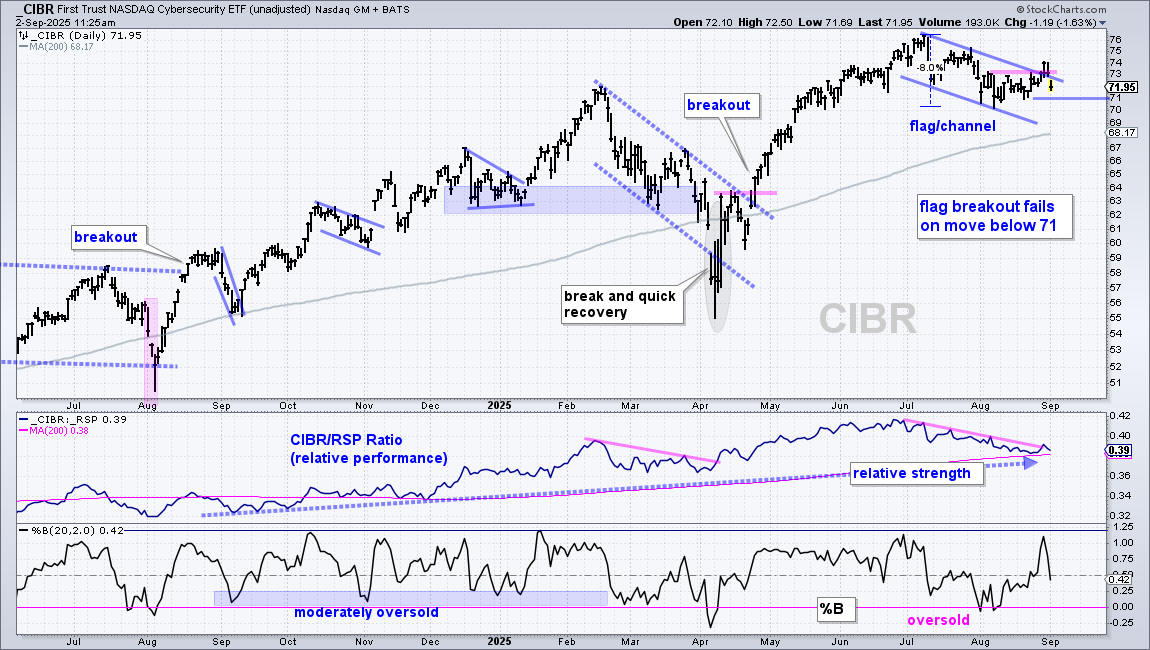
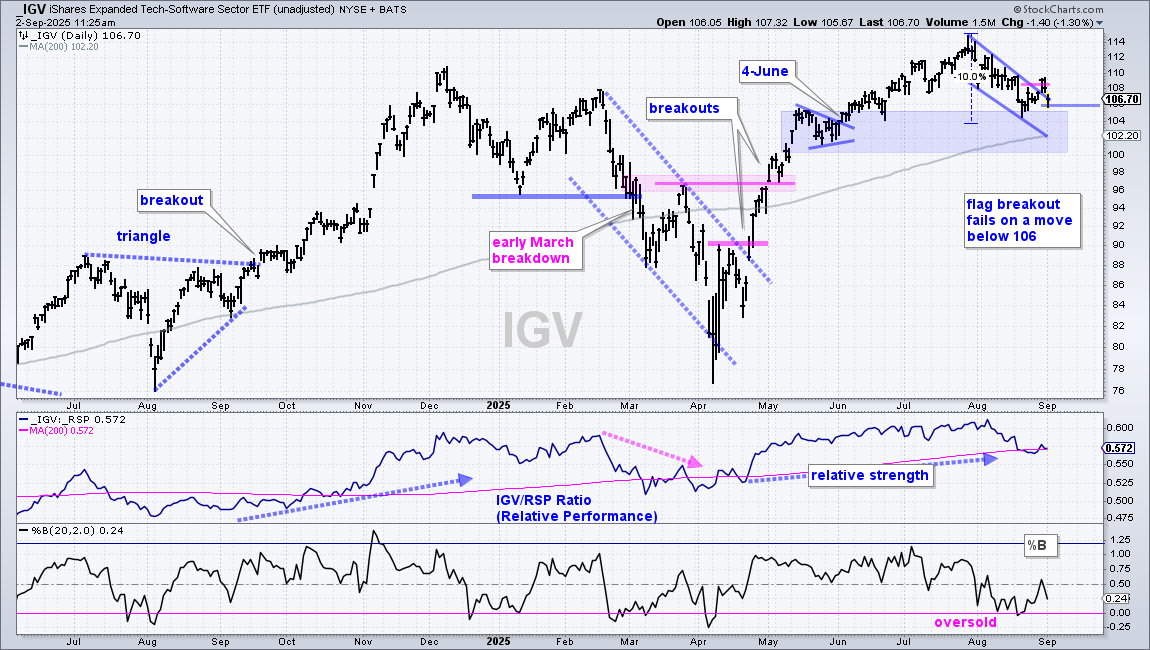
There are three ETFs with falling flags and flag breakouts last week. These breakouts are already being challenged with sharp declines on Tuesday. A pullback into the flag is normal, but a pullback below last week’s low would negate the breakout move.
The first chart shows the Cybersecurity ETF (CIBR) with re-evaluation support at 71. A break here would negate the flag and argue for more corrective price action.
Other Items to Consider in September
- Labor Day Week Tends to be Weak after Strong August (QuantifiableEdges)
- Employment Report (5-Sep), PPI (10-Sep) and CPI (11-Sep)
- Fed Meets on September 16 and 17 (Fed Put on the Line)
- Government Funding Deadline is September 30th
- China Ramping up Semiconductor Development and Production.
From Gemini AI: China’s semiconductor development is characterized by an aggressive drive for self-sufficiency, spurred by government initiatives and geopolitical pressures like US sanctions and the US-China trade war. While historically reliant on foreign technology, China has invested heavily in domestic chip manufacturing, research, and the development of a domestic supply chain, leading to growth in areas like compound semiconductors and the production of mature-node chips. However, challenges remain in acquiring cutting-edge manufacturing equipment, particularly for non-planar processes, while Chinese firms continue to compete globally and expand their reach in mature chip technologies.
DISCLAIMER: This content provided strictly for informational and educational purposes. It should not be interpreted as an offer to buy or sell any security, nor as a solicitation to engage in any investment activity. Nothing here constitutes a recommendation regarding any specific security, portfolio, transaction, or investment strategy.
At times, the author or affiliates may hold positions or interests in securities discussed. Any stocks or examples mentioned are not endorsements or suggestions to purchase. This material does not consider your individual financial goals or circumstances, and you should seek guidance from a qualified financial or investment adviser before making any trading or investment decisions.
Past performance does not guarantee future results.
Send feedback to support(at)trendinvestorpro.com or use the contact form.
