This is just a short update for SPY and a decision on the preferred moving average combo for the S&P 500. After a plunge on Thursday, stocks firmed on Friday and forged an intraday reversal on Monday. This firmness is occurring near short-term support for many ETFs and the major index ETFs held their intermediate uptrends, which have been in place since late March. Small-caps, housing, biotech, gold miners and corporate bonds led the advance.
I will post the fourth installment of the StochClose strategy later today. We will test signals with and without a bull market filter.
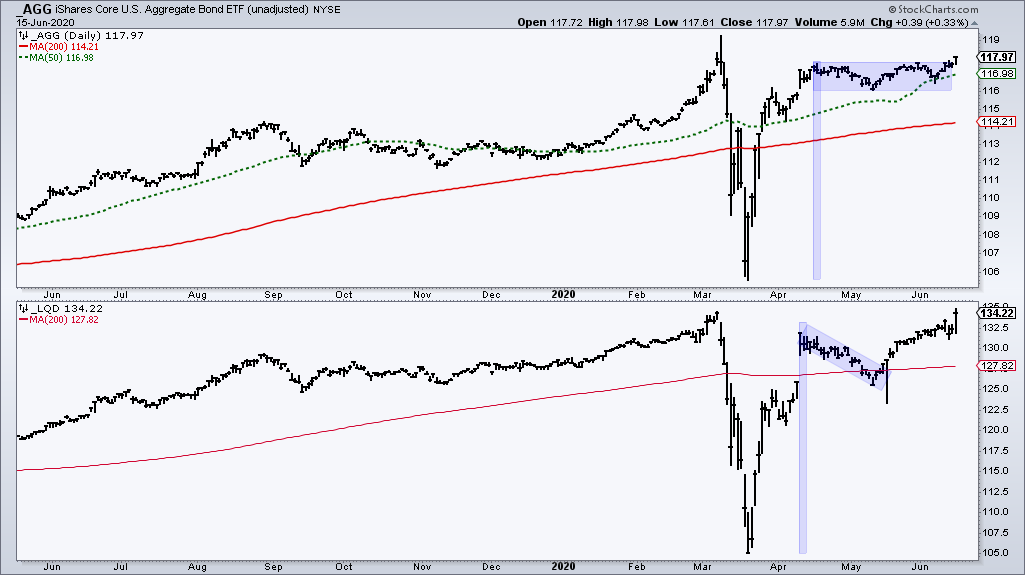
Corporate Bonds Pop
The Fed announced that it will start buying corporate bonds directly. This triggered a sharp advance in the Corporate Bond ETF (LQD) and a flag breakout in the Aggregate Bond ETF (AGG). The High-Yield Bond ETF (HYG) also bounced and these bounces mean bond spreads narrowed, which is positive for stocks and the banking industry.
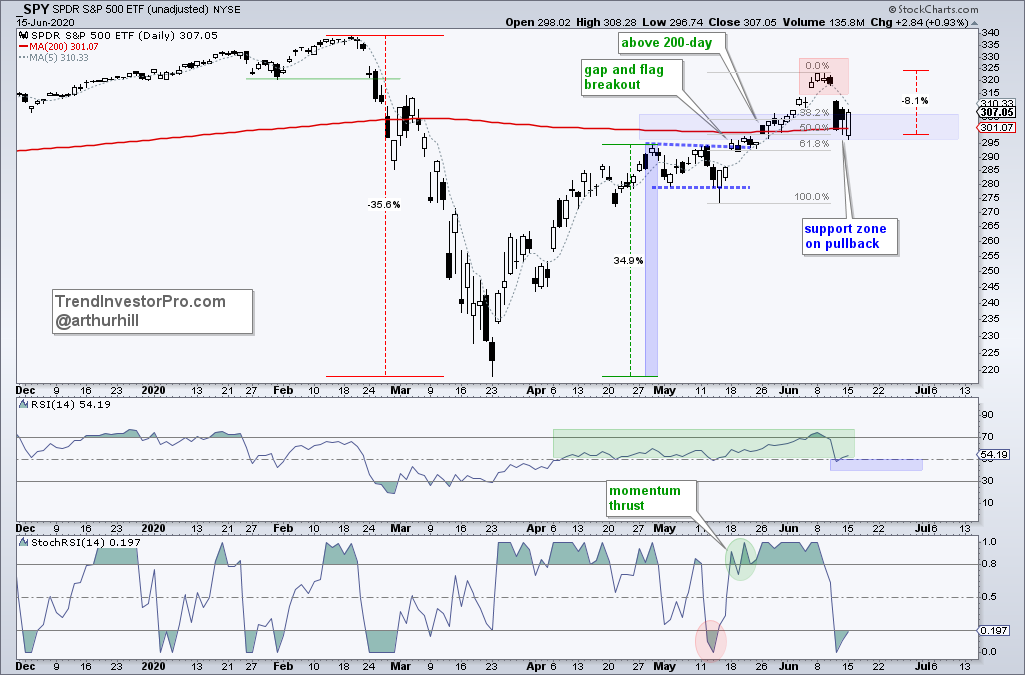
SPY Bounces off Support Zone
The chart below shows the S&P 500 SPDR plunging on Thursday, firming on Friday and forming a long white candlestick at the 200-day SMA on Monday. The ETF firmed in the support zone marked last week and RSI bounced off the 40-50 zone. The 200-day SMA is a classic battle ground for the S&P 500 and SPY. Thus, we could see a short-term bounce off this level. Monday was a reversal day of sorts and this affirms support here. A close below 295 would break support.
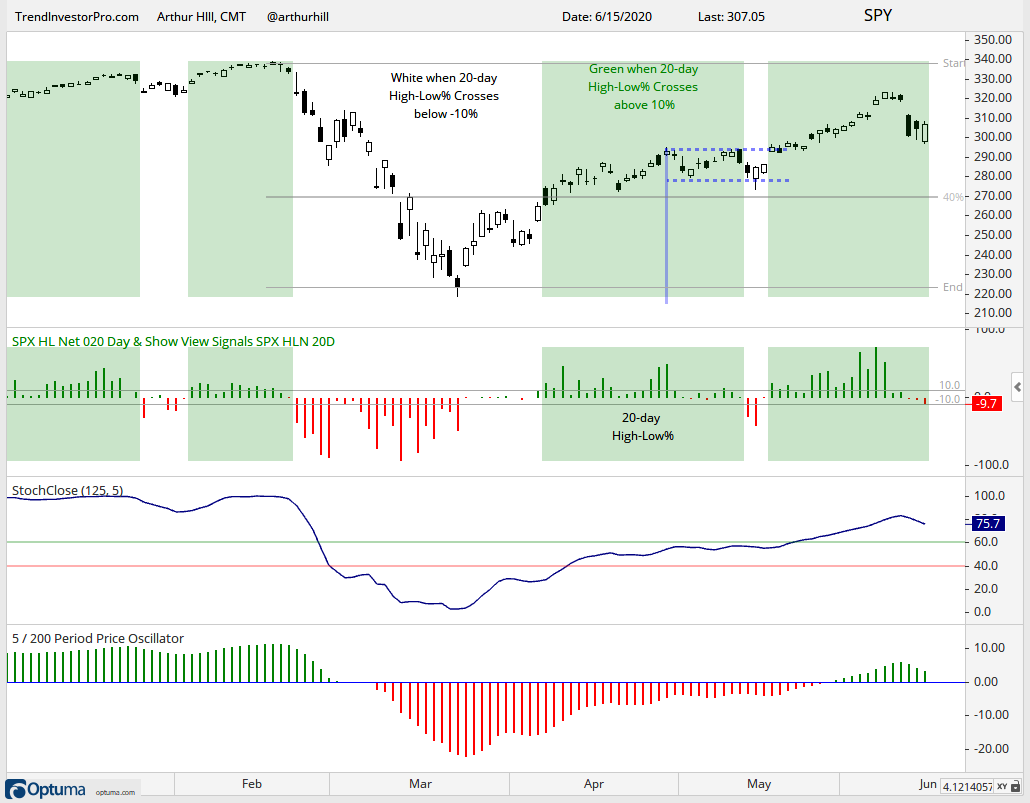
20-day High-Low Percent Stays Bullish
The next chart shows SPY with 20-day High-Low Percent. 20-day lows expanded with the early dip on Monday, but High-Low Percent did not exceed -10%. Thus, the indicator remains on a bullish signal right now. Keep in mind that this is a short to intermediate term indicator. Long-term, the S&P 500 breadth model turned bearish on Thursday. Sometimes the short-term indicators do not jibe with the longer term indicators.
The middle window shows StochClose (125,5) moving above 60 in late May and holding above 60 the last few weeks. This is technically an uptrend that would be reversed with a move below 40. On the price chart, I used a custom retracement setting to show the 40% level of the current high-low range based on closing prices. A rough estimate suggests that a close below 270 would push StochClose to the 40 area. The lower window shows the percentage difference between the 5-day SMA and 200-day SMA.
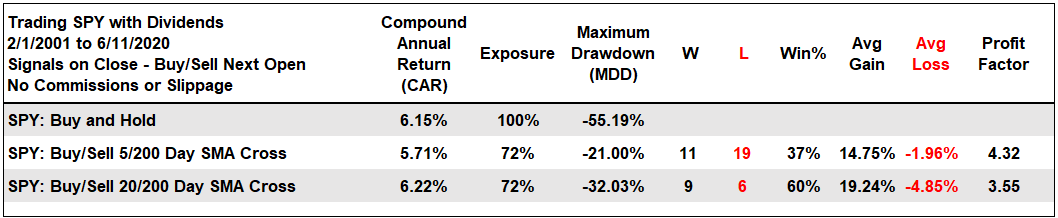
The Preferred Moving Average Combo
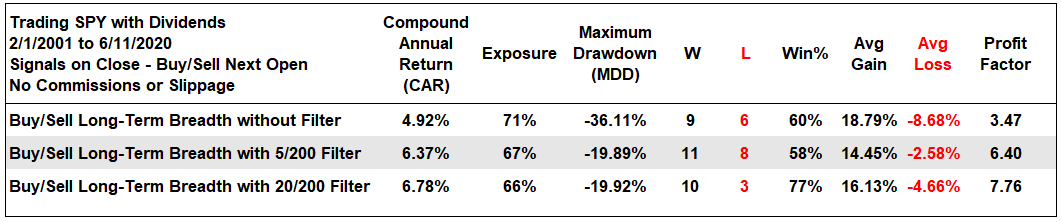
A subscriber asked which moving average pair I prefer. As with all things in technical analysis, the answer is not as clear-cut as one might think. Using just SPY or the S&P 500 with one moving average cross, my preference is for the 5-day SMA and 200-day SMA. As the table below shows, the 5/200 cross has a much lower Maximum Drawdown and a higher Profit Factor. The 20/200 cross has a higher Compound Annual Return and a higher Win%. It is a personal choice, I prefer the lower drawdown and higher Profit Factor.
I presented a 5-indicator breadth model for the S&P 500 on Friday and performance improved when adding a trend filter for SPY. This trend filter is based on the 5/200 cross or the 20/200 cross. Buy when breadth and the trend filter are bullish. Sell when breadth OR the trend filter turn bearish. As the table below shows, the Compound Annual Return, Win% and Profit Factor were higher when using the 20/200 filter. However, the Maximum Drawdowns were the same when using the 20/200 and 5/200 trend filters.
So what is it going to be?
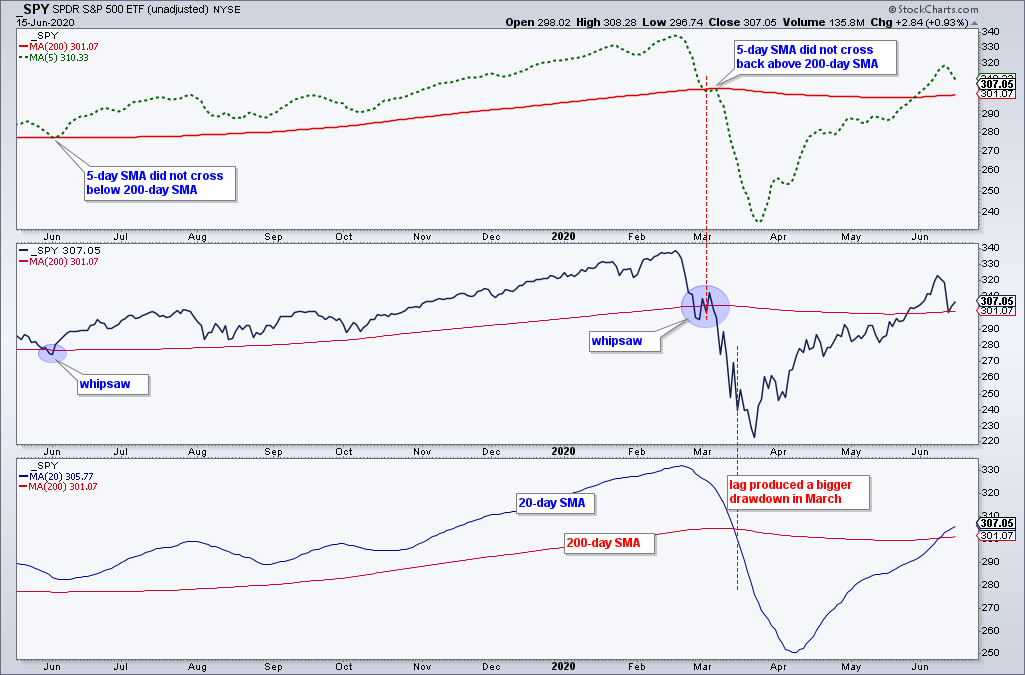
To remain consistent, I am going to go with the 5/200 cross as the preferred combo for timing the S&P 500 and SPY, and as the trend filter for the breadth model. The main drawback is that this combo will no doubt produce more whipsaws than a combo using the 20/200 cross for the filter. Again, it is a personal preference, but I prefer the quicker signals and the lower drawdowns.
As the chart above illustrates, using the close and the 200-day SMA generated too many whipsaws. The 5/200 cross reduces whipsaws and provides quicker signals. The 20/200 cross reduces whipsaws even more, but the signal in March produced a bigger drawdown (loss). Furthermore, the 5-day crossed the 200-day on May 29th and the 20-day cross the 200-day on June 9th.
")