The Dollar, gold, bonds and high-growth stocks were covered on Thursday morning because of big moves and a signal for gold. This was perhaps a knee jerk reaction so I will continue to watch and monitor price action next week, which is when the market could show its true colors. Today’s note will cover the big three: SPY, QQQ and IWM. I will also look at two short-term breadth indicators that are not keeping pace here in June.
SPY Continues to Grind Higher
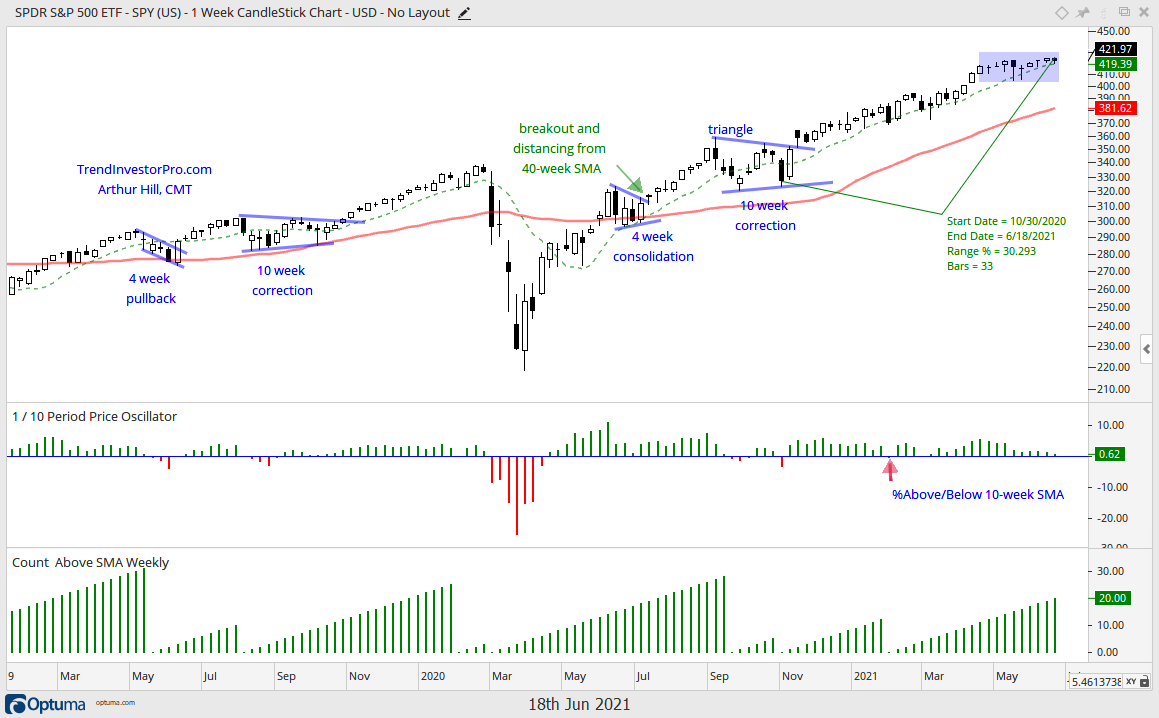
The S&P 500 SPDR (SPY) continues to grind higher with minimal movement from open to close (weekly) the last eight weeks (blue shading). There were some relatively deep dips during the week in mid May when the weekly low broke the 10-week SMA, but SPY has not closed below the 10-week SMA since late January (20 weeks, should it hold again this week). This is testament to the grind as the ETF simply inches higher and maintains its uptrend.
QQQ Leads Since mid May
QQQ is the real story the last few weeks as it dipped below its 10-week SMA in mid May and led the big three over the last four weeks (+5.6%). The blue lines show a rising channel to define the overall upswing since September. Even though I am not a big fan of price targets based on trendlines, the upper trendline extends to the 380 area in late July.
IWM Tests Breakout Zone
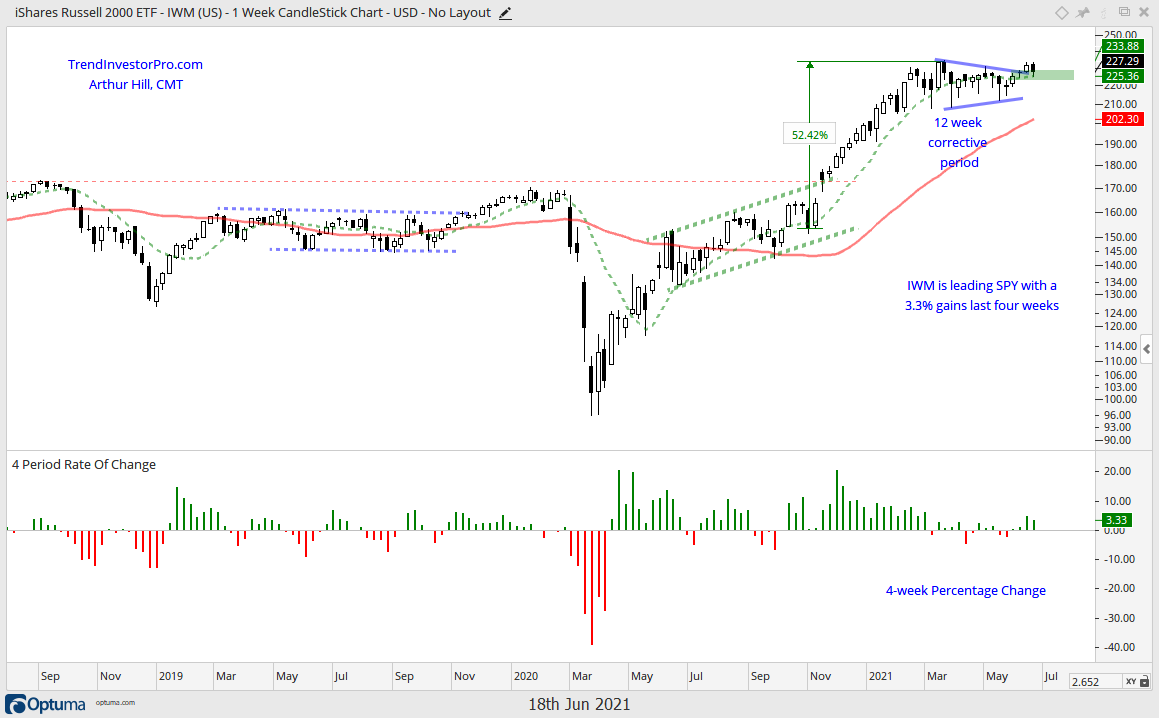
Small-caps are also getting into the action as the Russell 2000 ETF (IWM) broke out of a triangle consolidation last week. Small-caps fell back this week and IWM is testing the breakout zone already. This breakout is considered bullish and valid as long as IWM holds 224 on a weekly closing basis. Note that IWM is up 3.3% over the last four weeks and outperforming SPY, which is up 1.69%.
Short-term Breadth Indicators Wane
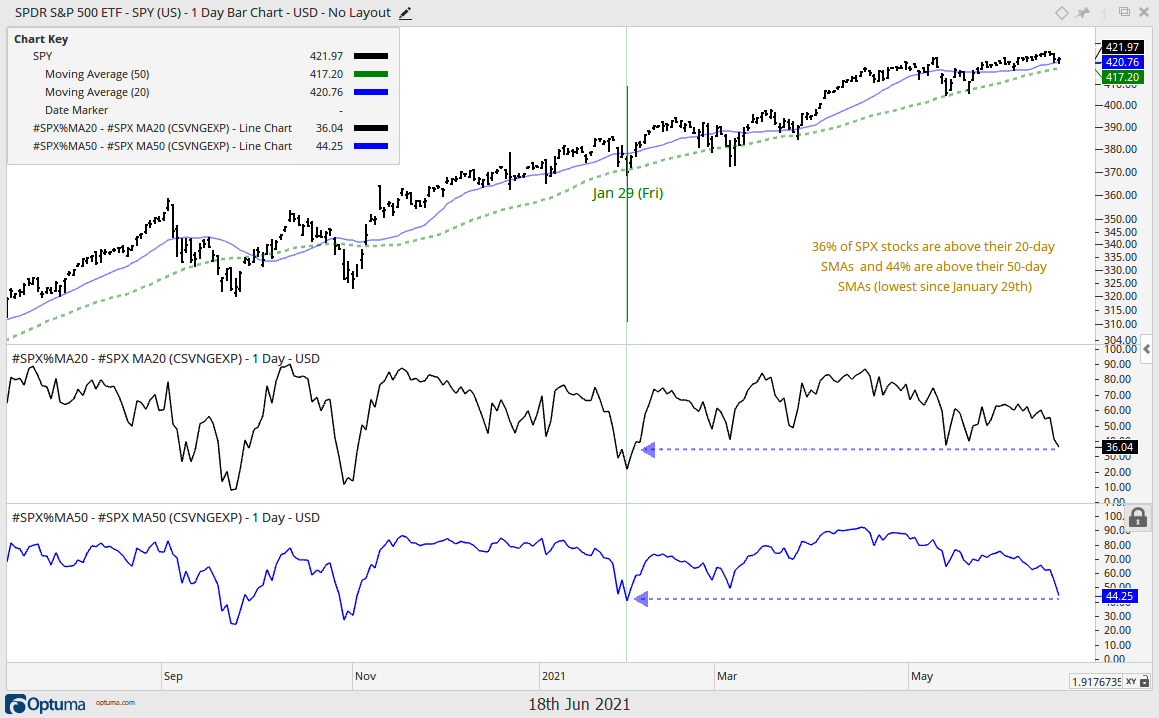
SPY is up 1.69% the last four weeks and owes its gains to the Technology sector, which accounts for 27% of the ETF. The S&P 500 EW ETF (RSP), for example, is down .09% the last four weeks. Even though SPY remains in a clear uptrend, there are signs of less participation when we look at the percentage of stocks above their 20 and 50 day SMAs. SPY is within spitting distance of a new high and above both SMAs (20 and 50 day). However, only 36% of component stocks are above their 20-day SMAs and less than 50% are above their 50-day SMAs (44.25%).
These sub-50% levels were last seen in late January, when SPY closed below the 50-day SMA (green vertical line). Values below 50% are expected when SPY is below its 50-day SMA. However, values below 50% are not expected when SPY is above its 50-day SMA and close to a new high. This is not reason enough to turn bearish, but it does argue for a little caution going forward because the market is not firing on all cylinders here in June.
")