Defensive Groups Catch a Bid (XLV, XLU, XLP, PBJ) Medical Equipment ETF Pulls Back from Resistance (XHE)
Technology SPDR Sums Up Situation in Tech-Related ETF (XLK)
A Flag in the Wind Energy ETF (FAN)
Copper Miners ETF Surges within Trading Range (COPX)
DB Base Metals ETF Turns the Corner (DBB)
Gold Miners ETF Throws Back to Breakout (GDX)
Weight of Evidence Bullish
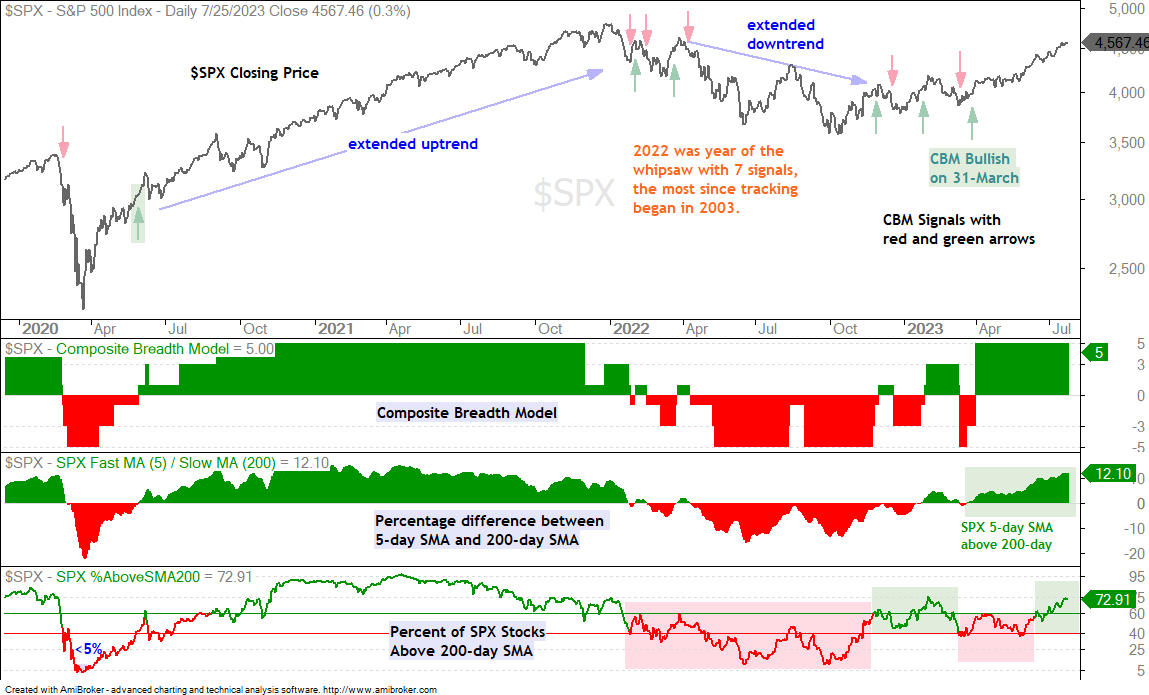
The weight of the evidence remains bullish for stocks. The Composite Breadth Model is positive (since March 31st), yield spreads show no stress and upside participation remains strong. The only short-term negative is actually a long-term positive. The market is short-term overbought and ripe for a rest. However, keep in mind that the market became overbought because of strong buying pressure, which is bullish. Also note that timing a pullback within a bull market or long-term uptrend is difficult.
I am not seeing many setups right now. Some of the tech-related ETFs pulled back over the last few days, but not enough to form tradable patterns (flags, pennants, triangles). Many ETFs are simply in the middle of a move. The tradable setups formed, price broke out and price is currently extending higher. Time to wait for the next setup. In an interesting twist, we saw a move into the defensive end of the stock market over the past week. Perhaps money is preparing for a pullback in the broader market.
Programming Note: I ran into a problem with the signal tables on Tuesday and did not finish the update for the momentum-rotation strategy. I will post this update on Thursday (27 July).
Upside Participation Continues to Improve
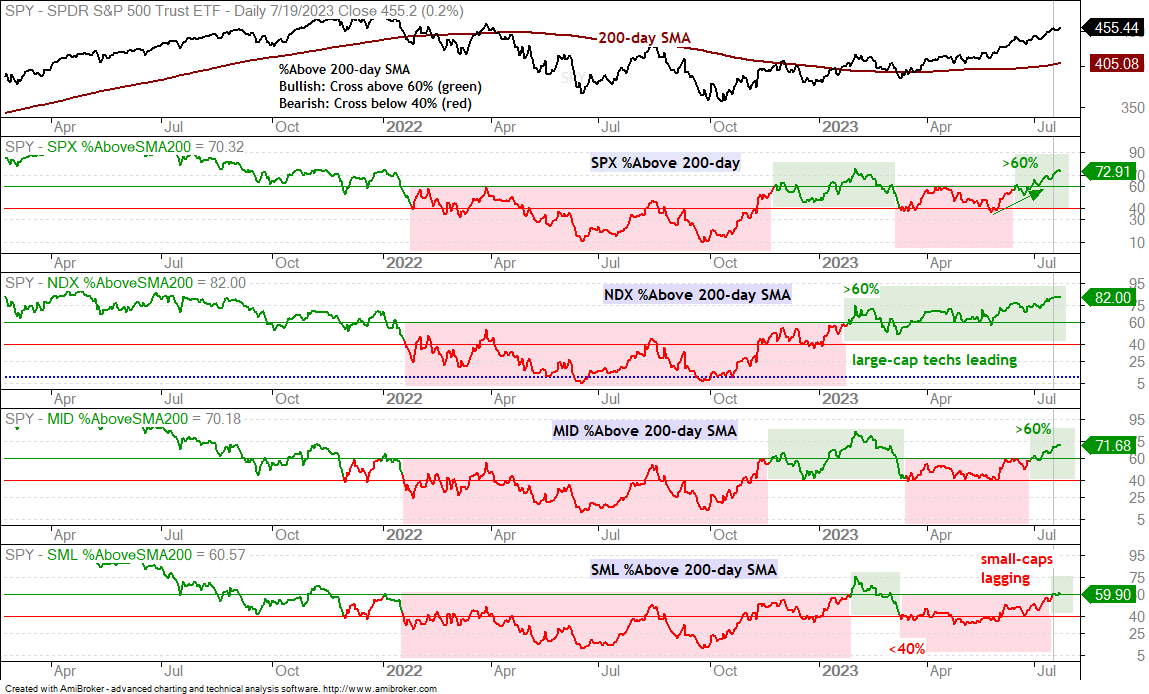
The %Above 200-day SMA indicators are long-term oriented and show broad strength. They have been moving higher since June. The chart below shows the percentage of stocks above the 200-day SMA for the S&P 500, Nasdaq 100, S&P MidCap 400 and S&P SmallCap 600. Nasdaq 100 stocks continue to lead with 82% above their 200-day SMAs. Large-caps (72.91%) and mid-caps (71.68%) are also strong as both exceeded 70% for the first time since early February. Small-caps are also improving as SML %Above 200-day SMA exceeded 60% on July 19th. Small-caps, however, are still the laggards relative to the others.
AD Percent Indicator Becomes Overbought
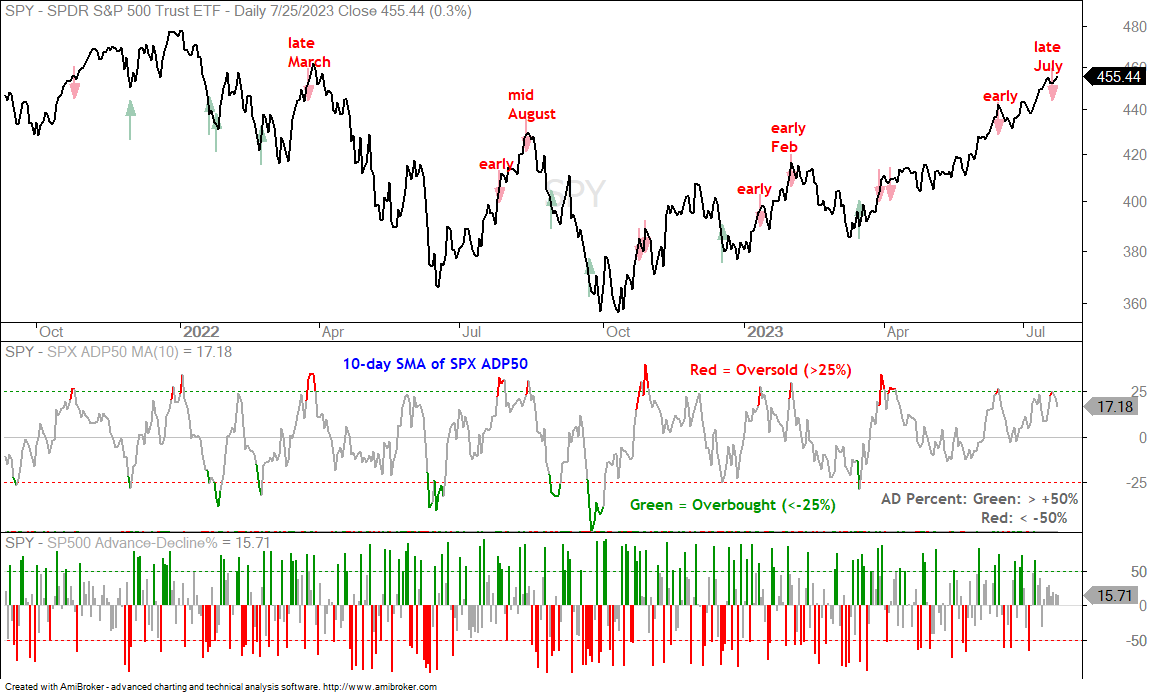
The indicator window below shows the 10-day SMA of Advance-Decline Percent 50 for the S&P 500. This is a short-term timing indicator designed to foreshadow swings. AD Percent is the percentage of advances less the percentage of declines (lower window). This is for the S&P 500. Instead of using every AD Percent value, it only uses values above 50% (green bars) and below -50%(red bars). In other words, it ignores values between 49% and -49%. This means it only counts days with significant moves. AD Percent of +60% means 80% advances and 20% declines (80 – 20 = 60). AD Percent of -70% means 15% advances and 85% declines (15 – 85 = -70). The indicator (middle window) becomes oversold below -25% (green arrows) and overbought above 25% (red arrows).
The overbought and oversold setups are shown on the price chart. Note that I have not backtested this indicator. It managed to foreshadow some peaks in late March, mid August and early February. It was early (wrong) in late July, mid January and mid June. It became overbought twice in April and this foreshadowed a consolidation into May. The indicator became overbought in late July and this could foreshadow some sort of correction in the coming days or weeks. This could be a short pullback, a consolidation or a modest pullback.
SPY Extends on Flag Breakout
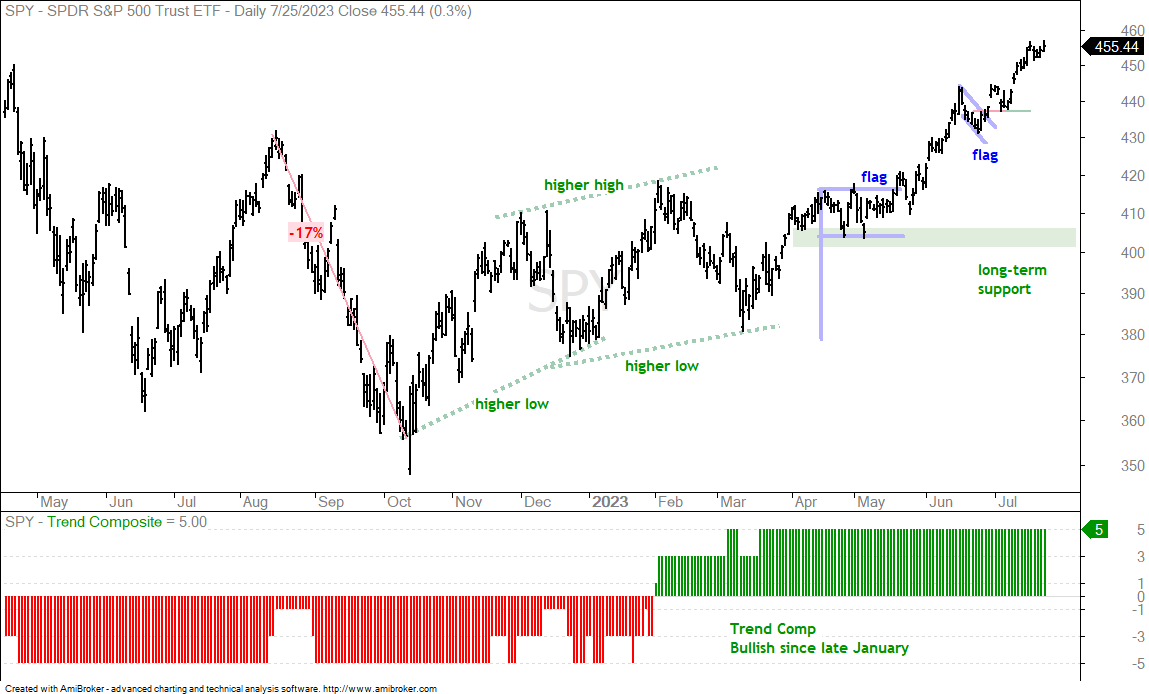
There is no change on the SPY chart. The long-term and short-term trends are up. Short-term, SPY broke out of a falling flag on June 29th and extended higher into July. The ETF is up around 6% since the low on June 26th. There is no setup on this chart. SPY is simply in the middle of a move.
Another Short Pullback for QQQ
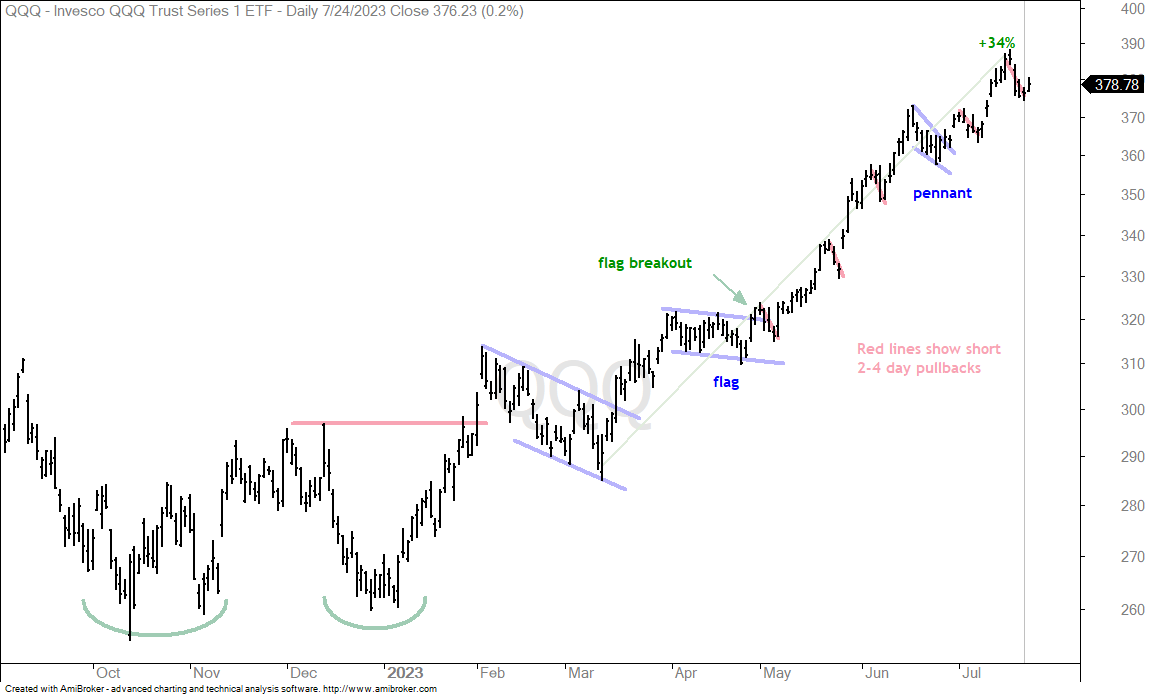
QQQ hit a new high near 390 last week and pulled back rather sharply on July 20th (last Thursday). This is the fifth 2-4 day pullback since the current leg higher started (April 25th). There is also a pennant, which formed over six days. Overall, QQQ advanced 34% from April 25th to July 18th and these 2-6 day pullbacks were the only setups during this advance. Technically, the current pullback is a mean-reversion setup because it is a pullback within the bigger uptrend. A close below 376 would negate this setup.
Defensive Groups Catch a Bid (XLV, XLU, XLP, PBJ)
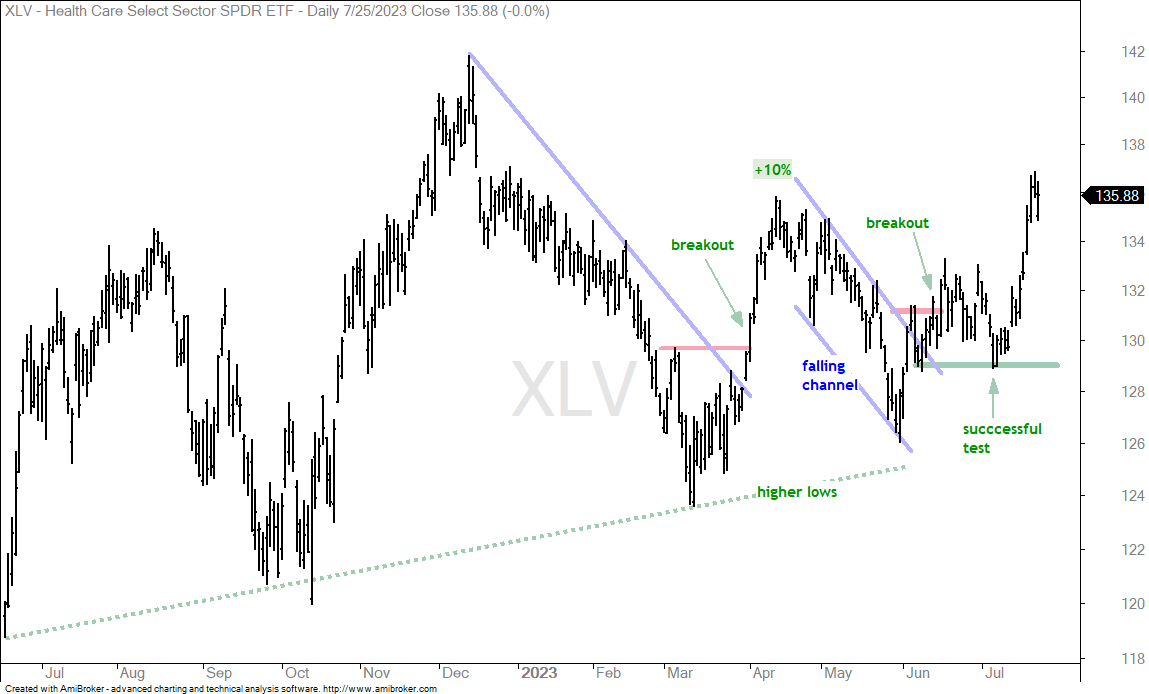
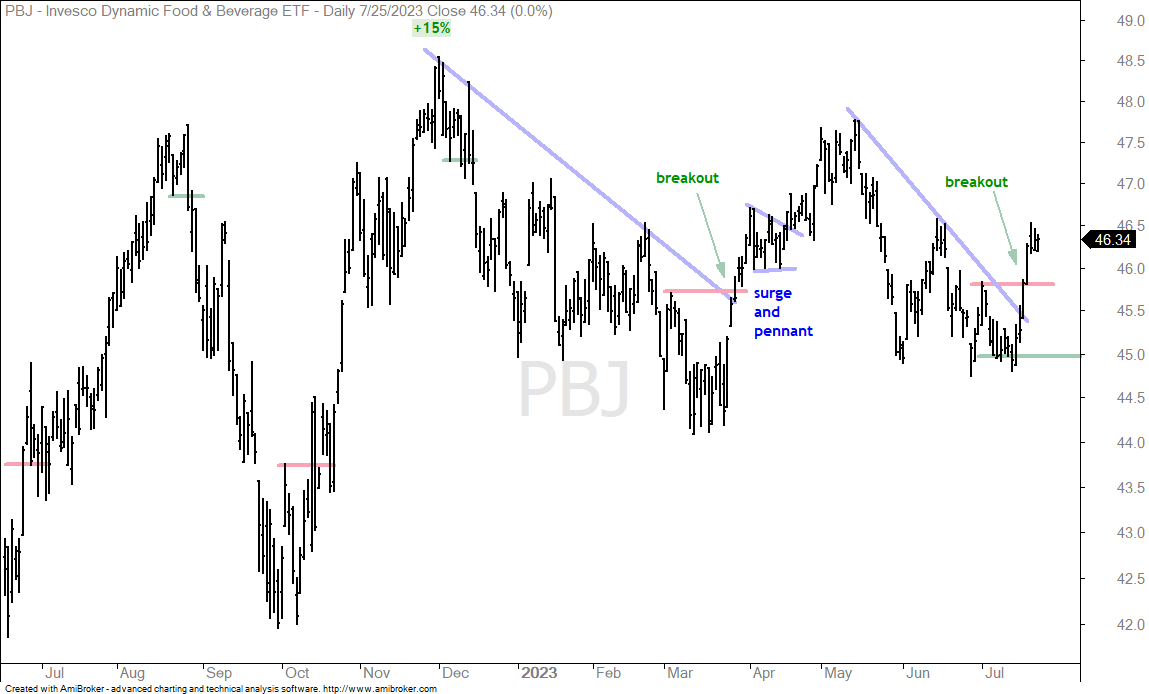
The Healthcare SPDR (XLV), Utilities SPDR (XLU) and Consumer Staples SPDR (XLP) represent the defensive end of the stock market. This is where money goes for higher yields and relative stability. No matter what, we always need are medicine, electricity and groceries. These groups were lagging from early May to mid July, but came to life the last two weeks with short-term breakouts. The first chart shows XLV with a breakout in mid June, a successful test in mid July and a surge above 135 the last two weeks.
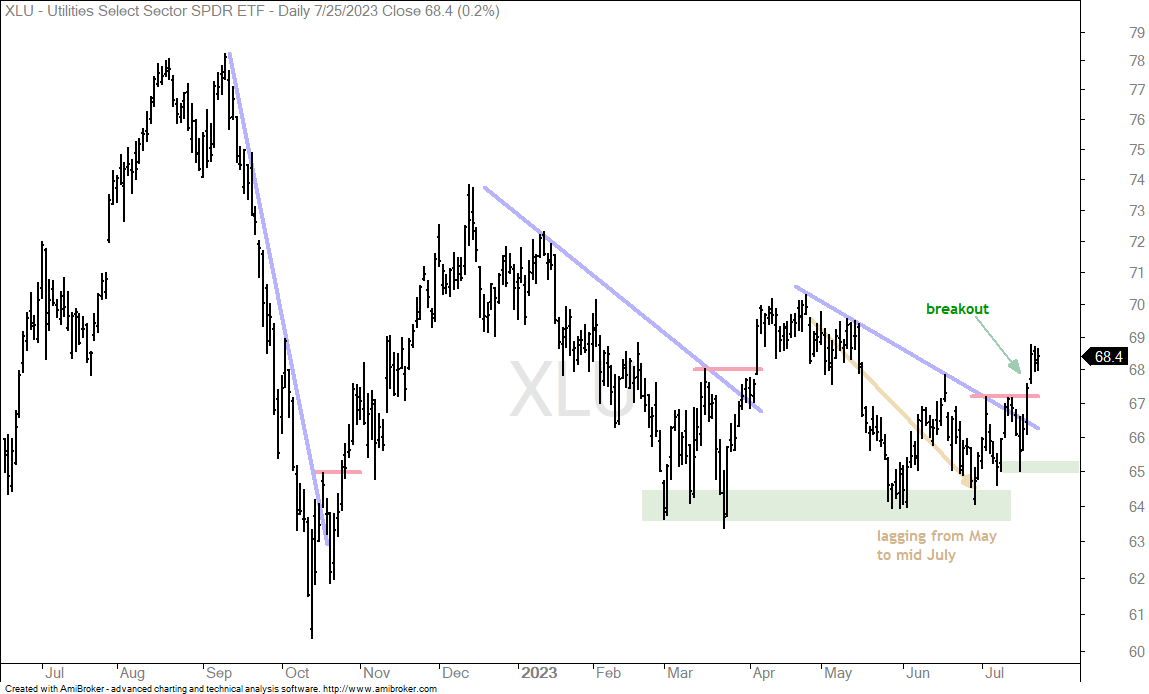
The next chart shows the Utilities SPDR (XLU) finding support in the mid 60s from February to June and breaking out with a surge in late July. There is not much trend on this chart, just some price swings. The swing was down from May to mid July as XLU underperformed. XLU reversed its downswing with a breakout and I am marking support at 65.
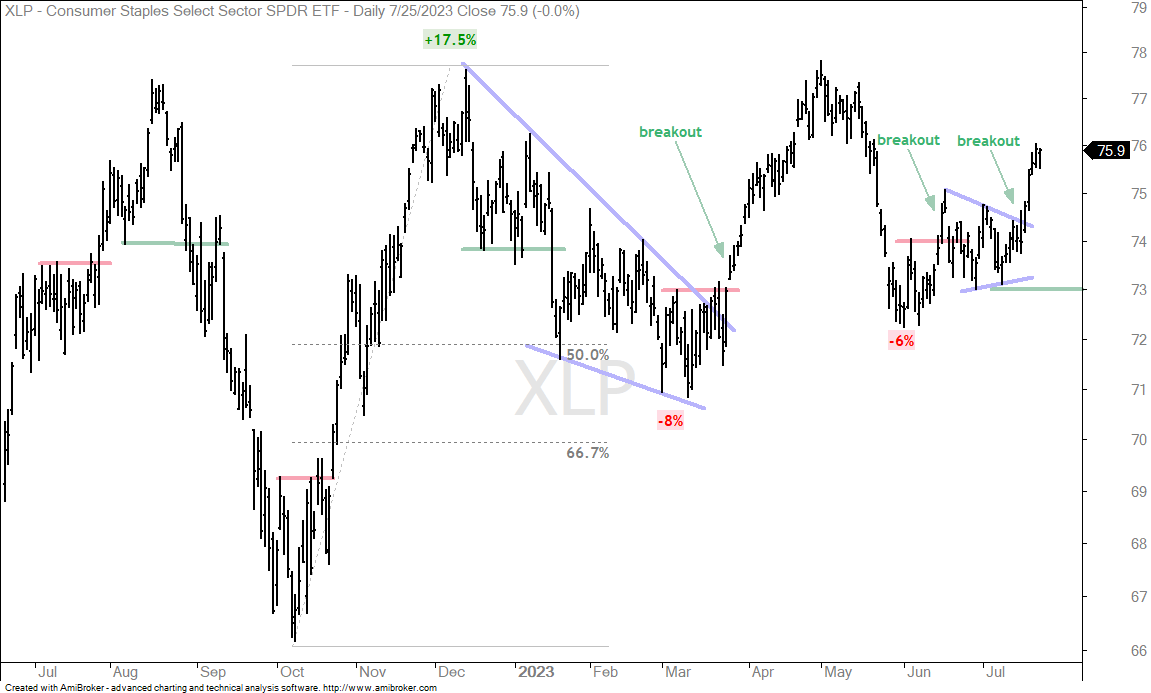
The next chart shows the Consumer Staples SPDR (XLP) with two breakouts in as many months. First, XLP broke short-term resistance with a surge above 74 in mid June. Second, the ETF consolidated into July and broke out with a surge the last two weeks. As with XLV and XLU above, there is no long-term trend on these charts, just price swings. The swing is up for XLP and I will mark initial support at 73.
The next chart shows the Food & Beverage ETF (PBJ) with a surge and breakout as well.
Medical Equipment ETF Pulls Back from Resistance (XHE)
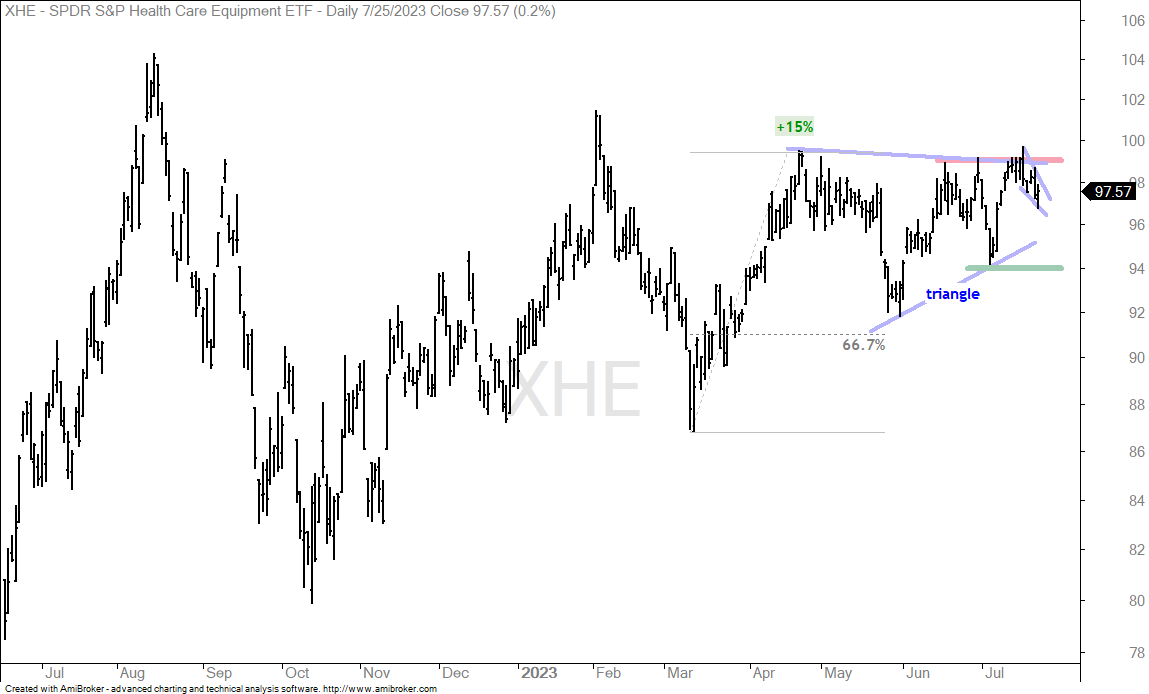
I am still watching the Medical Equipment ETF (XHE) as it consolidates after a 15% advance. A consolidation after an advance is a bullish continuation pattern and a break above the red resistance line would be bullish. Short-term, XHE surged to resistance and pulled back with a pennant. This is a short-term bullish continuation and a pennant break could lead to a bigger breakout.
Technology SPDR Reflects Situation in Tech-Related ETFs (XLK)
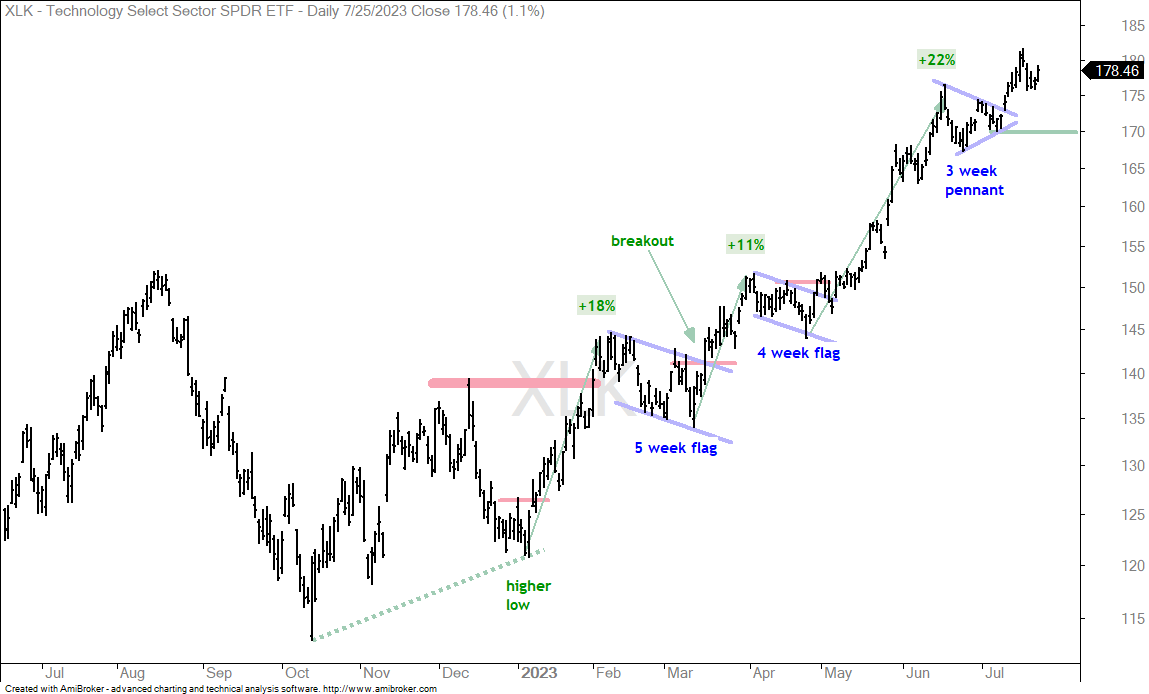
I am only showing the Technology SPDR (XLK) today because it sums up the situation for the sector. XLK is in a leading uptrend, but I do not see a setup on the chart right now. There are three big price swings since the early January low (+18%, +11% and +22%). XLK recently broke out of a pennant and is in the midst of the fourth price swing. After the pennant breakout surge, there was a 3 day pullback last week and a bounce the last two days. 2-4 day pullbacks have been the order of the day since May. This trend will end one day, but nobody knows when. For now, the pennant low before the breakout marks first support at 170. There charts for SOXX, IGV, SKYY and FDN are similar.
A Pennant in the Wind Energy ETF (FAN)
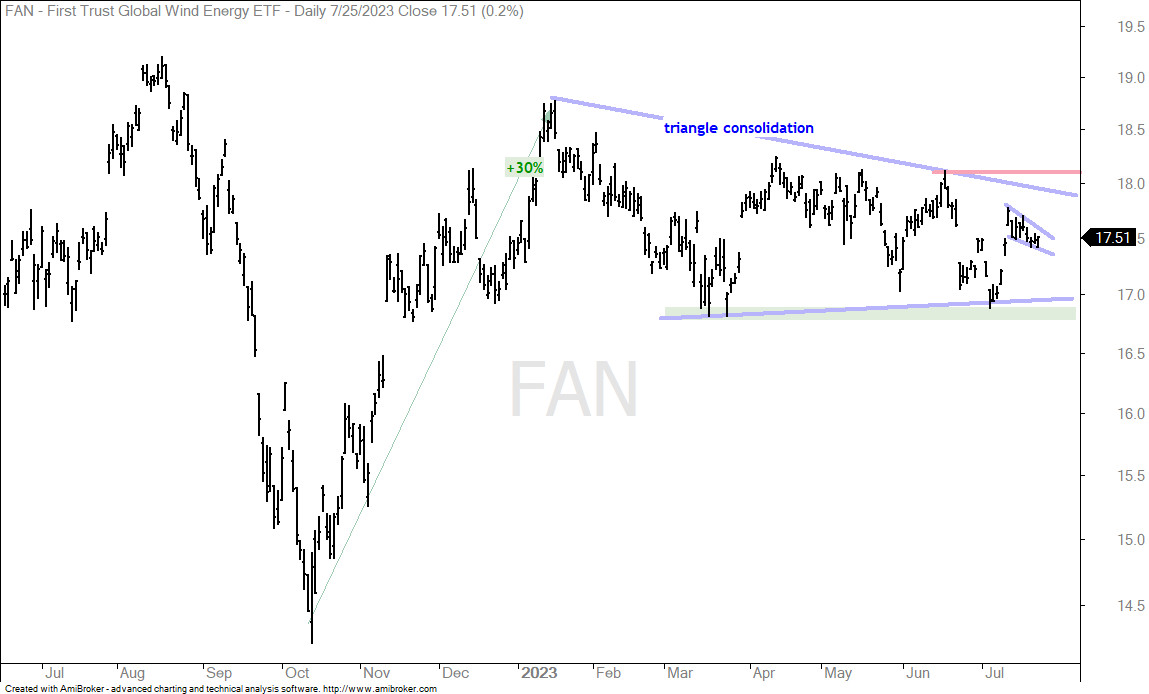
The Solar Energy ETF (TAN) sports a small bullish continuation pattern within a larger bullish continuation pattern. Traders can use the smaller pattern to anticipate a bigger breakout. First, TAN surged some 30% and then consolidated with a long triangle. A break above the June high would end this consolidation and signal a continuation higher. Second, the ETF surged in early July and pulled back with a pennant. A breakout at 17.7 would be short-term bullish and could lead to a bigger breakout.
Copper Miners ETF Surges within Trading Range (COPX)
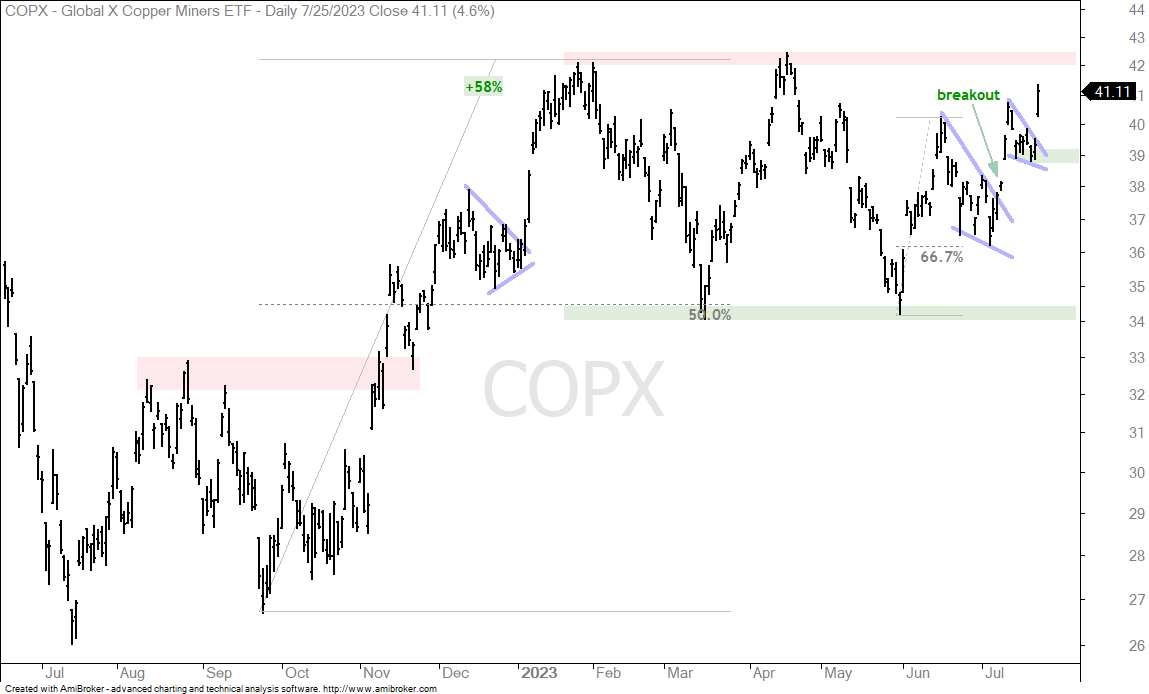
The Copper Miners ETF (COPX) is making a move towards range resistance. The chart shows COPX with a 58% advance and then a trading range since February. The ETF hit resistance in the 42 area twice and found support in the 34 area twice. The swing within this range is up with the falling wedge breakout in mid July. Short-term, COPX formed a smaller falling wedge (pennant) and broke out of this pattern with a surge on Tuesday.
DB Base Metals ETF Turns the Corner (DBB)
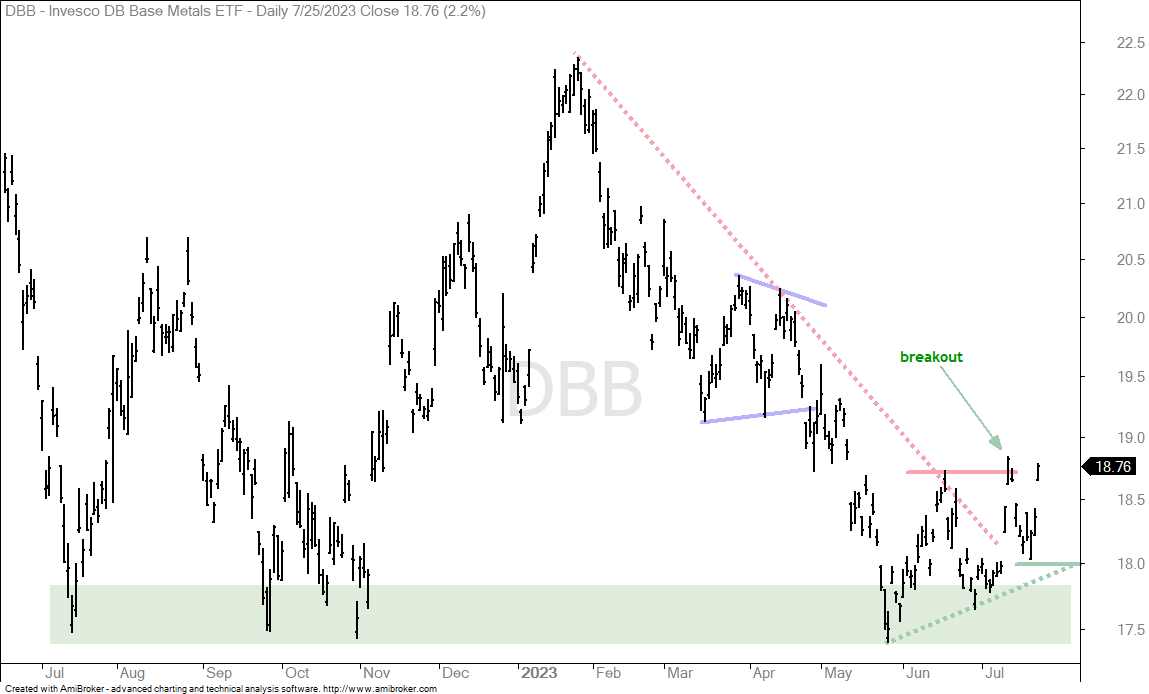
In a separate, but possibly related, development, the next chart shows the DB Base Metals ETF (DBB) turning the corner with a higher low and breakout the last few weeks. DBB fell sharply from February to May and then formed a higher low from May to June (green dashed line). The ETF also broke above the mid June high with a surge in mid July. Even though DBB fell back after this breakout, it held above the June low and surged the last two days. I see an uptrend emerging with support marked at 18.
Gold Miners ETF Throws Back to Breakout (GDX)
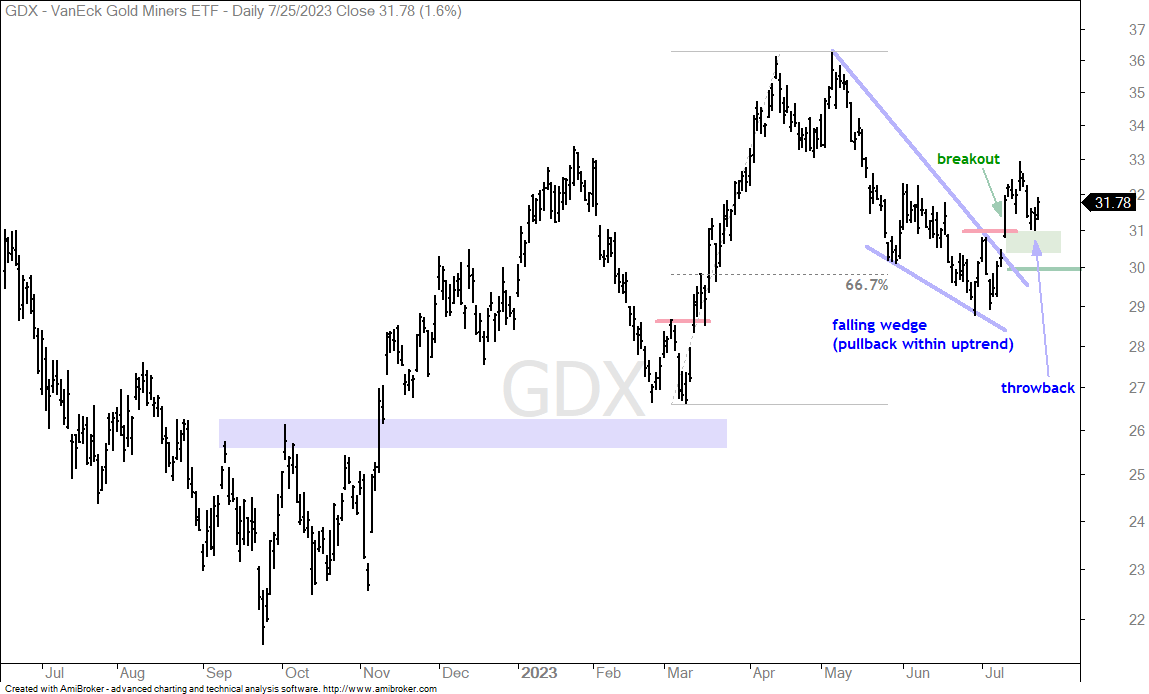
The next chart shows the Gold Miners ETF (GDX) with a wedge breakout and a throwback toward the breakout zone. First, the bigger trend is up and the wedge is viewed as a correction within this uptrend. Second, GDX broke wedge resistance with a surge above 31. The ETF was a bit extended after the move from 29 to 33 and fell back to the 31 area. This is near broken resistance and broken resistance turns into support. The decline back to broken resistance is called a throwback. GDX is showing signs of a successful throwback as it bounces off broken resistance. I will raise support to 30.
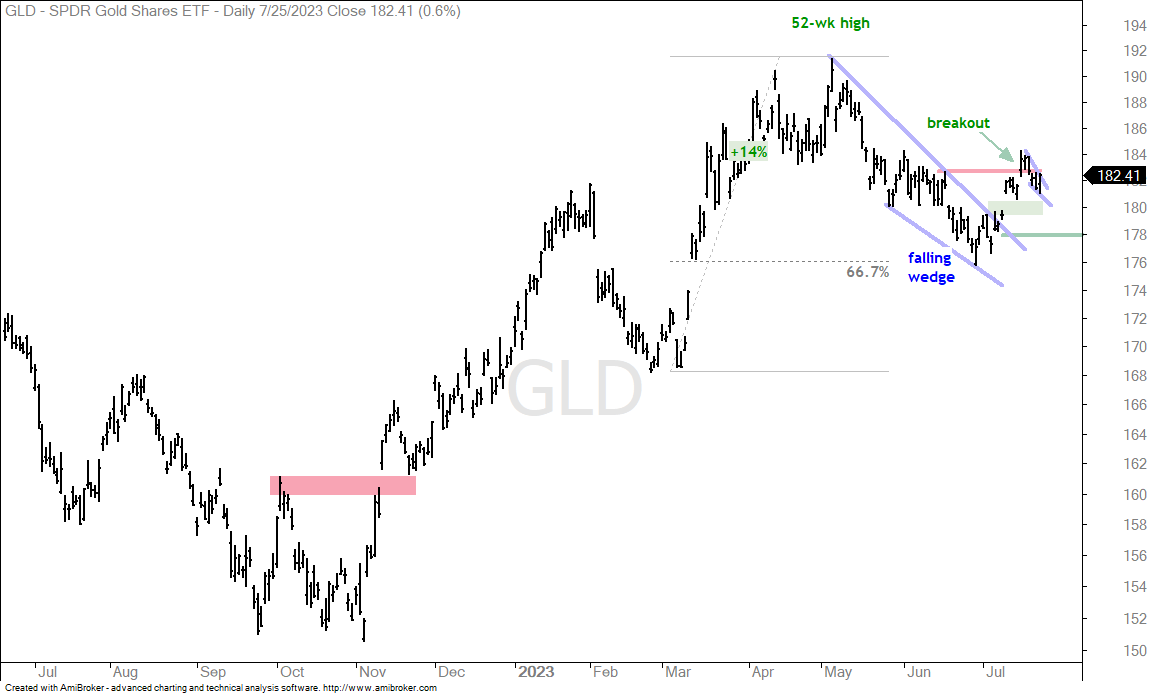
The Gold SPDR (GLD) chart looks similar to GDX. There is a wedge breakout with a surge above 183. GLD then fell back below the breakout level with a small falling pennant. This looks like a short-term bullish continuation pattern. Note that the Fed started its two-day meeting on Tuesday and will make its statement today at 2PM ET. We can expect some volatility in stocks, bond, the Dollar and gold around this time.