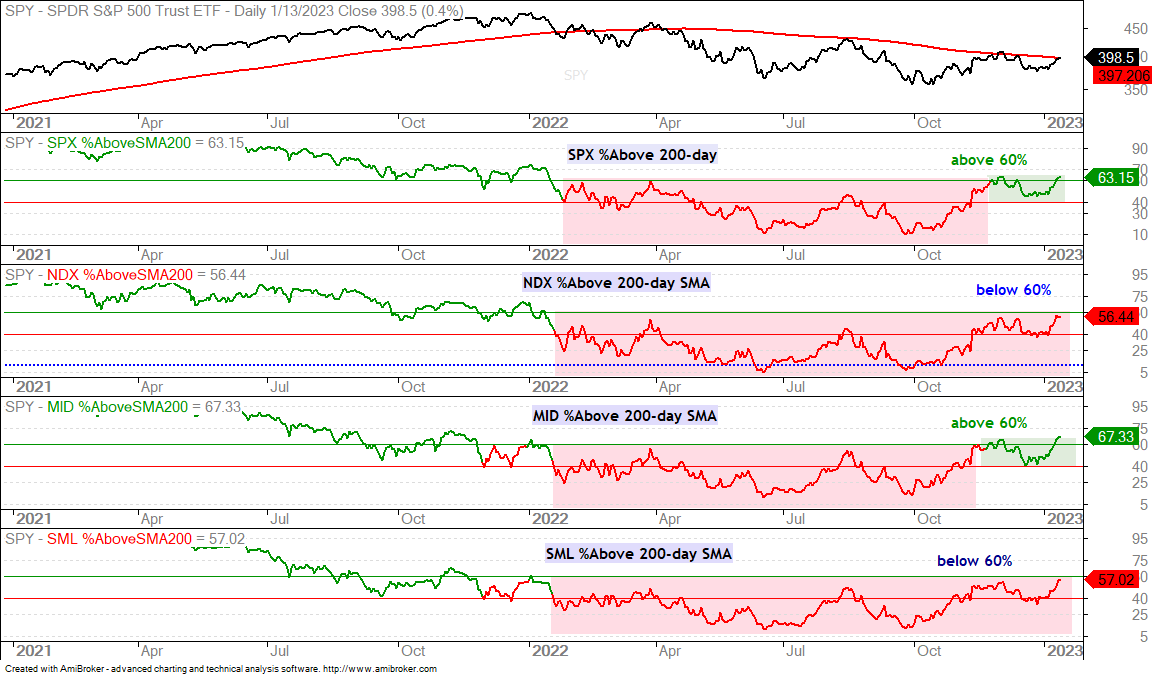
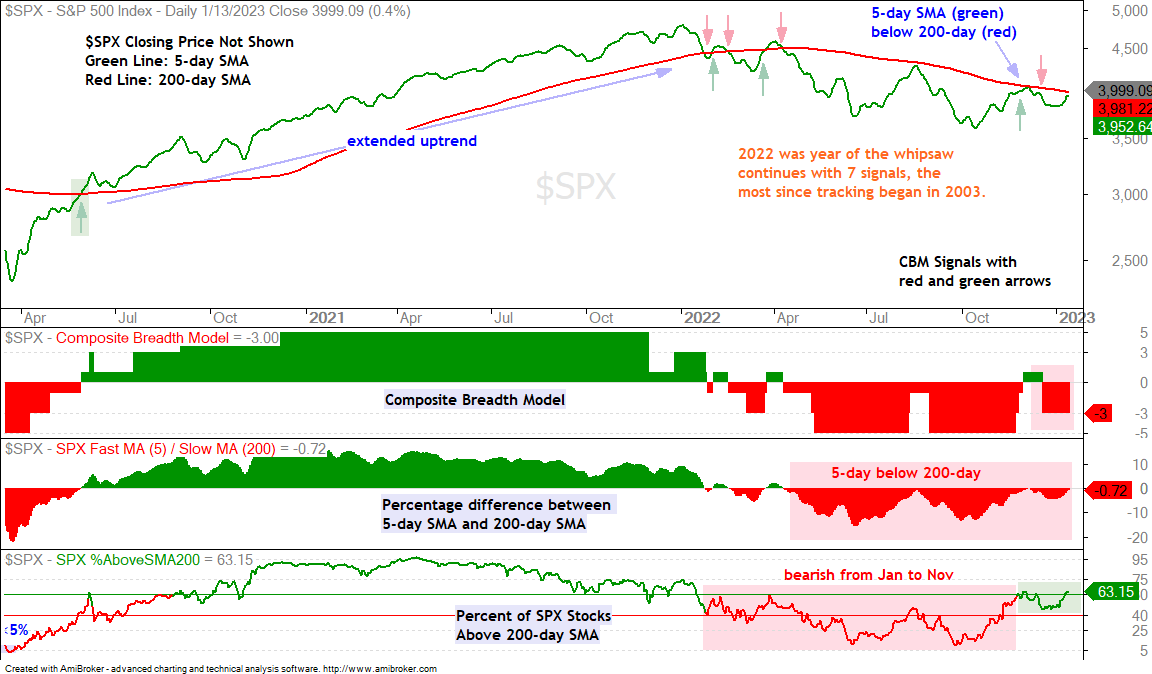
The stock market is quite mixed at the moment. The Composite Breadth Model is negative and the 5-day SMA for the S&P 500 is below the 200-day SMA. The percentage of stocks above the 200-day SMA indicators, however, are showing strength within the broader market because they are above 55%. SPY is nearing a moment of truth because it is still below a key high and has yet to forge a major breakout. We can say the same for TLT, SOXX and IWM. Further strength in the second half of January could put the bull market back in play. A follow through failure in the next week or two would keep the bear market in play.
About the ETF Trends, Patterns and Setups Report
This report contains discretionary chart analysis based on my interpretation of the price charts. This is different from the fully systematic approach in the Trend Composite strategy series. In this ETF Trends, Patterns and Setups report, I am looking for leading uptrends and tradable setups within these uptrends. While I use indicators to help define the trend and identify oversold conditions within uptrends, the assessments are mostly based on price action and the price chart (higher highs, higher lows, patterns in play). Sometimes the chart assessment can be at odds with the indicators.
Report Schedule
Tuesday – 17 Jan: Market/ETF Report and Signal/Rank Table Update
Wednesday – 18 Jan: Market/ETF Video and Signal/Rank Table Update
Thursday – 19-Jan: Part 2 of Mean-Reversion Strategy and Signal/Rank Table
Friday – Coppock Curve for Long-term Market Timing
Going More Systematic
As the schedule above shows, I will publish part 2 of the mean-reversion strategy for trading ETFs on Thursday. This continues the move towards a more systematic approach to trading and investing. The goal is to have three ETF strategies in place in the coming months. Strategy diversification is the closest thing to free lunch.
Market Regime is Bearish for Stocks
The Composite Breadth Model turned negative on December 19th and remains at -3, which means four inputs are bearish (-4) and one is bullish (+1). The 5-day SMA for the S&P 500 is below the falling 200-day SMA and this bearish cross has been active since April 11th. Despite a bearish CBM and 5/200 cross, 63% of S&P 500 stocks and 67% of S&P MidCap 400 stocks are above their 200-day SMAs. These internal measures show strength within the market and suggest more of a split market than a bear market.
The Composite Breadth Model sets the tone for stocks and stock-based ETFs. A negative CBM means we are in a bear market environment and risk is above average for stocks and stock-based ETFs. Some stocks might buck the bear market, but it is difficult to pick winners and the risk of loss is above average. This is a time to preserve capital and wait for the next bull market.
SPY Remains with Lower Highs and Wedge Break
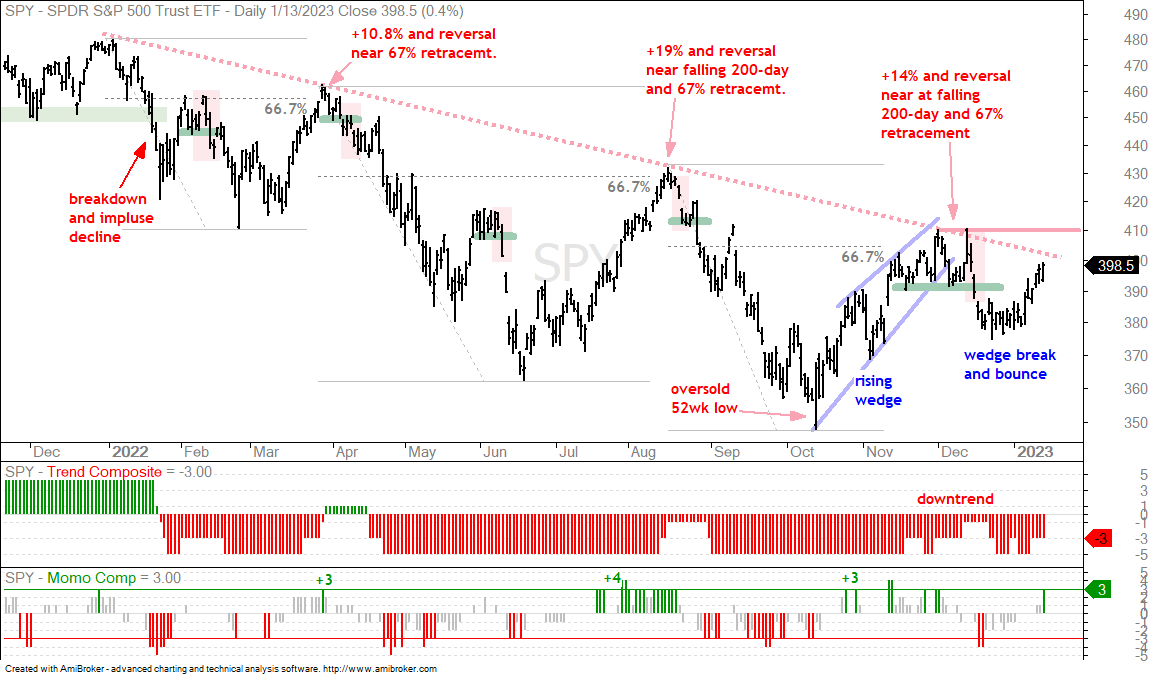
The S&P 500 SPDR (SPY) remains in a long-term downtrend, but the swings are big, both up and down. Using intraday highs and lows, there were six swings of 10% or more in 2022 (three down and three up). 2011 was the last time there were six 10% swings in one year. Prior to that, there were 13 double digit swings in 2008. Despite three big upswings in 2022, the downswings were still stronger and we have yet to see an upswing break the prior high. The October-December upswing did not break the August high. At this point, a break above the December high at 410 would forge the first higher high and argue for a long-term trend reversal.
Shorter-term, SPY broke rising wedge support with a sharp decline in mid December and this is still the dominant chart feature. SPY firmed around 380 in the second half of December and surged towards 400 here in January. The sequence here is a wedge breakdown and bounce. The negative Composite Breadth Model, long-term downtrend in SPY and wedge breakdown are still lurking in the shadows. These bearish events suggest that the bounce will ultimately fail. But when?
SPY Becomes Overbought
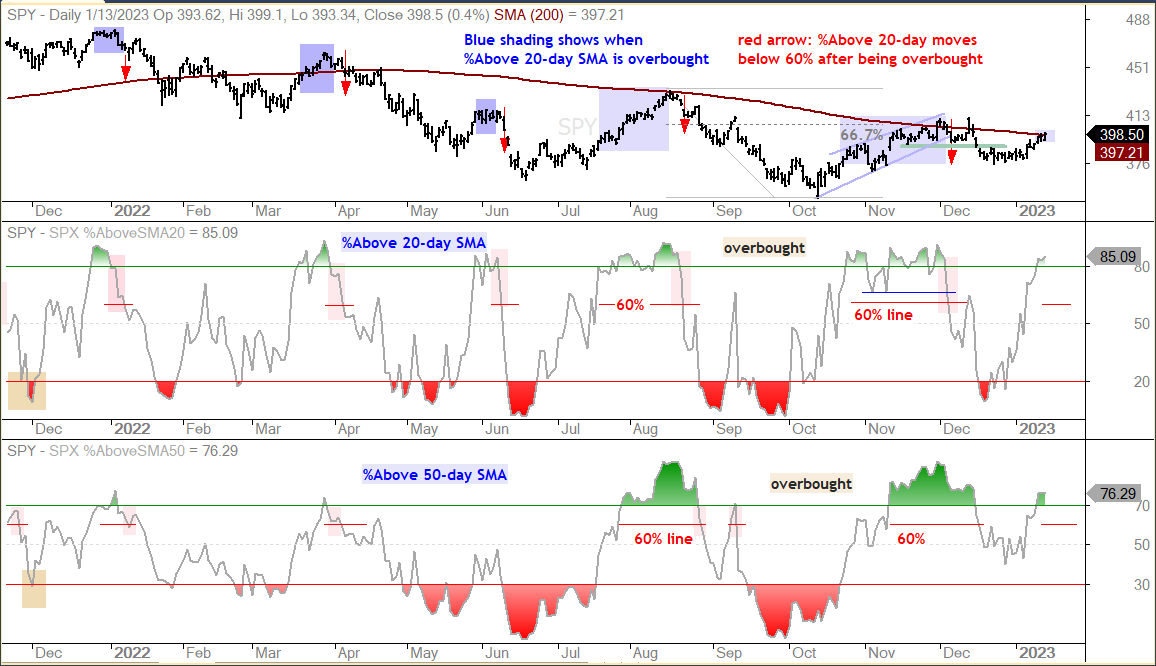
The next chart shows SPY with SPX %Above 20-day SMA in the middle window and SPX %Above 50-day SMA in the lower window. %Above 20-day moved above 80% to become overbought last Wednesday (11 January). This indicator is both overbought and bullish as long as it holds above 60%. This is because indicators can become overbought and remain overbought when trends, even short-term trends, extend. Most recently, %Above 20-day exceeded 80% on October 25th and did not move below 60% until December 6th.
The blue shading on the price chart shows when %Above 20-day SMA moved above 80% and remained above 60%. The red arrows show the subsequent moves below 60%. I will also watch SPX %Above 50-day SMA for a move below 60%. I consider this indicator to be overbought when it moves above 70%, which it did last week.
There were several short-term breakouts in stock-based ETFs here in January. These breakouts have the short-term market trend on their side as long as %Above 20-day SMA holds above 60%. A short-term bearish reversal in SPY would negatively weigh on stock-based ETFs.
Small-caps Catch Fire as QQQ Plays Catch-Up
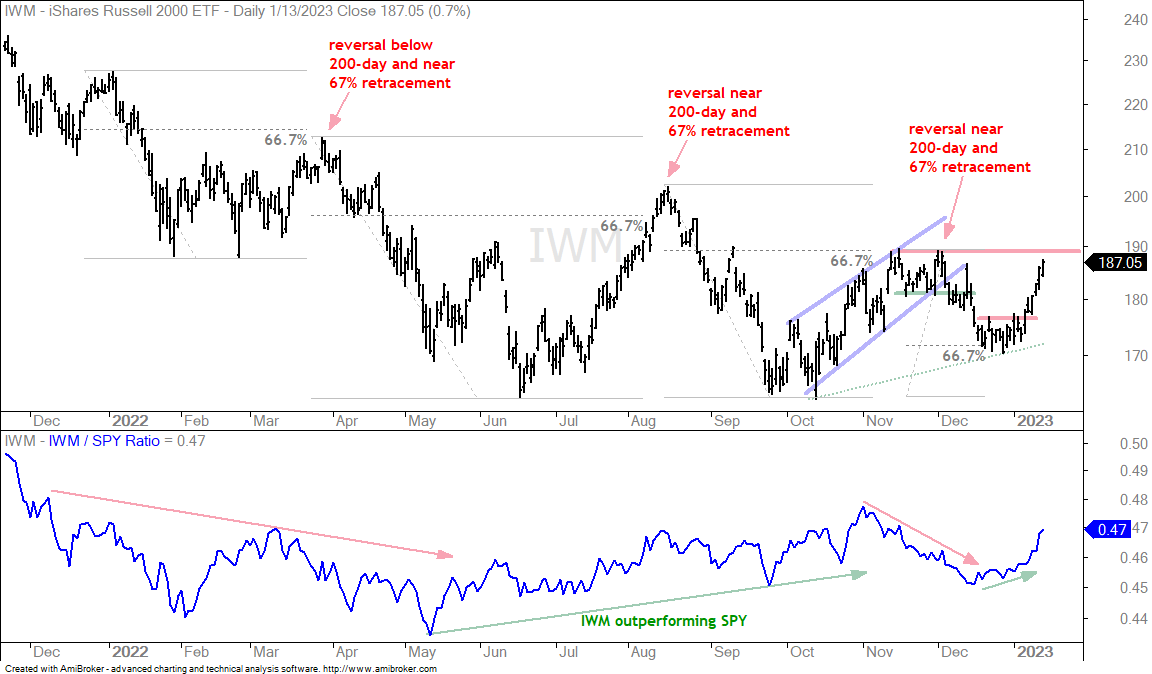
The Russell 2000 ETF (IWM) is leading the charge with a higher low from October to December and a surge towards the November-December highs (red line at 190). A breakout here would forge a higher high to go with the higher low (uptrend). Short-term, IWM firmed near the 67% retracement around 170 in late December and broke short-term resistance in early January.
The indicator window shows the price-relative (IWM:SPY ratio). IWM underperformed from November to mid December (red arrow) and then started outperforming in December (green arrow). This ratio surged in January as IWM seriously outperformed SPY. Keep in mind that there is a flipside to relative performance: SPY is underperforming IWM. SPY is the dog and IWM is the tail when it comes to bull and bear markets. I do not think the tail wags the dog and would be more concerned with relative weakness in SPY.
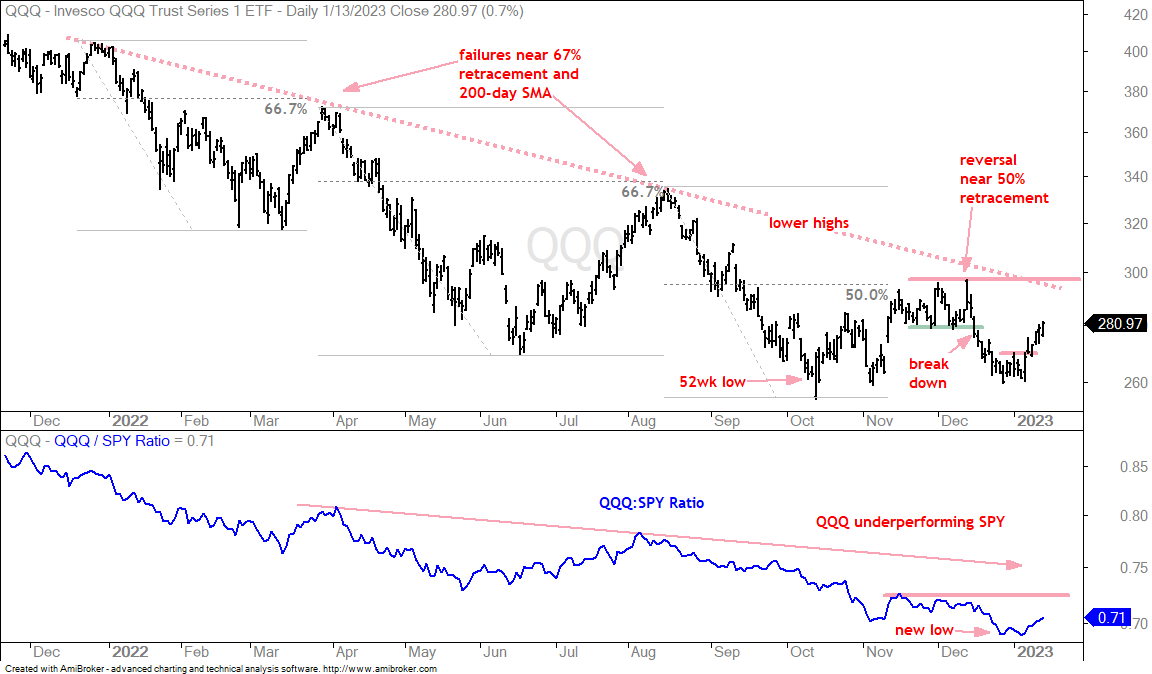
The next chart shows QQQ with a short-term breakout last week. The long-term trend remains down and QQQ is still lagging SPY. As with SPY and IWM, the November-December highs mark key resistance and a breakout here would reverse the long-term downtrend.
TLT Continues to Underperform SPY (plus $TNX)
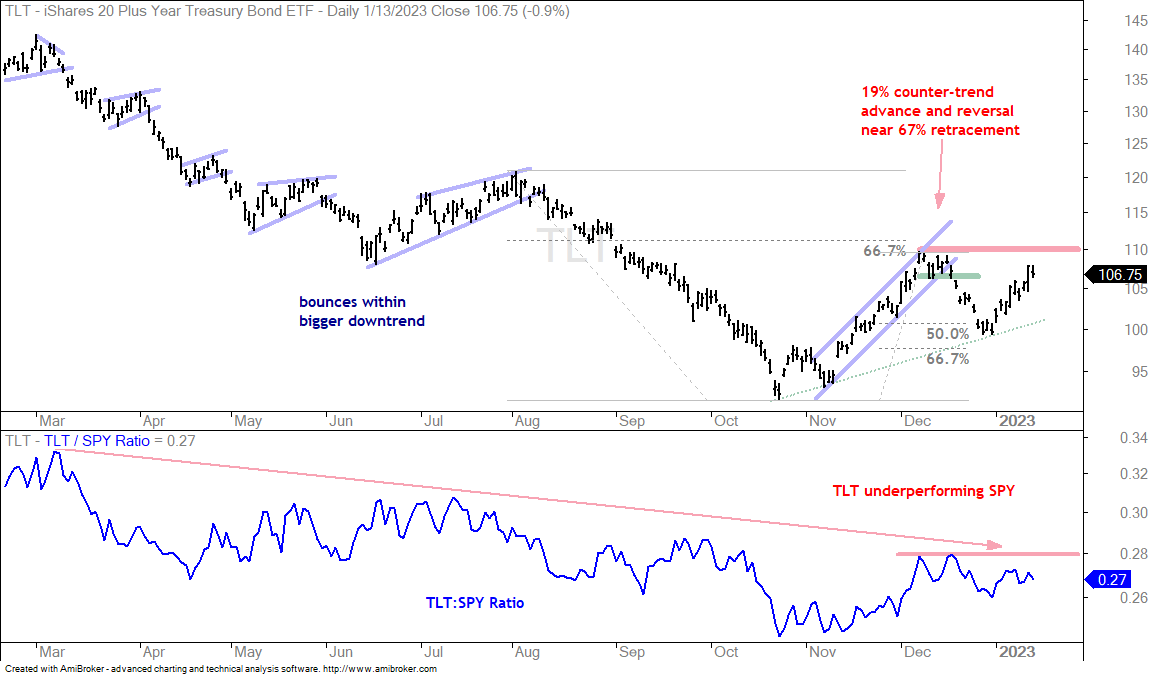
The 20+ Yr Treasury Bond ETF (TLT) chart is like the charts for several stock-based ETFs. There is the October-December surge, the mid December breakdown and the January surge. TLT firmed and reversed in the 50-67% retracement zone in late December. It also has a higher low from October to December (green dashed line). A break above 110 would forge a higher high and reverse the long-term downtrend. The indicator window shows the price-relative in a long-term downtrend as TLT continues to underperform SPY. Thus, bonds are not an alternative to stocks right now.
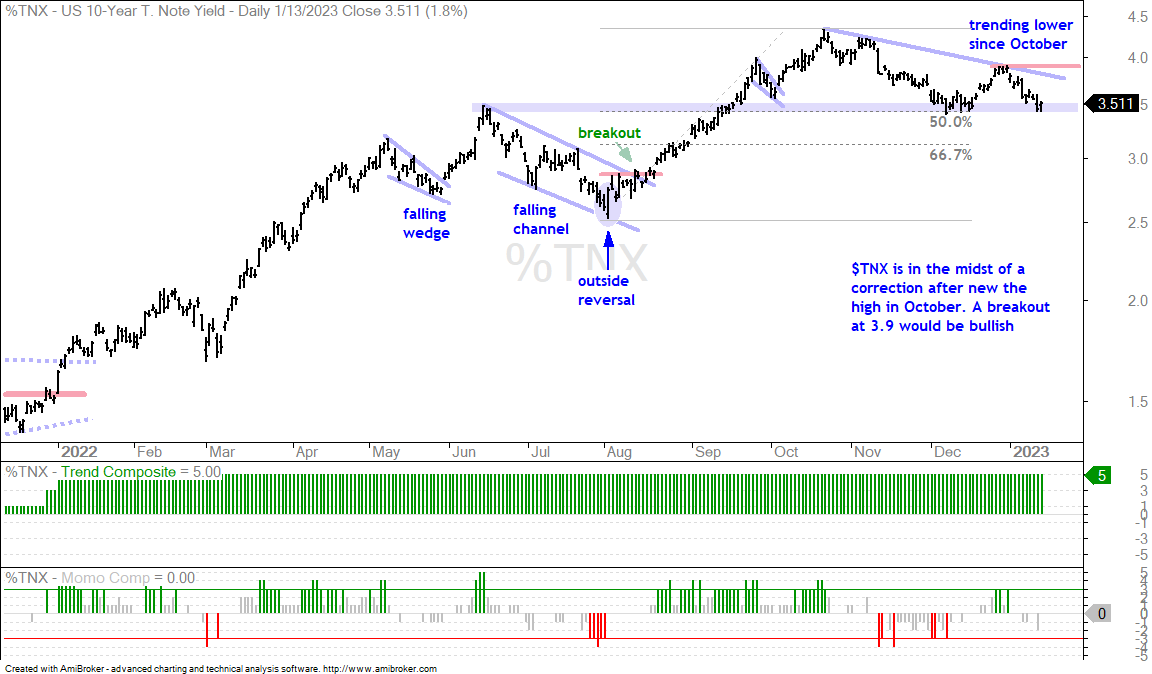
The next chart shows the 10-yr Treasury Yield in a downtrend since October. This downtrend could be a correction after a big advance from August to October. The decline so far retraced around half of this advance and there is support in the 3.5 area (blue shading). This is an area to watch for a bounce. A follow through breakout at 3.9 would reverse the downtrend.
Gold Going Parabolic as Dollar Sinks (GLD, UUP)
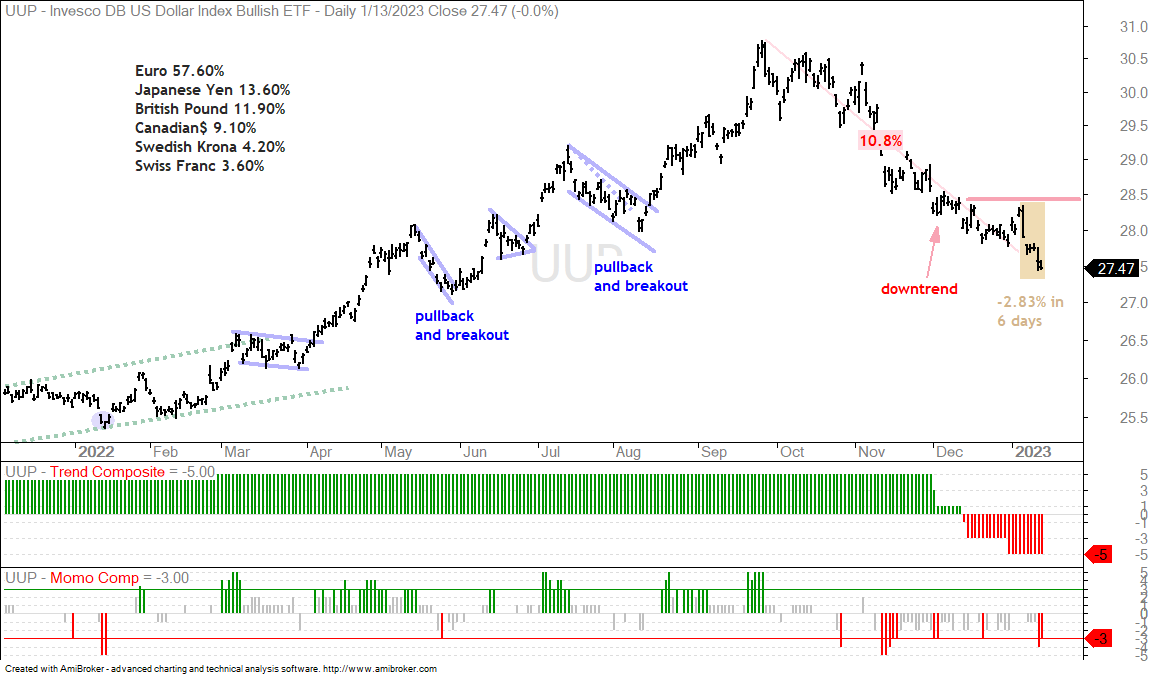
The Dollar Bullish ETF (UUP) continued sharply lower with a 2.83% decline the last six days. The downtrend started in late December and we are now seeing an acceleration downward. Sometimes a downside acceleration marks the beginning of the end for the downtrend. UUP is down 10.8% since late September and getting quite extended on the downside.
The Trend Composite aggregates signals in five trend indicators: Bollinger Bands (125,1), Keltner Channels (125,2), 5-day Rate-of-Change of 125-day SMA, StochClose (125,5) and CCI-Close (125). The Trend Composite and ten other indicators are part of the TIP Indicator Edge Plugin for StockCharts ACP
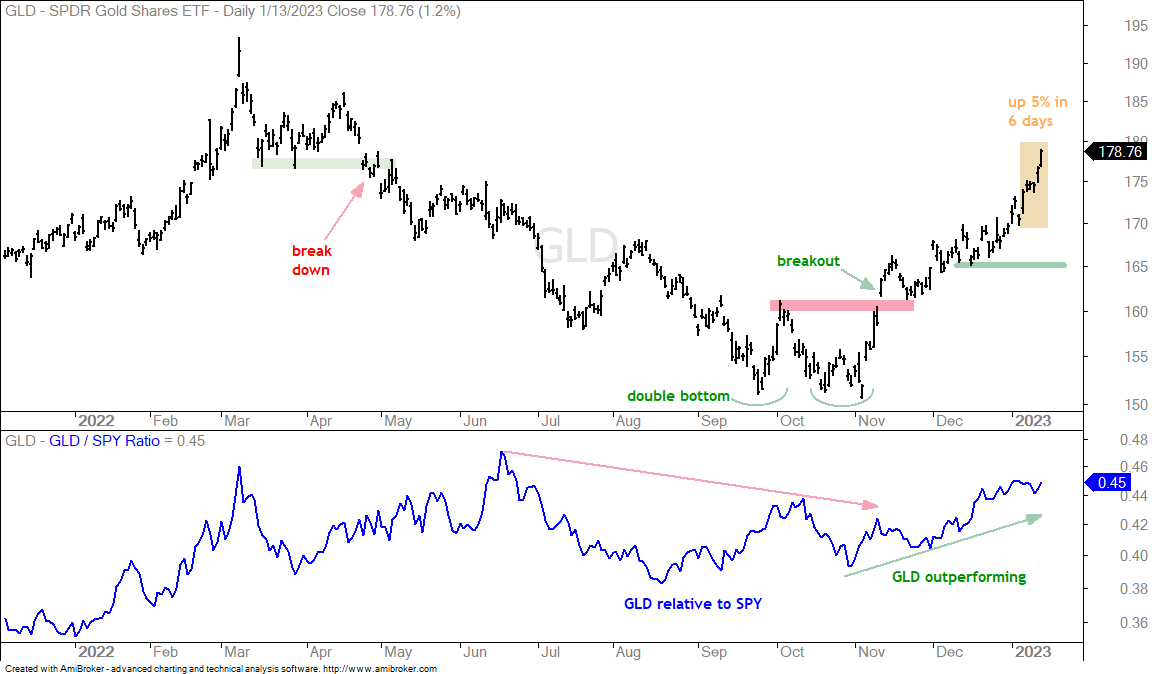
The Gold SPDR (GLD) remains in a strong uptrend, which started with the early November low (10 weeks ago). GLD broke out in mid November and then worked its way higher into early January. The advance sped up in January and steepened significantly the last six days as GLD gained 5%. This is the opposite of UUP. The trend is up, but this sharp acceleration higher could signal the beginning of the end for this advance. At the very least, GLD is getting extended and ripe for a pullback or consolidation
Silver and Platinum Hold above Support (SLV, PLTM)
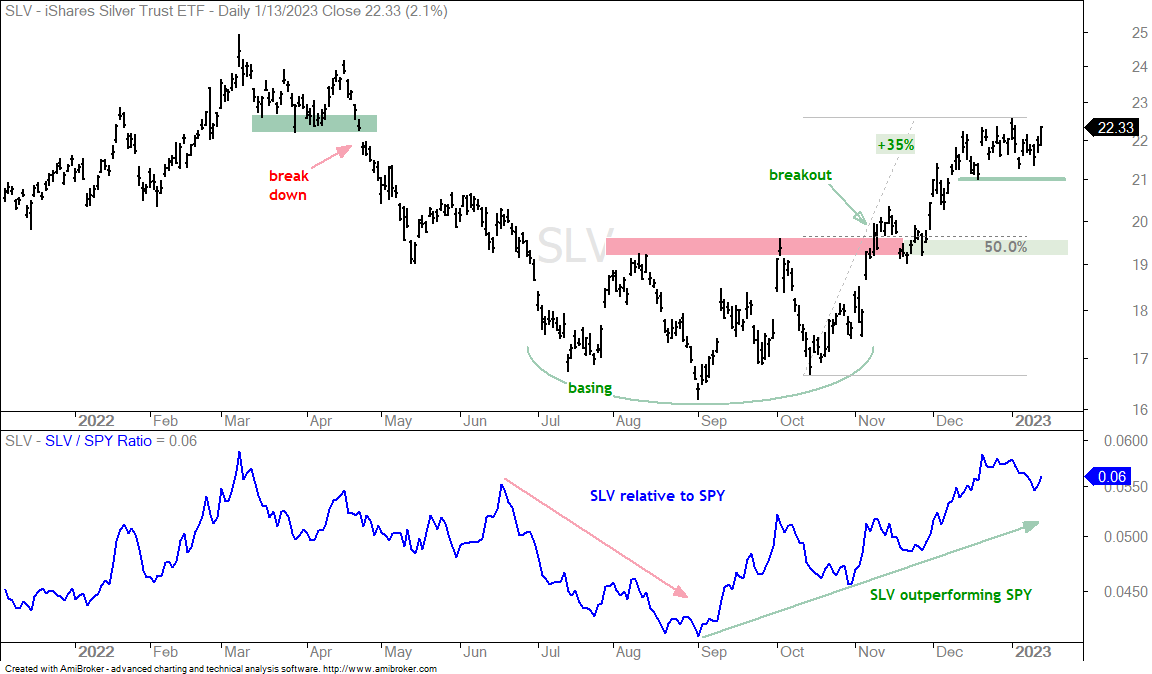
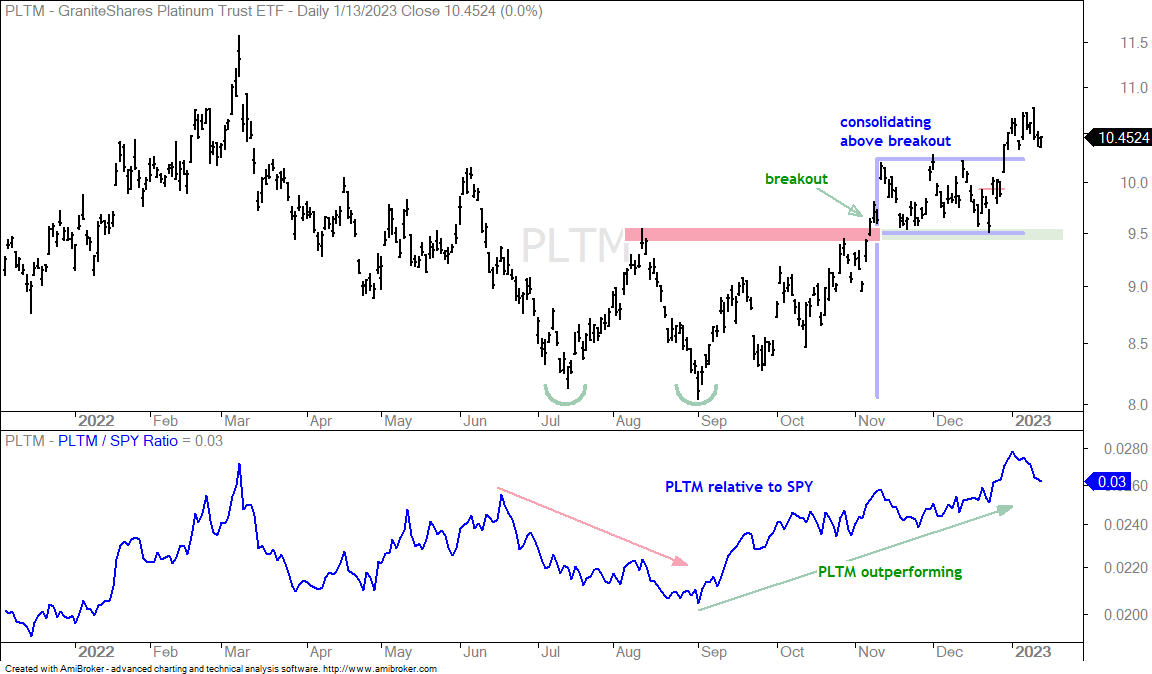
The Silver ETF (SLV) and Platinum ETF (PLTM) are still in uptrends, but lagging gold the last six days. The first chart shows SLV with a basing process, a breakout in November and further gains into late December. SLV is pretty much flat in January, but holding above short-term support at 21. A break here would argue for a pullback that could retrace half of the prior advance and return to the breakout zone (19.5).
The next chart shows PLTM with a November breakout, a flag into December and a flag breakout on December 29th. This breakout is holding and bullish. The flag lows mark key support in the 9.50 area.
Copper Leads DB Base Metals ETF Higher (CPER, DBB)
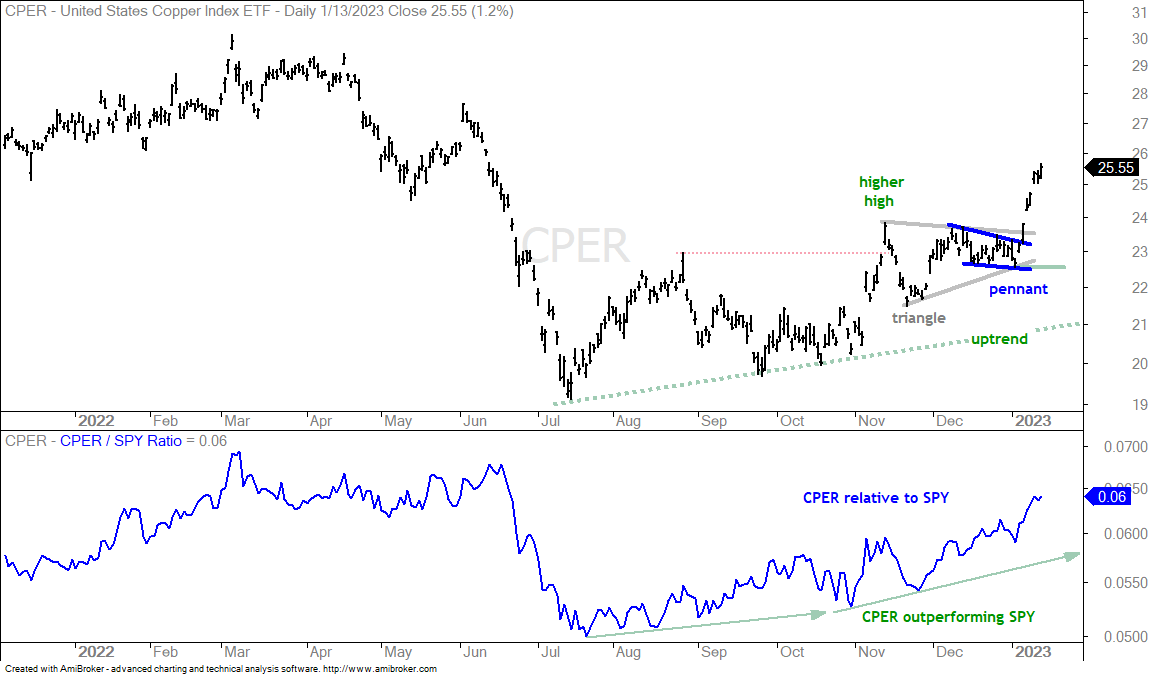
The Copper ETF (CPER) caught fire in January with a double digit surge the last seven days. This move triggered a pennant breakout (blue lines) and a triangle breakout (gray lines). It also extended the uptrend that started with the higher high in mid November. Short-term, CPER is getting quite extended and ripe for a rest.
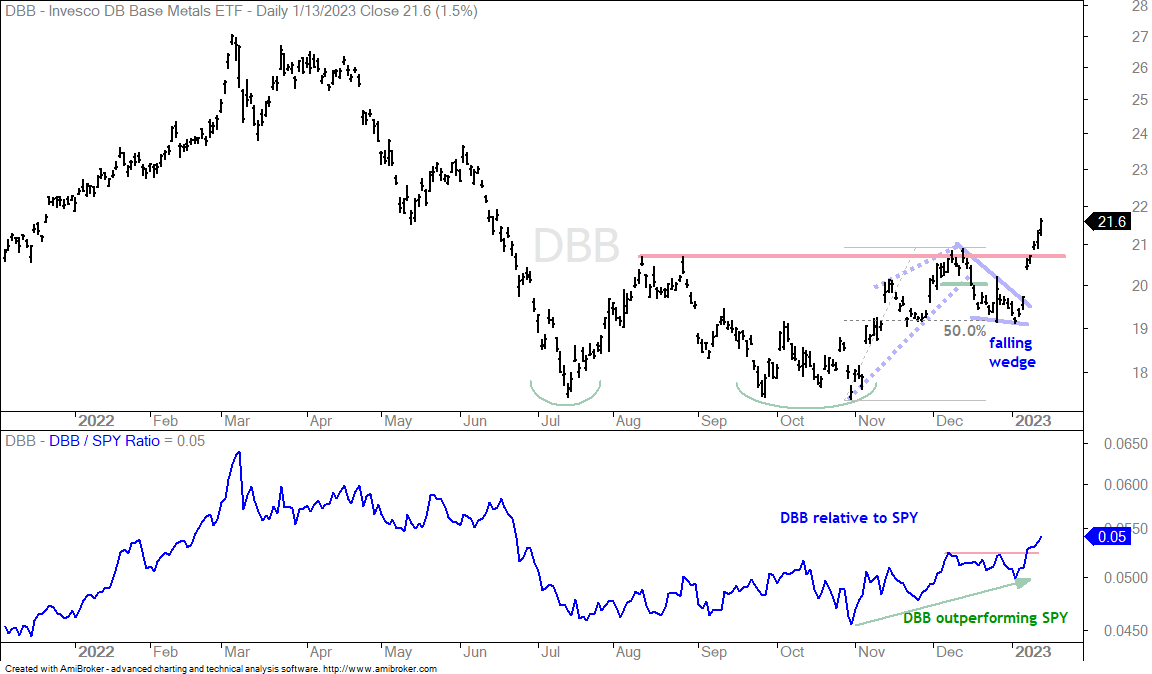
The next chart shows the DB Base Metals ETF (DBB) breaking above the red resistance level with a double digit surge the last seven days. Short-term, DBB pulled back with a falling wedge and broke out of this wedge in early January. As with copper, DBB is short-term extended and ripe for a rest.
Palladium Does not Follow Metals Higher (PALL)
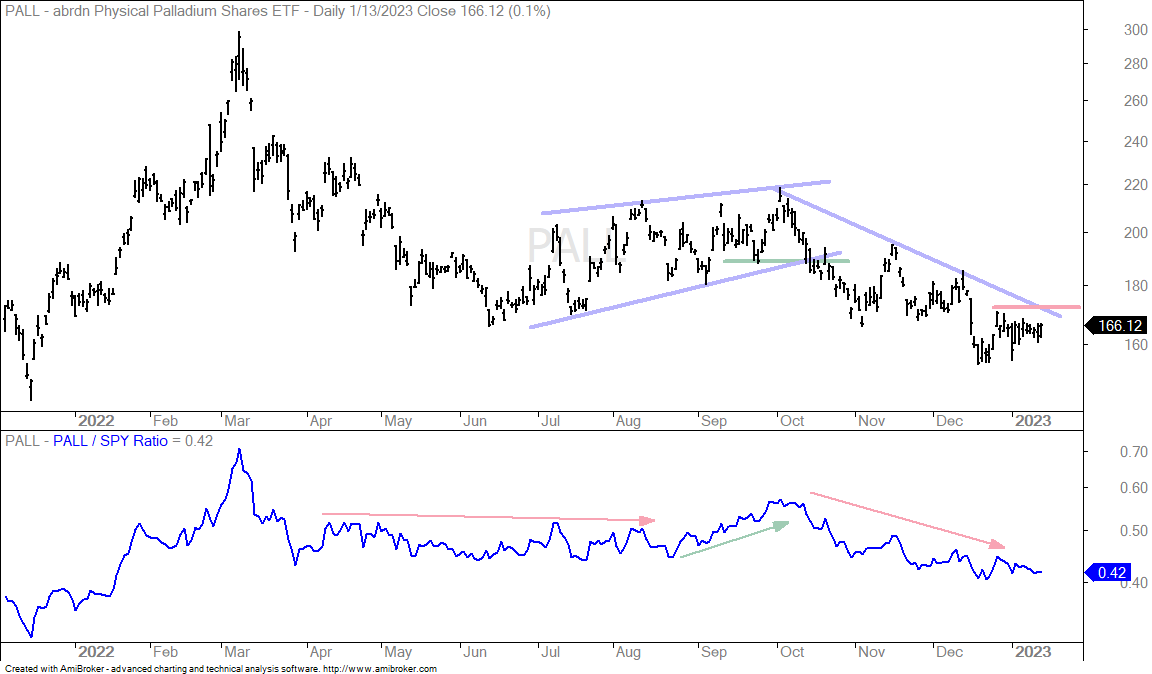
Palladium ETF (PALL) is lagging industrial and precious metals because it remains in a downtrend. Strength in industrial metals makes me wonder if PALL may find a bid eventually. The chart shows PALL in a downtrend since the mid October break down. The ETF dipped below 160 in mid December and then firmed with a consolidation the last few weeks. I am setting resistance at 172 and a break out here would reverse this three month slide.
Biotech ETF Extends on Breakout as XBI Surges (IBB)
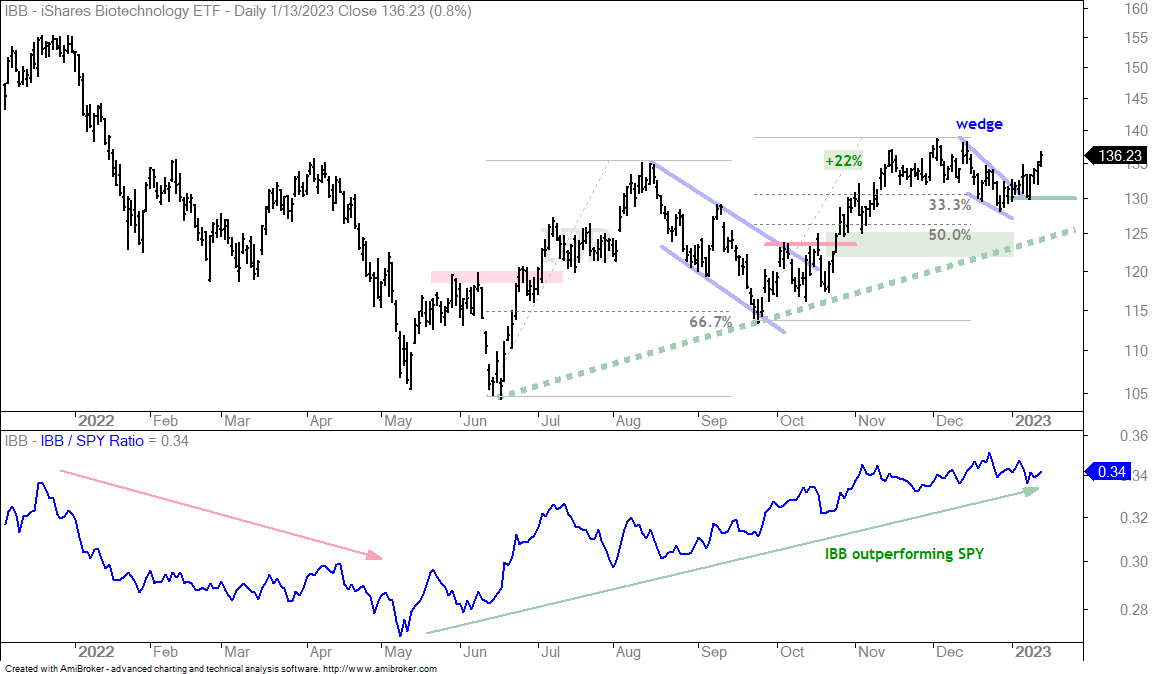
The Biotech ETF (IBB) remains in an uptrend and recently broke out of a small falling wedge. The ETF advanced some 22% into early December and then corrected with a falling wedge that retraced 33-50 percent. This short pullback is a bullish continuation pattern and the wedge breakout argues for a continuation higher. A close below 130 would argue for a re-evaluation.
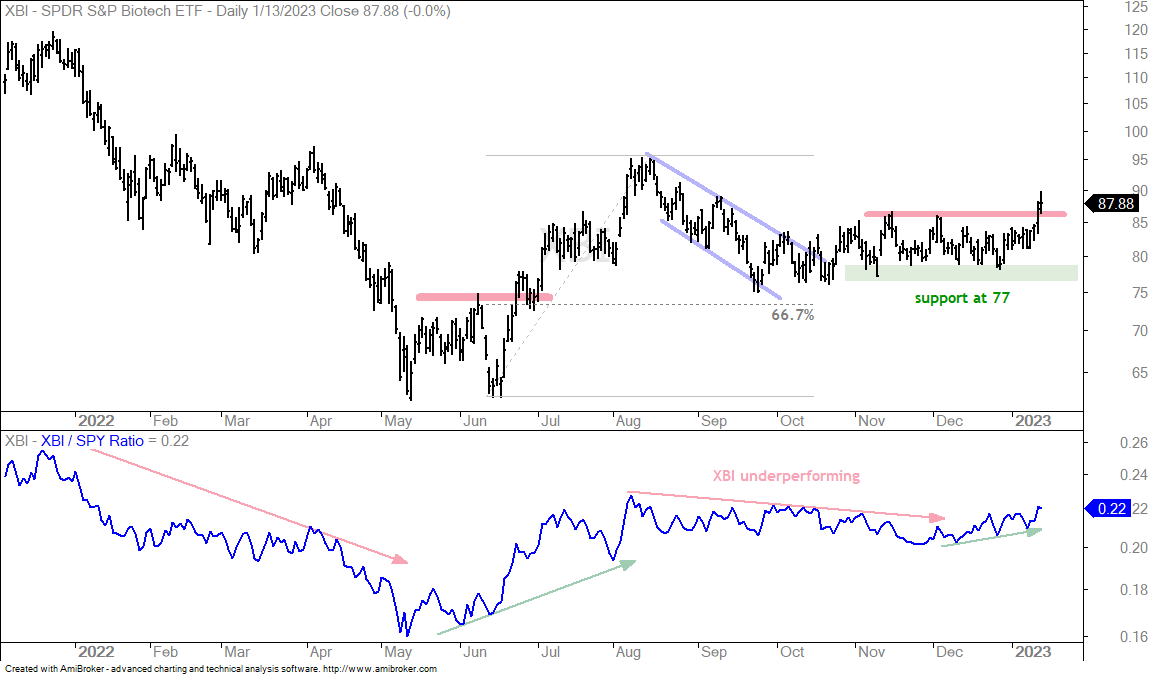
The Biotech SPDR (XBI) was lagging IBB and the broader market from August to early December, but is starting to outperform again. The chart below shows XBI trading flat since October and breaking above the November high with a surge last week (red line). The November-December lows mark support and a break below 77 would argue for a re-evaluation. The indicator window shows the XBI:SPY ratio turning up the last five weeks as XBI starts to outperform.
Energy ETFs with Breakouts and Corrections (XLE et al)
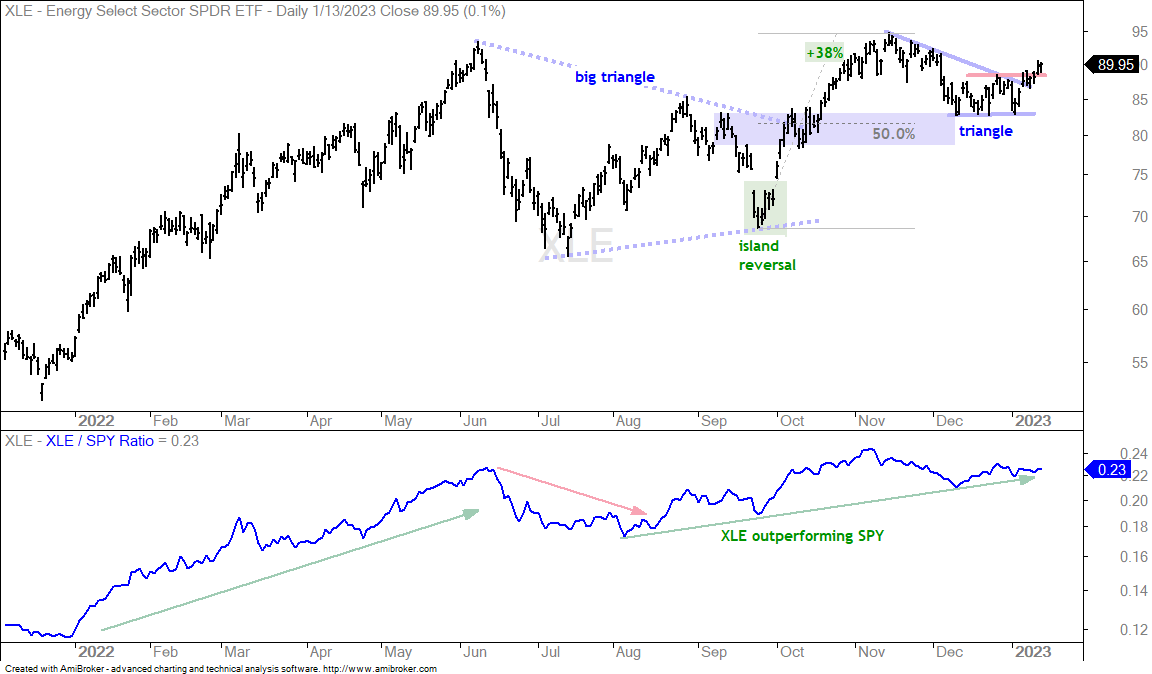
The energy-related ETFs are underperforming in January, but still have bullish continuation or corrective patterns working. The first chart shows XLE with a big triangle forming into September, a breakout in October and a new high in November. After a 38% advance and overbought condition in mid November, XLE consolidated with a smaller triangle, which is a bullish continuation pattern. XLE broke out with an advance above the late December high and this breakout is bullish.
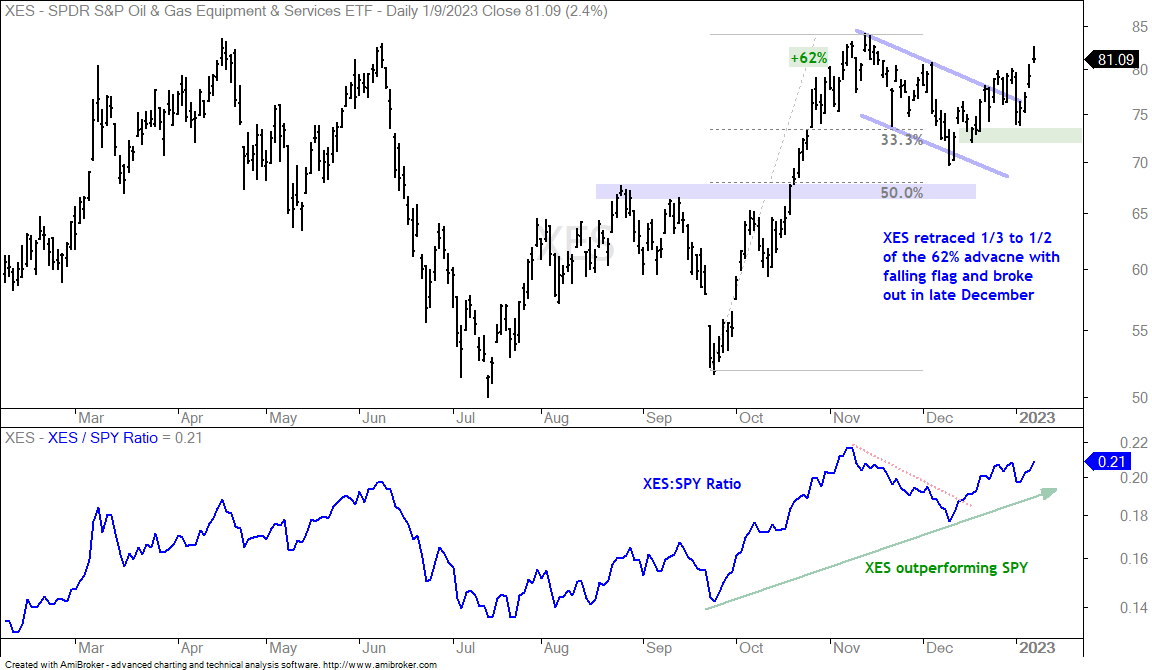
The next chart shows the Oil & Gas Equipment & Services ETF (XES) leading the group with a flag breakout in late December and a new high last week.
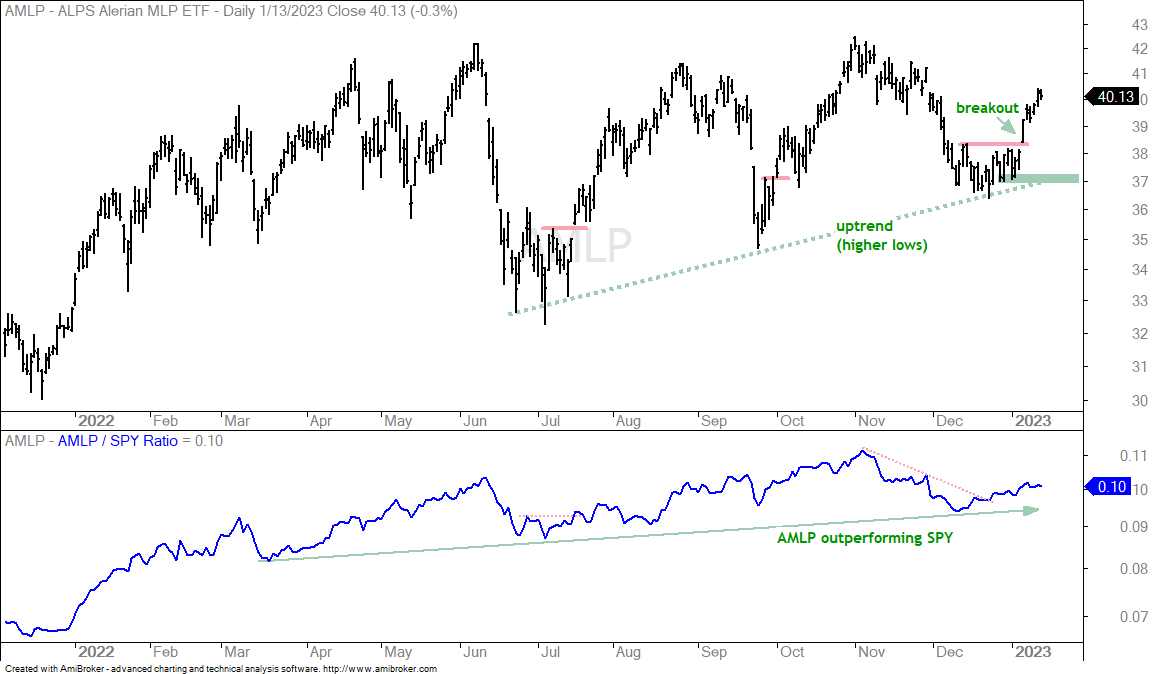
The next chart shows the MLP ETF (AMLP) with higher lows and higher highs since summer. The ETF firmed around 37 in December and broke short-term resistance with a surge the last seven days.
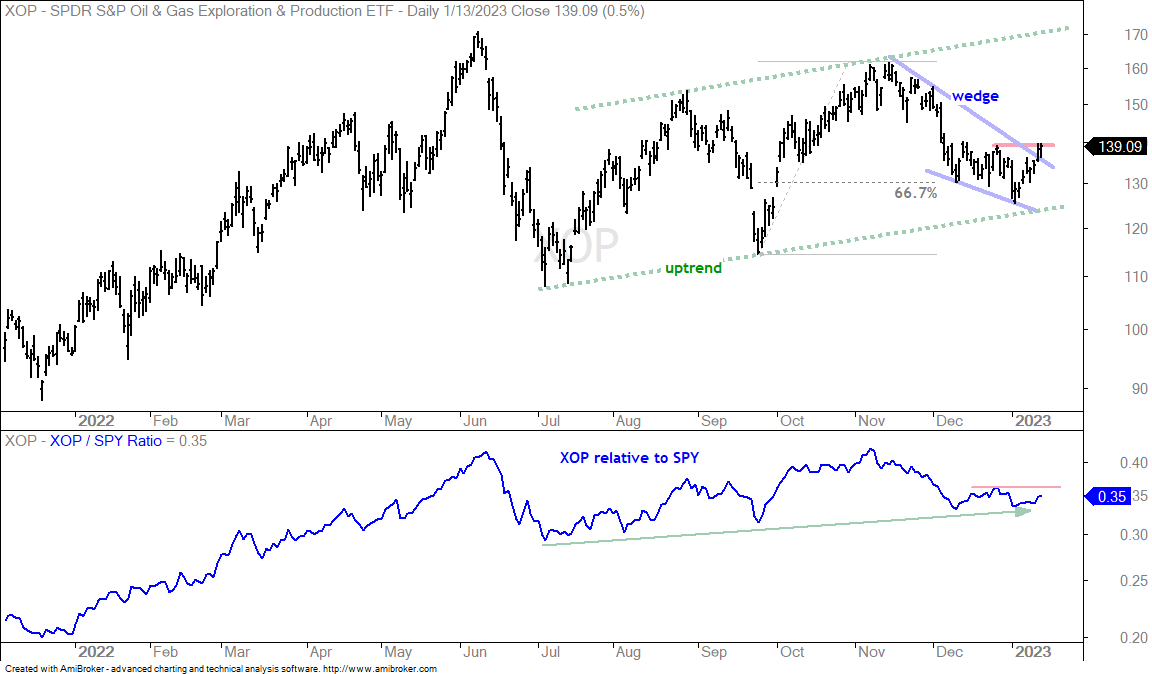
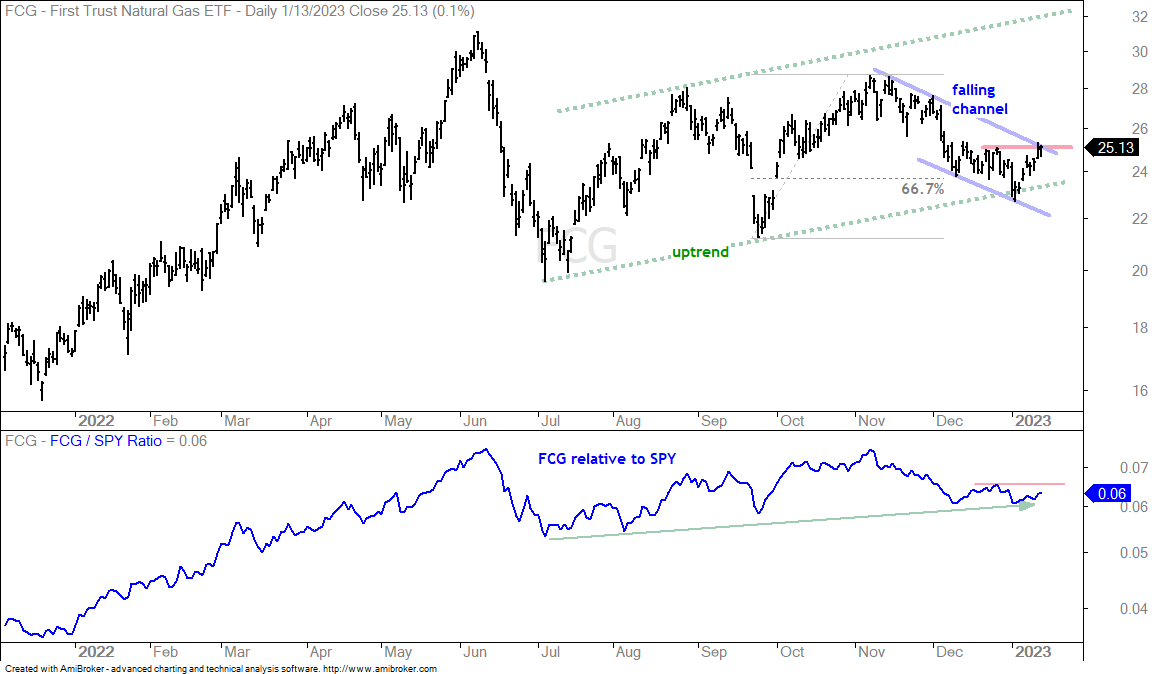
The Oil & Gas Exploration & Production ETF (XOP) and Natural Gas ETF (FCG) are lagging the group because they corrected and did not break out. The first chart shows XOP with a falling wedge that retraced more than 67%, but held above the September low. The ETF is still in an uptrend overall and this wedge still looks corrective. XOP broke the wedge line last week and is close to breaking the late December high (red line). The price-relative (XOP:SPY ratio) stalled the last two months and a break above the December high (red line) would show a return to relative strength.
Semis Lead within Tech Sector (SOXX, IGN, IGV)
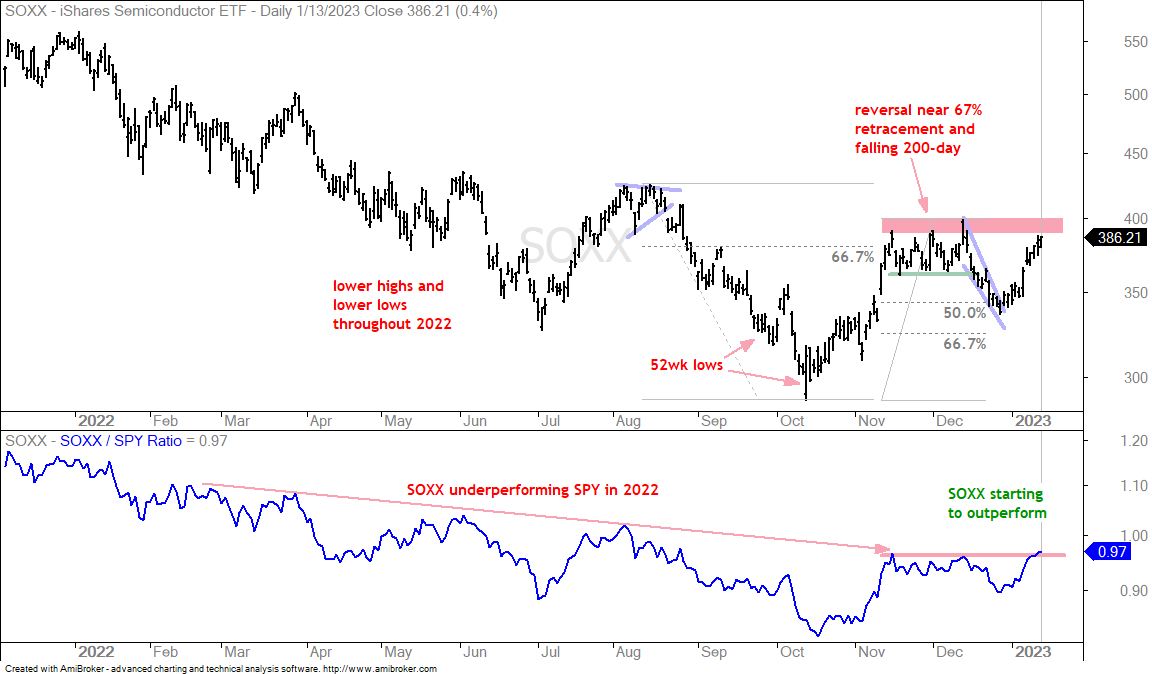
Semiconductors are leading within the tech sector. The chart below shows the Semiconductor ETF (SOXX) in a long-term downtrend with a 52-week low in October and another lower high in December. It looked like SOXX was breaking down in mid December, but the ETF reversed in the 50-67 percent retracement zone and surged 15% the last 11 days. A follow through break above the December high would forge a higher high and reverse the long-term downtrend. The indicator window shows the SOXX:SPY ratio breaking its November-December highs as SOXX starts to outperform.
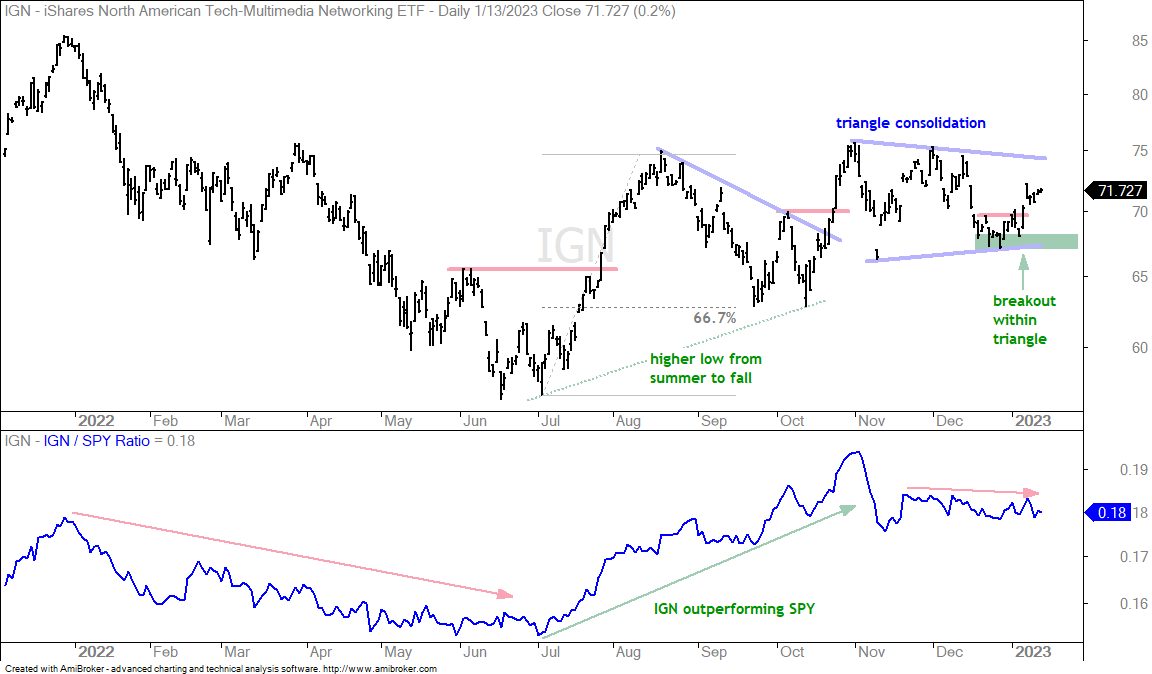
The Networking ETF (IGN) sports a short-term breakout within a triangle. IGN surged above the August high in late October and then formed a triangle consolidation, which is a bullish continuation pattern. IGN fell in the second half of December and found support in the 67-68 area. The ETF reversed this downswing with a short-term breakout in early January and this increases the chances of a bigger triangle breakout. I am concerned, however, because IGN is lagging since late November. The price-relative (IGN:SPY ratio) fell the last two months and IGN is not keeping pace with the broader market here in January.
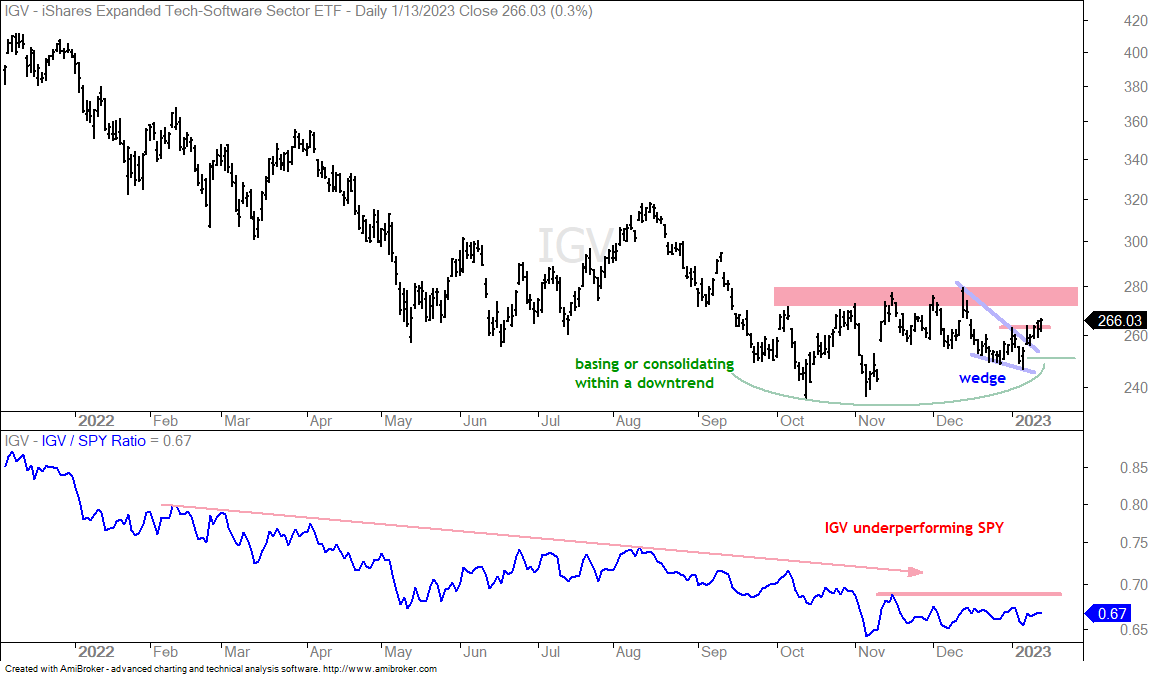
The Software ETF (IGV) is either basing and preparing for an upside breakout or consolidation and poised to continue its long-term downtrend. Overall, the long-term trend is down and IGV is still lagging. The ETF, however, found support in the 240-250 area since September. The falling wedge marks the most recent downswing and IGV broke short-term resistance last week. This is the early signal and a follow through breakout at 280 would reverse the long-term downtrend. I would re-evaluate on a close below 250.
Surge and Consolidation for Baltic Dry (BDRY)
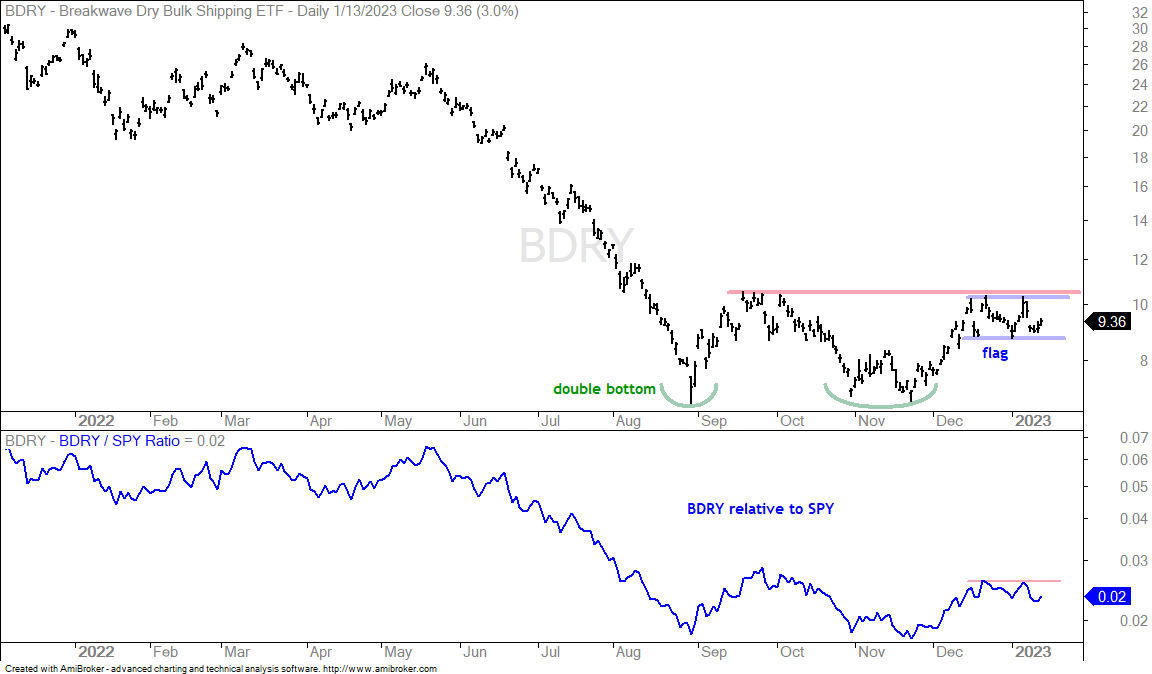
The Dry Bulk Shipping ETF (BDRY) did not take part in the January advance, but has a potential bull flag forming. The chart below shows the ETF with two lows forming a possible double bottom. A break above the red resistance line would confirm this basing pattern. Short-term, BDRY surged into mid December and then consolidated with a flat flag, which is a bullish continuation pattern. A flag breakout would lead to a double bottom breakout.
Oversold with StochRSI Pop for Global Carbon (KRBN)
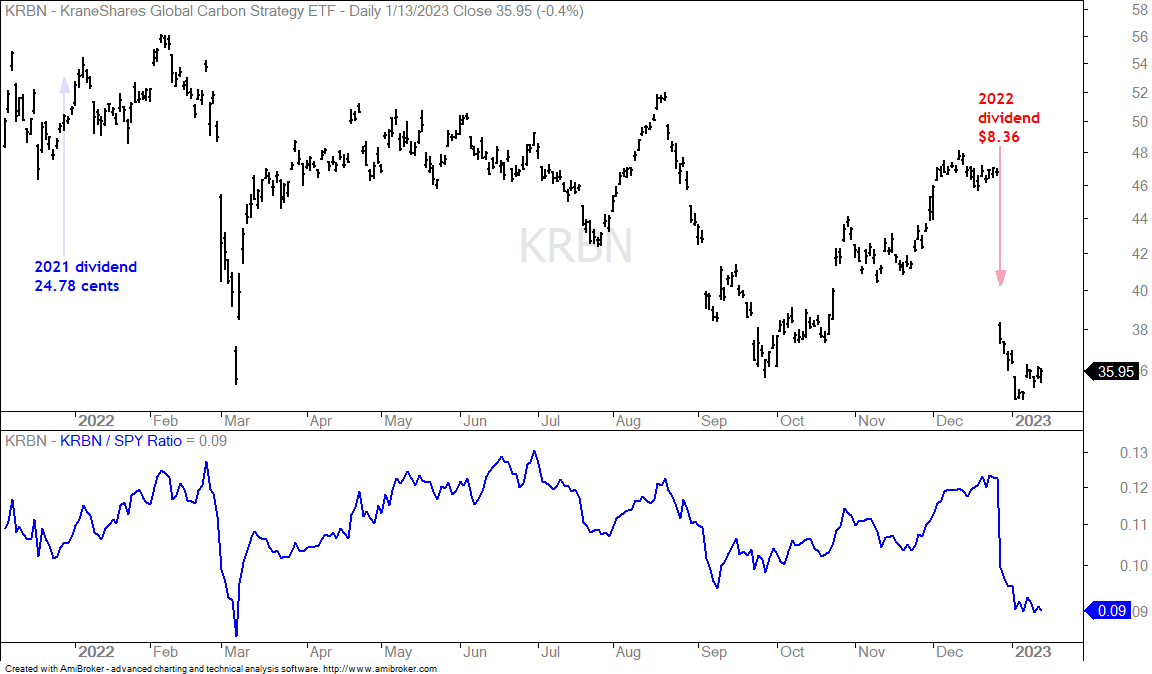
I do not adjust for ordinary dividends, but must make an exception for the Global Carbon ETF (KRBN) because the annual dividend in 2022 was 8.3553 and caused a huge gap (red arrow). In contrast, the annual dividend in 2021 was .2478 and did not cause such a gap.
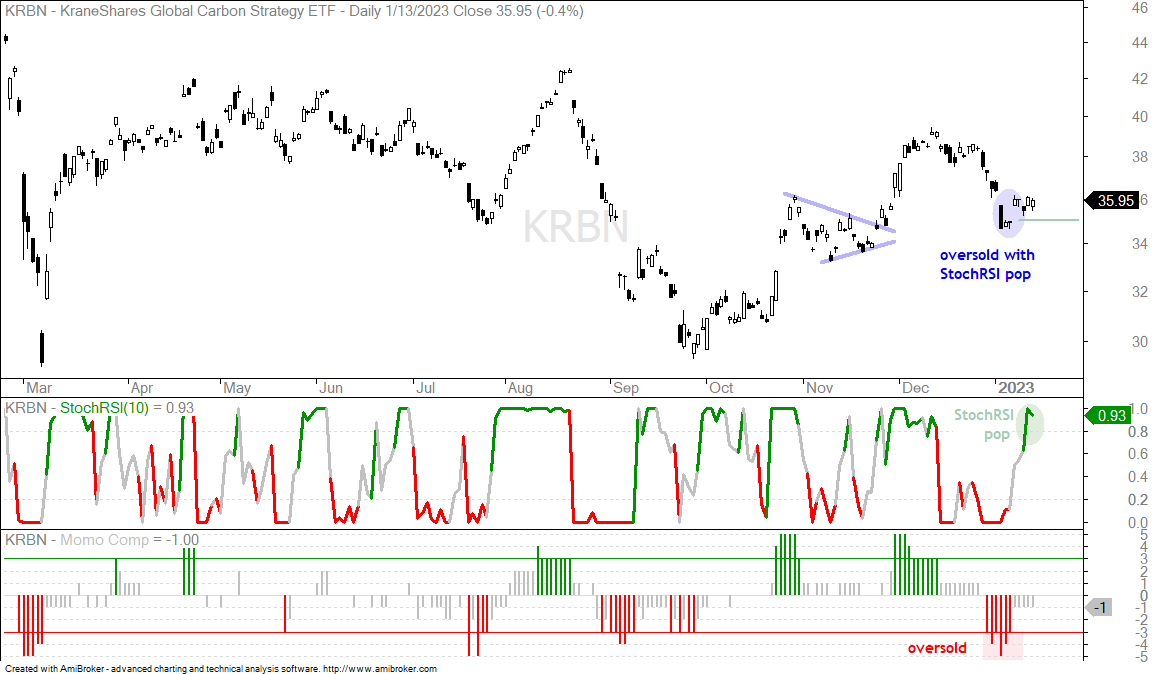
The next chart shows KRBN adjusted for dividends to remove the big gap. KRBN caught my eye because it is in an uptrend since September and became oversold in late December as the Momentum Composite exceeded -3 for several days (red shading). After becoming oversold, KRBN surged on January 9th and StochRSI exceeded .80 for a short-term momentum pop. This surge-pop suggests a reversal after the pullback. A close below 35 would call for a re-evaluation.
You can learn more about my chart strategy in this article covering the different timeframes, chart settings, StochClose, RSI and StochRSI.