About the ETF Trends, Patterns and Setups Report
This report contains discretionary chart analysis based on my interpretation of the price charts. This is different from the fully systematic approach in the Trend Composite strategy series. In this ETF Trends, Patterns and Setups report, I am looking for leading uptrends and tradable setups within these uptrends. While I use indicators to help define the trend and identify oversold conditions within uptrends, the assessments are mostly based on price action and the price chart (higher highs, higher lows, patterns in play). Sometimes the chart assessment can be at odds with the indicators.
This Week's Commentary Schedule
- Tuesday – 6 September: Market-ETF Report and Signal-Rank Table Update
- Wednesday – 7 September Market-ETF Video and Market Regime Update
- Thursday – 8 September: Market-ETF Report and Signal-Rank Table Update
- Saturday – 10 September: ETF Signal and Rank Table
Composite Breadth Model Deteriorates
The weight of the evidence is clearly bearish for stocks. The Composite Breadth Model hit -5 last week as the S&P 500 and S&P 1500 Thrust Models flipped back to bearish. The CBM was at -1 from August 12th to 30th, but never flipped bullish as the 5-day SMA for the S&P 500 remained below the 200-day SMA. The 5-day is now 7.4% below the 200-day and only 25.7% of S&P 500 stocks are above their 200-day SMAs. This implies that some 75% of S&P 500 stocks are below their 200-day SMAs (long-term downtrends). 
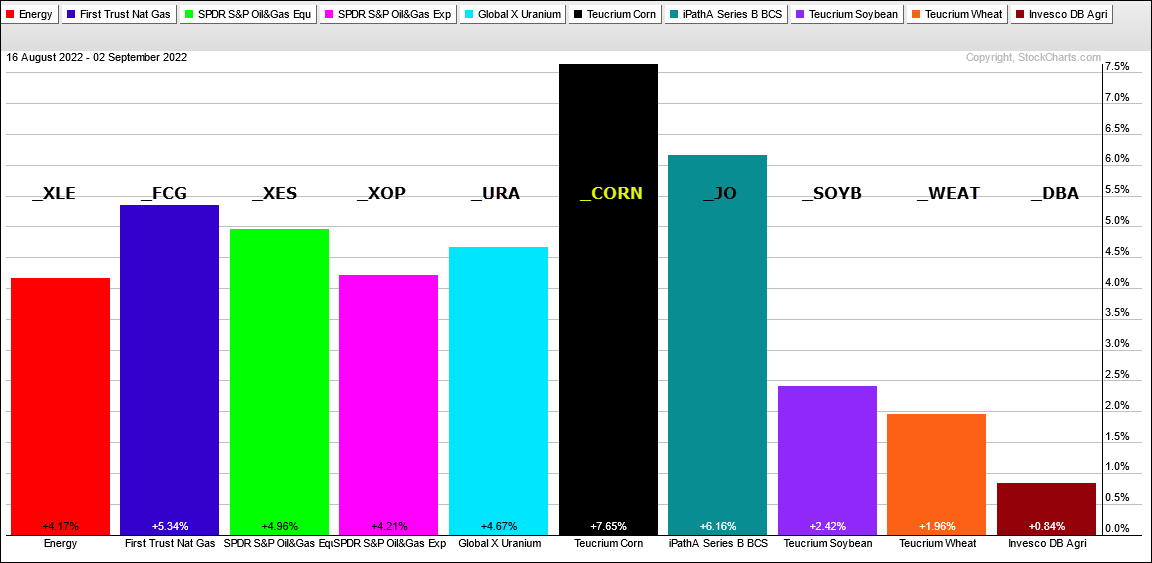
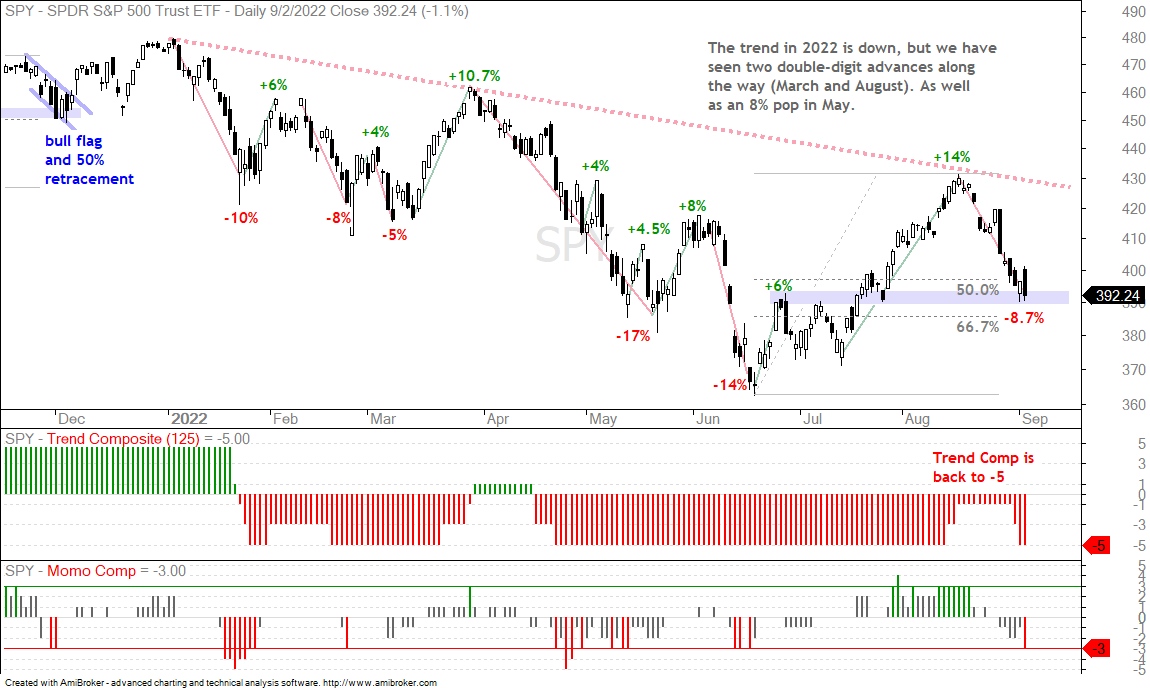
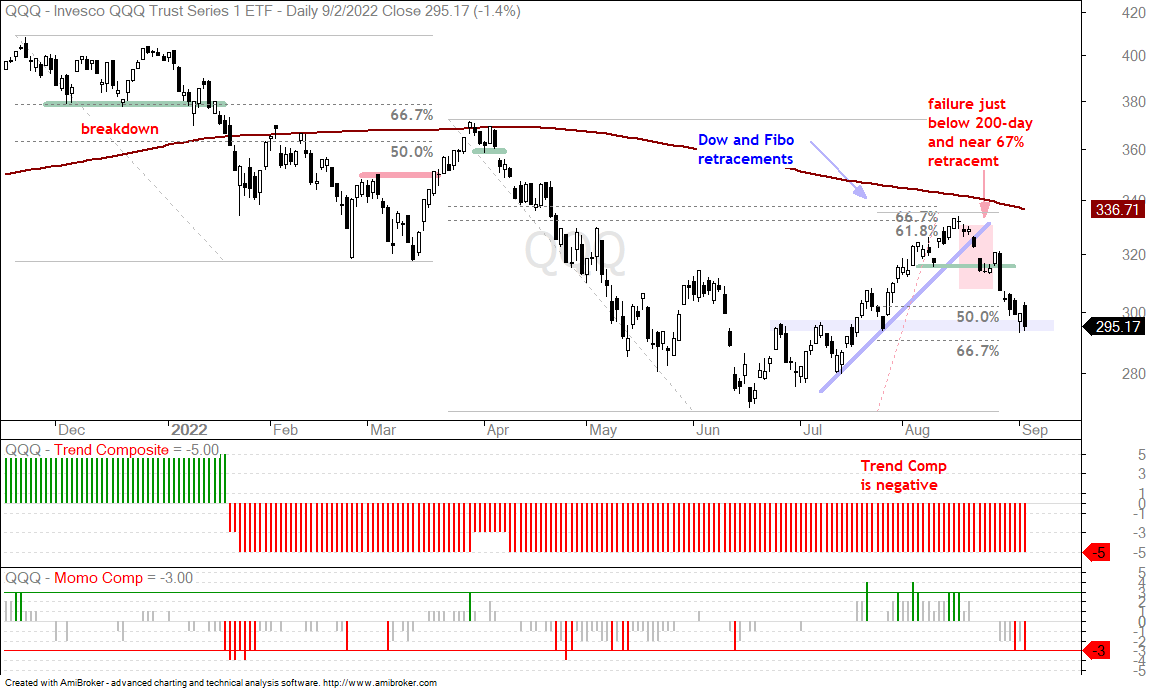
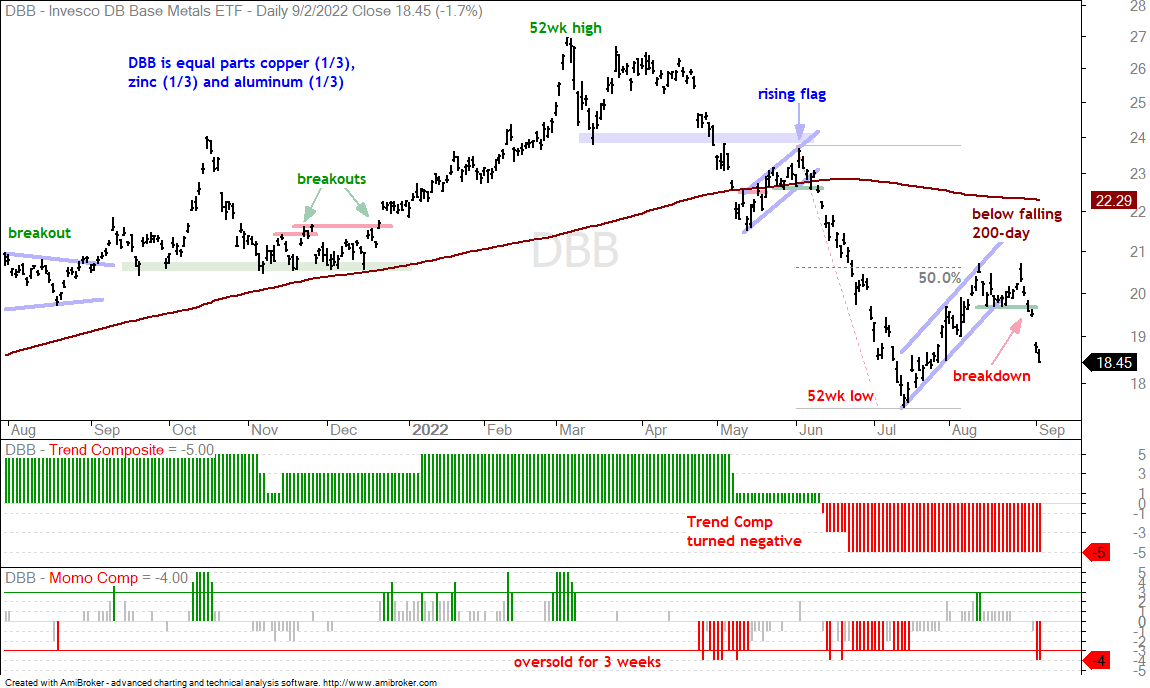
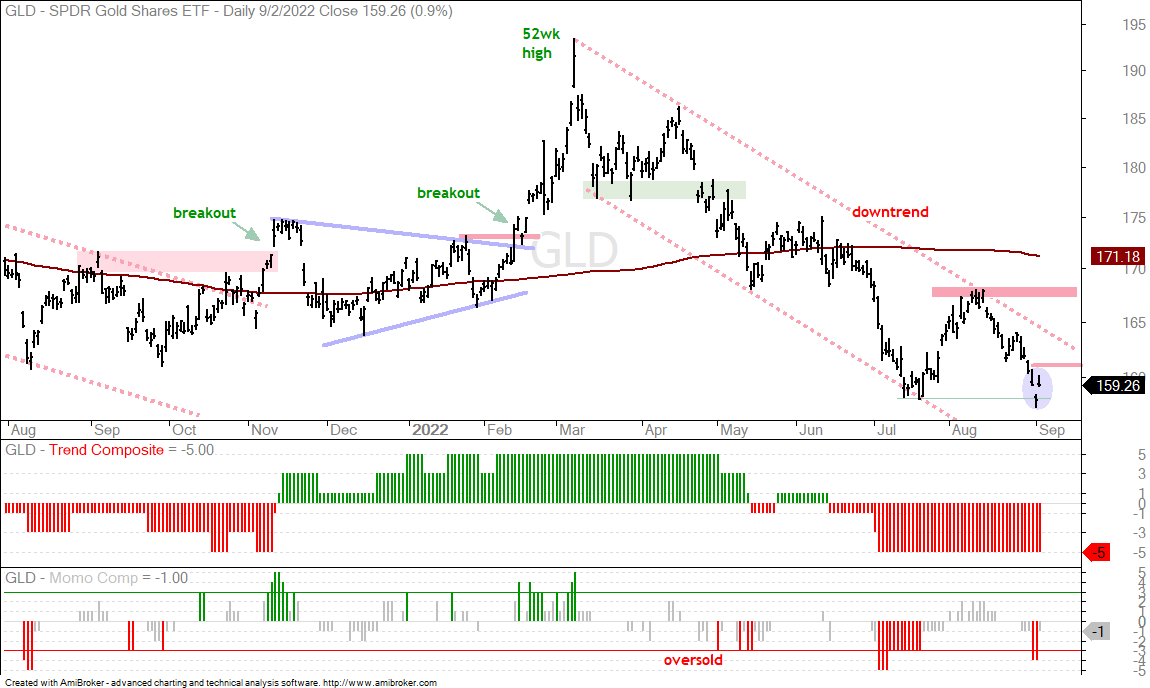
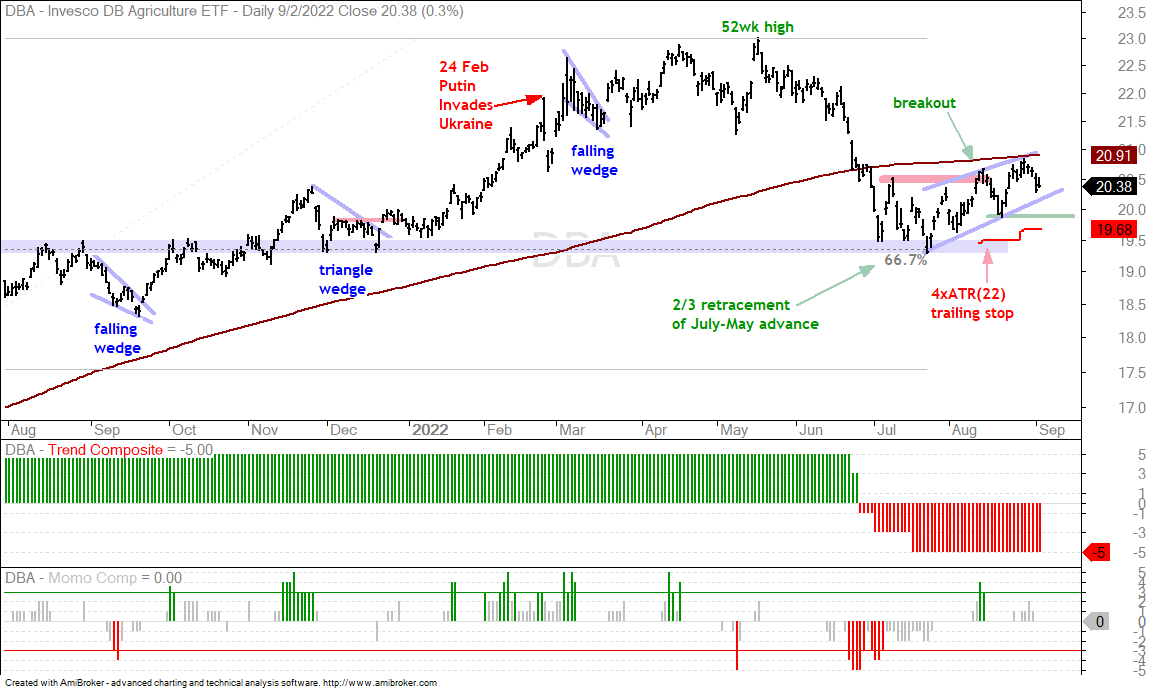
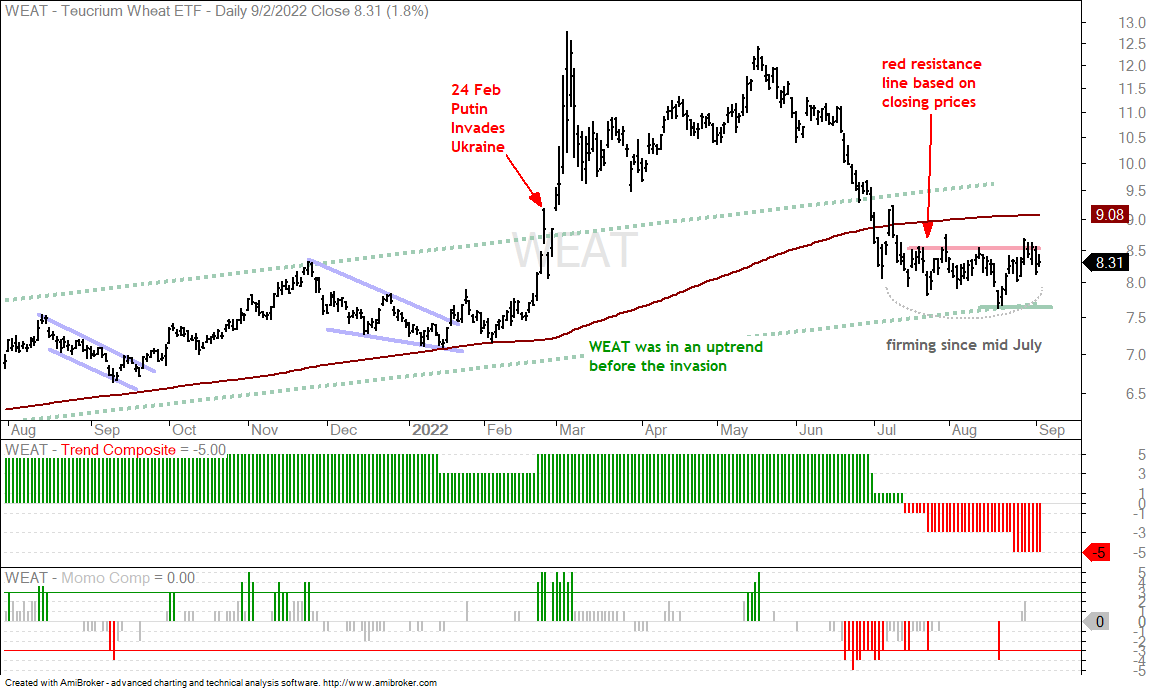
The pickings within the stock market are slim.
New Downtrend Signals and a Lone Uptrend Signal
There were over a dozen new downtrend signals over the last five trading days and these were concentrated in stock-based ETFs. There are 168 stock-based ETFs in the Master List. 31 are in uptrends (18.5%) and 137 are in downtrends (81.5%). The remaining uptrends are concentrated in ETFs associated with dirty energy, utilities, clean energy, and biotech.
There are 53 international stock-based ETFs and only three are in uptrends (India (INDA), Turkey (TUR) and Chile (ECH)). It seems like a bear market for global equities so I am a bit skeptical of three isolated uptrends. The Trend Composite turned positive for the India ETF (INDA) and this is the only new uptrend signal in the past five days. The chart below shows INDA looking similar to SPY in mid August it hits resistance near the falling 200-day SMA. On the bullish side, INDA held up quite well the last 13 days because it was down less than 3% and a bullish pennant could be forming. These are short-term continuation patterns and a breakout at 44 would confirm the pattern. Such a move would also break the 200-day.
Energy-Based ETFs and Agriculture Hold UP
As noted in Thursday’s report, correlations tend to rise when the short-term and long-term trends align, especially on the downside. Ten of the eleven sectors are down the last 13 days. The Energy SPDR (XLE) is the only gainer. Almost all of the industry-group ETFs are down. The exceptions are energy-related ETFs (FCG, XES, XOP, PSCE) and the Uranium ETF (URA). Some commodity-related ETFs are also showing gains the last 13 days (CORN, JO, SOYB, WEAT, DBA, DBE).
The only true way to avoid the wrath of bear market is to shun most stock-based ETFs and focus outside of equities. My basic strategy is to look for tradable pullbacks withing bigger uptrends. Even though SPY has a seemingly tradable pullback working (see below), a pullback within a bigger downtrend is not part of my strategy. The vast majority of ETFs are in downtrends and this means there are not many bullish setups. Bonds, industrial metals and precious metals are in downtrends, while even energy and agriculture are looking vulnerable.
Big Three in Downtrends, but Near Short-term Support Zones
The S&P 500 SPDR (SPY) has been in a long-term downtrend since mid April and the short-term uptrend reversed on August 22nd, which is when the %Above 20-day SMA indicators for the S&P 500 and Nasdaq 100 plunged below 60% (see report here). The chart below shows some of the larger swings this year with double-digit advances in March and August, and an 8% bounce in late May. Bear market bounces can be sharp.
SPY is currently down 8.7% in 13 days and short-term oversold. We do not need an indicator to figure this out, but the Momentum Composite is at -3 to confirm. Also note that SPY is trading in a support-reversal zone marked by broken resistance and the 50-66.7% retracement zone (blue shading). Thus, the setup is there for an oversold bounce.
The long-term trend is still down for SPY, QQQ and IWM. As such, an oversold bounce at this stage would still be considered a bear market bounce. The next chart shows QQQ falling to broken support as it retraced 50-67% of the June-August advance (blue shading). The Momentum Composite is also oversold at -3 and this could give way to an oversold bounce.
The next chart shows IWM also near a support-reversal zone (blue shading). Also note that SPY, QQQ and IWM all reversed near their falling 200-day SMAs in mid August. This alone is enough to suggest a bear market for stocks. These three are highly correlated and move in the same direction. A bounce in SPY means a bounce in QQQ and IWM. Just as a long-term downtrend in SPY and bearish Composite Breadth Model imply a long-term bearish outlook for QQQ and IWM.
Energy-Based ETFs Hold Up Better than Market
(XOP, FCG, XLE, XES, AMLP, PSCE)
Energy-based ETFs are leading simply because they are above their rising 200-day SMAs and they did not decline with the rest of the market over the last 13 trading days. The Oil & Gas Exploration & Production ETF (XOP) and Natural Gas ETF (FCG) held up the best of the energy-based ETFs in July because their Trend Composites stayed positive. Both formed falling wedges as they corrected back to the rising 200-day SMAs and broke out with surges in mid July. They extended higher the last several weeks and continue to hold their ATR Trailing Stops, which are set 3 ATR(22) values below the highest close since the wedge breakouts.
Note that these trailing stops are quite tight because they were set with the wedge breakouts in mid July. Those looking for more wiggle room can consider using the rising 200-day SMAs or August lows to set a stop-loss level. A close below both would be quite negative and warrant a re-evaluation of the longer-term trends.
The Oil & Gas Equipment & Services ETF (XES), MLP ETF (AMLP) and Small-cap Energy ETF (PSCE) formed pennant consolidations in August and broke out of these with surges in late August. All three fell back last week, but remains in uptrends overall. PSCE and AMLP are above their rising 200-day SMAs and their Trend Composites are positive. The green lines mark first support to watch going forward.
The Oil & Gas Equipment & Services ETF (XES) represents the energy sector on Red Bull (lots of caffeine and sugar). XES is more volatile and more risky. The ETF is trading right at its 200-day SMA, which is still slightly rising. The swing is up since the late July breakout, but the ETF fell back pretty hard after the pennant breakout. Support is set at 59.
You can learn more about the ATR Trailing Stop and exit strategies in this post,
which includes a video and charting options for everyone.
Clean-Energy ETFs Fall with Broader Market (TAN, ICLN, LIT)
The Solar Energy ETF (TAN) led the market with an early Trend Composite signal in early July and the Global Clean Energy ETF (ICLN) followed with a signal in late July. Both broke above their March highs in August and are clear leaders. Unfortunately, they are still stock-based ETFs and can be influenced by the broader market. This is clear as both TAN and ICLN fell the last three weeks. They are still in uptrends and these declines are viewed as pullbacks within bigger uptrends. The bearish market environment, however, casts a shadow on any setup. The chart below shows TAN with a broken resistance zone turning first support in the 77-81 area (blue shading). The Momentum Composite has yet to become oversold, but a possible bull flag is taking shape. I will be watching for signs of support and a setup in the coming days. The trend-following ATR Trailing Stop is at 76.93.
The next chart shows the Global Clean Energy ETF (ICLN) with the broken resistance zone turning support in the 20-21 area (blue shading). The 50-67% retracements and 200-day SMA are also in this zone. A falling flag could be taking shape on the price chart, but I would be more inclined to wait for signs of support in the 20-21 area and short-term oversold conditions (Momentum Composite at -3 or lower).
The Lithium Battery Tech ETF (LIT) moved higher along with the clean-energy ETFs, but fell harder over the last two weeks and triggered the ATR Trailing Stop (5 x ATR22). The ETF could not escape the pull of the broader market. A re-assessment shows a rising wedge, a failure at the falling 200-day and a break below the lower wedge line. The Trend Composite is still positive, but the bear market is proving too strong for LIT. Note that the Global Auto ETF (CARZ) is down some 12% from its August high.
Biotech ETFs Hit Short-term Support-Reversal Zones (IBB, XBI)
The Biotech ETF (IBB) and Biotech SPDR (XBI) have charts that are somewhat similar to the Lithium Battery Tech ETF (above). The Trend Composites are positive, but they failed at the falling 200-day SMAs and fell with the market the last 13 days. Both are at a short-term moment of truth as they hit support zones and key retracements (blue shading). The chart below shows IBB retracing around half of the prior advance and hitting support from broken resistance (blue shading). A falling flag of sorts also formed and a break above Friday’s high would reverse the short-term slide.
The next chart shows XBI holding up better than IBB because its pullback was shallower (less than 50%) and the ETF is above the July lows. A falling flag is also taking shape as the ETF declines from the falling 200-day SMA. A break above Friday’s high would reverse this short-term decline and be bullish.
You can learn more about my chart strategy in this article covering the different timeframes, chart settings, StochClose, RSI and StochRSI.
DB Commodity ETF Forms Bearish Pattern (DBC)
I do not analyze the DB Commodity ETF (DBC) often because I think it is better to focus on the individual parts. These include the DB Energy ETF (DBE), DB Precious Metals ETF (DBP), DB Agriculture ETF (DBA) and DB Base Metals ETF (DBB). The components of these commodity groups are more correlated that the groups. For example, oil and gasoline are positively correlated, but energy is not necessarily correlated with agriculture. Note that DBC is heavily weighted toward energy (61.59%). In any case, DBC fell to its rising 200-day in June-July and then worked its way higher the last two months. This choppy rise looks like a bearish continuation pattern (rising flag or channel) and a break below 25 would signal a continuation lower.
The Trend Composite and ATR Trailing Stop are part of the
TIP Indicator Edge Plugin for StockCharts ACP
DB Energy ETF Hits Moment of truth (DBE)
The DB Energy ETF (DBE) fell back sharply last week and is at its moment of truth (the ATR Trailing Stop). Weakness in gasoline is the main culprit as unleaded fell from the $4.2 area in June to the $2.5 area (-45%). West Texas Intermediate ($WTIC) also fell around 30% in this timeframe. The DBE has been bolstered by Natural Gas ($NATGAS), which is up 65% since early July. On the price chart, the June-July decline in DBE looked like a correction within a bigger uptrend and the ETF found support near the 66.7% retracement in July-August (green zone). DBE broke out in late August and fell back into the summer trading range last week. This is the wiggle room and the ATR Trailing Stop is at 24.35, a close of which would call for a re-evaluation.
Base Metals and Gold Are Weak (DBB, GLD)
The DB Base Metals ETF (DBB) broke down last week and this speaks to demand destruction. As noted last Thursday, DBB was in a long-term downtrend and retraced half of the prior decline with the advance above 20. This upswing reversed as DBB broke short-term support last Tuesday.
The Gold SPDR (GLD), which represents precious metals, has been trending lower since mid June and hit a 52-week low last week. The only setup I see on this chart is a possible bear trap from a failed support break. GLD also forged a short-term reversal over the last three days (blue oval). A break above 161 would show follow through and be short-term bullish. This is for bottom pickers only because the long-term trend is down. Plan your trade first and then trade according to that plan.
DB Agriculture ETF Forms Rising Wedge (DBA)
The DB Agriculture ETF (DBA) has been moving higher since mid July, but the Trend Composite is still negative and price is below the rising 200-day SMA. A rising wedge defines this short-term uptrend and the bulls have a slight edge as long as it rises. Note that I identified a breakout in mid August and set an ATR Trailing Stop based on this breakout, which is currently at 19.68. Part of the trade management process is identifying patterns that can prove your thesis wrong. The rising wedge is one such pattern and a break below the mid August low (green line) would prove me wrong. Such a break would signal a continuation of the May-July decline and represent a failure at the 200-day SMA.
Wheat Continues to Firm as Coffee Pulls Back (WEAT, JO)
The Wheat ETF (WEAT) appeared to break out last Monday with a close above 8.5, but fell back the last few days. Overall, the ETF fell back to its prior uptrend with a move into the rising channel (green lines). WEAT then firmed since mid July with lots of support in the 8 area. Another push above the July-August highs would be bullish.
The next chart shows the Coffee ETF (JO) with a short-term breakout on August 10th and a long-term channel breakout in late August. The 3 ATR Trailing Stop aligns with the short-term breakout and is currently at 61.02, a close of which would call for a re-evaluation. Long-term, the 6 ATR Trailing Stop is trend-following stop and based on when the Trend Composite turned positive. It is currently at 55.41 and a close below this level would argue for a re-evaluation of this trend signal.
Previous Report (Thursday, 1 September)
The following topics were covered on Thursday (here).
- Correlations Continue to Rise
- Defensive ETFs are Not Immune (XLU, XLP, PPA)
- Gasoline Weighs on DBE (RB1!, CL1!, DBE)
- Copper Leads Base Metals Breakdown (DBB, CPER, COPX)
- Precious Metals Not Offering an Alternative (GLD)
- Inflation-Protected Bond ETF Plunges (TIP)
- TLT Fails to Bounce as 10-yr Treasury Yield Rises (TLT, $TNX)
You can learn more about my chart strategy in this article covering the different timeframes, chart settings, StochClose, RSI and StochRSI.