SPY is testament to the volatile world we live in right now. The ETF surged some 14% in 22 days (.64% per day) from July 22nd until August 16th and then fell 8% the last 11 days (.73% per day). The fall, so far, is sharper than the rise. The reversal occurred with an upside down V as the ETF gapped down on August 22nd and continued sharply lower the last four days. It is hard for stocks and stock-based ETFs to buck the broader market with the speed and depth of these moves. As such, participation on the downside broadened as more stocks and stock-based ETFs succumbed to selling pressure. Clean energy, dirty energy (oil) and utilities are holding up the best.
About the ETF Trends, Patterns and Setups Report
This report contains discretionary chart analysis based on my interpretation of the price charts. This is different from the fully systematic approach in the Trend Composite strategy series. In this ETF Trends, Patterns and Setups report, I am looking for leading uptrends and tradable setups within these uptrends. While I use indicators to help define the trend and identify oversold conditions within uptrends, the assessments are mostly based on price action and the price chart (higher highs, higher lows, patterns in play). Sometimes the chart assessment can be at odds with the indicators.
This Week's Commentary Schedule
Tuesday – 16 August: Market-ETF Report and Signal-Rank Table Update
Wednesday – 17 August Market-ETF Video and Market Regime Update
Thursday – 18 August: Market-ETF Report and Signal-Rank Table Update
Saturday – 20 August: ETF Signal and Rank Table
You can learn more about my chart strategy in this article covering the different timeframes, chart settings, StochClose, RSI and StochRSI.
Correlations Continue to Rise (DBA, FXI, AGG)
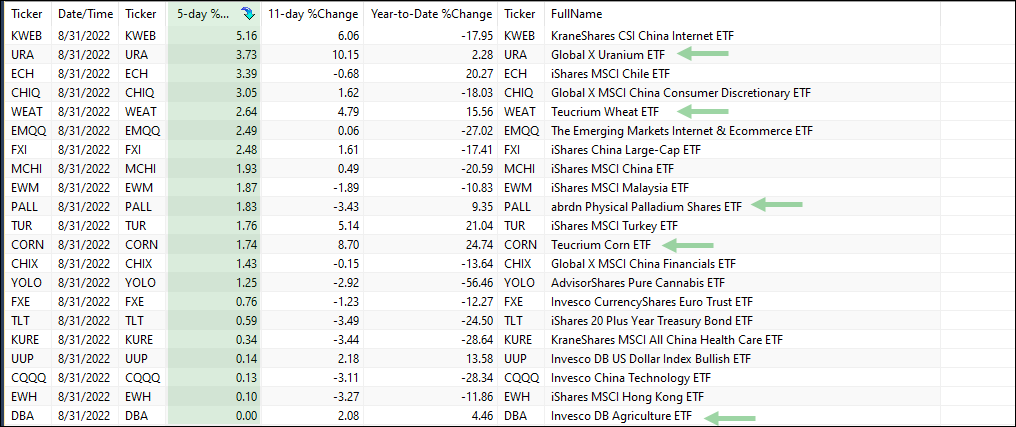
Stocks and stock-based ETFs are highly correlated to broad market movements, especially when the long-term and short-term trends align. The S&P 500 peaked on August 16th and is down 8% over the last 11 days. SPY is also down 4.5% over the last five days. The Energy SPDR (XLE) is the only sector showing a gain over the last 11 days, but it too is down over the last five days. The table below shows the top performing ETFs over the last five days. Almost all industry-group ETFs are down. The Uranium ETF (URA) and the Pure Cannabis ETF (YOLO) are the only two with gains.
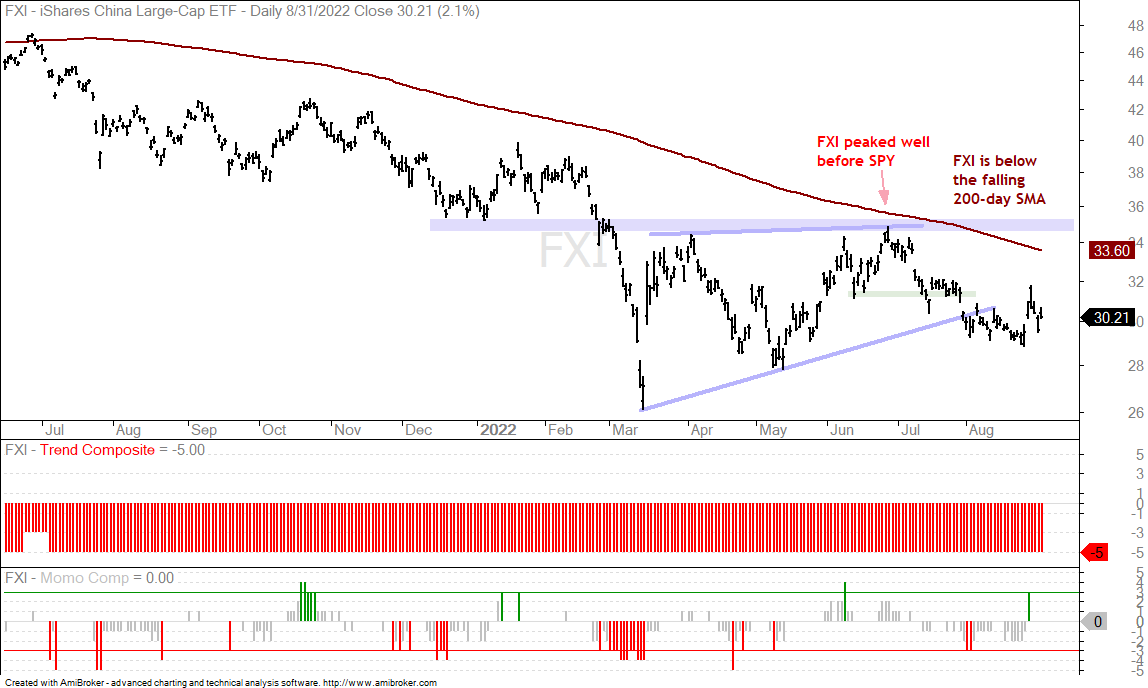
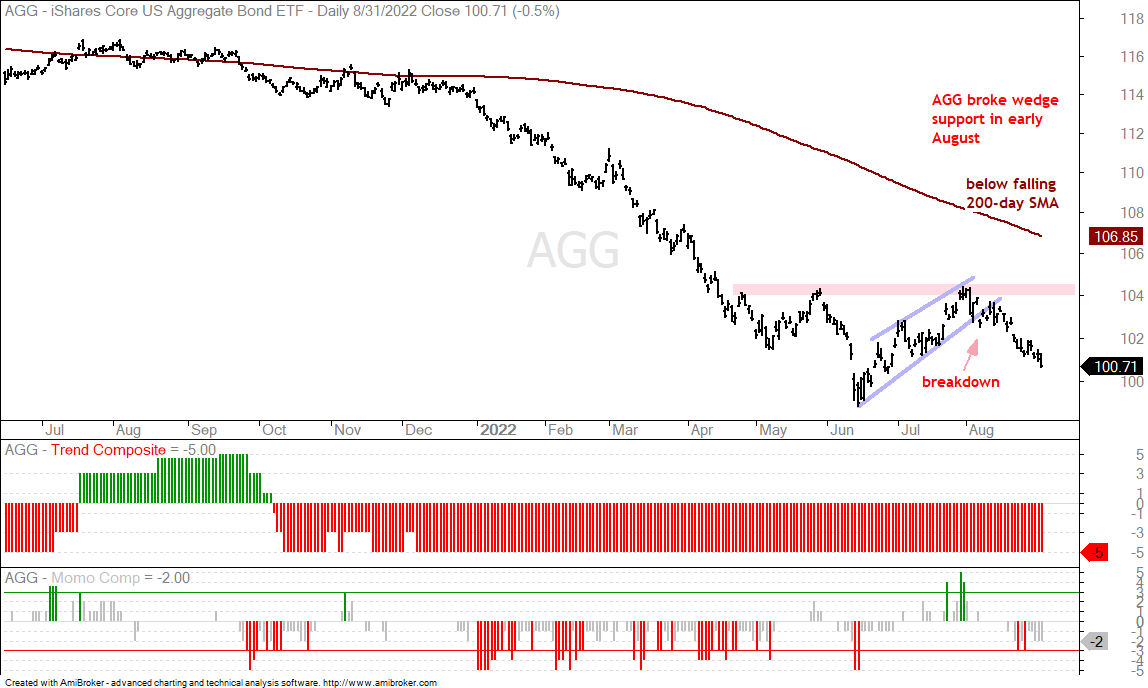
Elsewhere, the 20+ Yr Treasury Bond ETF (TLT) is up over the last five days, but the other bond ETFs are down (TIP, IEF, AGG, LQD, MBBB, JNK). Some Chinese-based ETFs are showing gains, but the China Large-Cap ETF (FXI) is well below its falling 200-day and down over 10% from its June high. The Wheat ETF (WEAT) and Corn ETF (CORN) are up, while the DB Agriculture ETF (DBA) is flat. The Palladium ETF (PALL) is the only metal showing a gain (green arrows). WEAT, DBA and PALL were covered on Tuesday.
The Momentum Composite aggregates signals in five momentum-type indicators to identify short-term overbought and oversold conditions. This indicator is part of the TIP Indicator Edge Plugin for StockCharts ACP
Defensive ETFs are Not Immune (XLU, XLP, PPA)
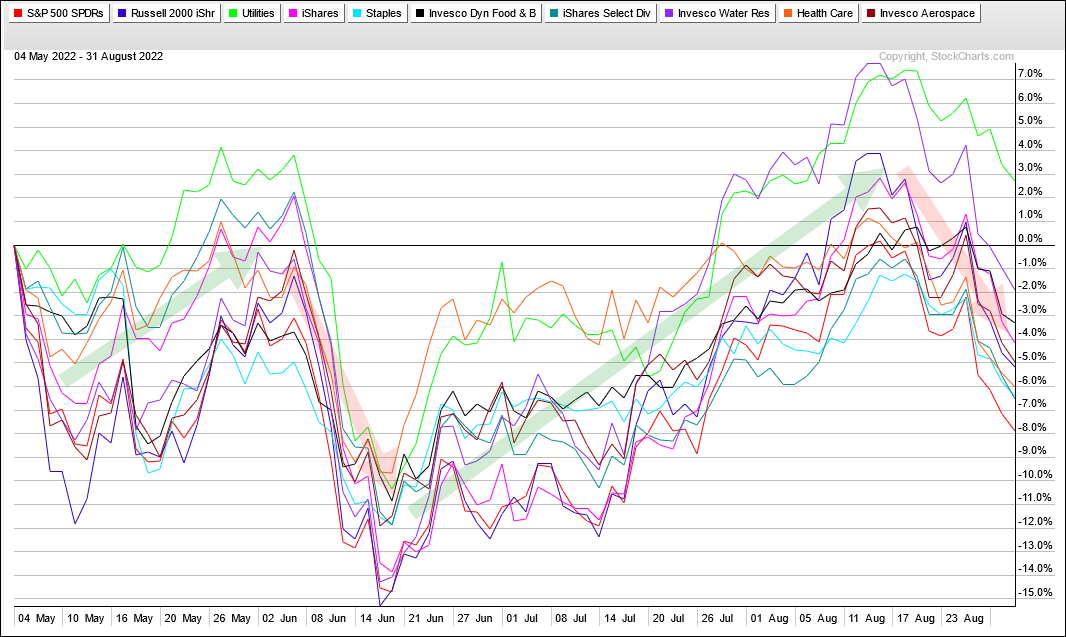
The short-term trend is down for the major index ETFs and we are in a bear market. This is a powerful combination that can lead to broadening participation on the downside. Even ETFs that are defensive in nature can succumb to selling pressure. These include the Utilities SPDR (XLU), Infrastructure ETF (IFRA), Consumer Staples SPDR (XLP), Food & Beverage ETF (PBJ), Select Dividend ETF (DVY), Water Resources ETF (PHO) and Healthcare SPDR (XLV). I would also throw in the Aerospace & Defense ETF (PPA). The PerfChart below shows performance for SPY, IWM and these eight “defensive” ETFs. SPY (red line) is down the most since May (-8%). Notice how these lines pretty much move in unison (red and green arrow-lines). All rose in May, fell in the first half of June, rose from mid June to mid August and fell over the last five weeks. The defensive ETFs are holding up better, but they are not immune to broad market weakness.
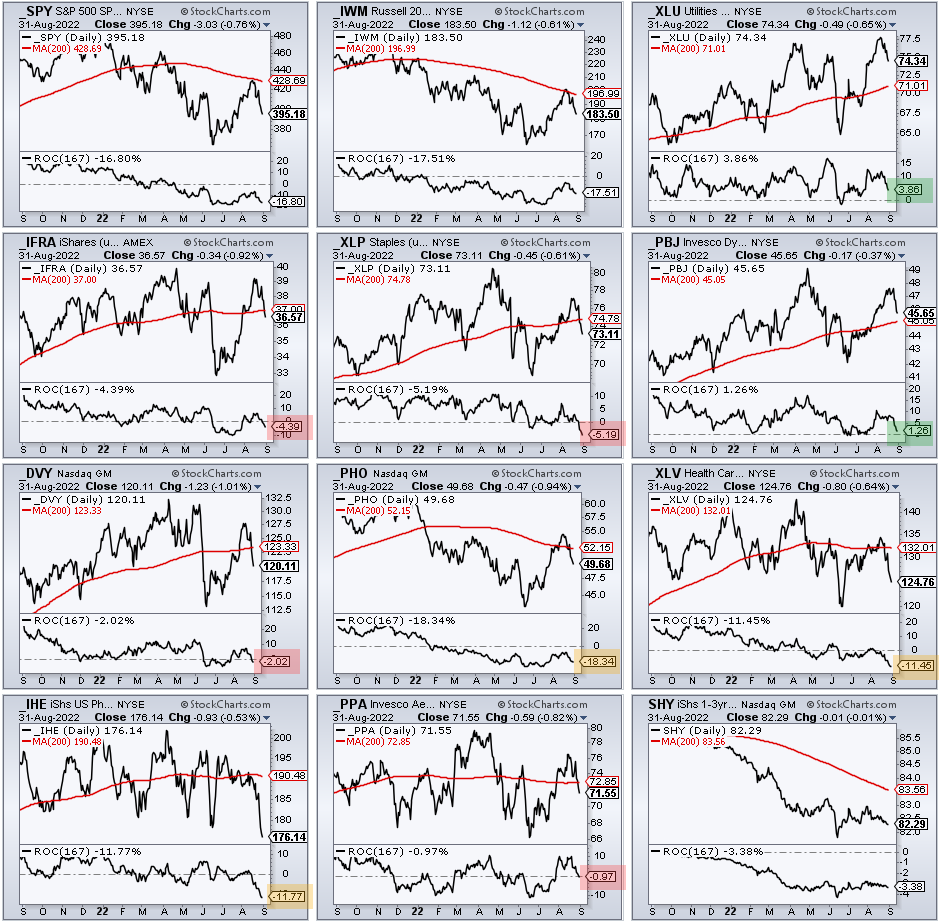
The next image shows CandleGlance charts for SPY, IWM, the eight defensive groups, the Medical Equipment ETF (IHE) and the 1-3 Yr Treasury Bond ETF (SHY). The Utilities SPDR (XLU) is the only one that is above its 200-day SMA (upper right). The Food & Beverage ETF (PBJ) and Utilities SPDR (XLU) are the only two ETFs showing gains year-to-date (green shading). SPY is down 16.8% so far this year. The Water Resources ETF (PHO), Medical Equipment ETF (IHE) and Healthcare SPDR (XLV) are down double digits this year (yellow shading). The four other defensive ETFs are down much less than SPY and holding up better (IFRA, XLP, DVY, PPA).
You can learn more about exit strategies in this post, which includes a video and charting options for everyone.
Gasoline Weighs on DBE (RB1!, CL1!, DBE)
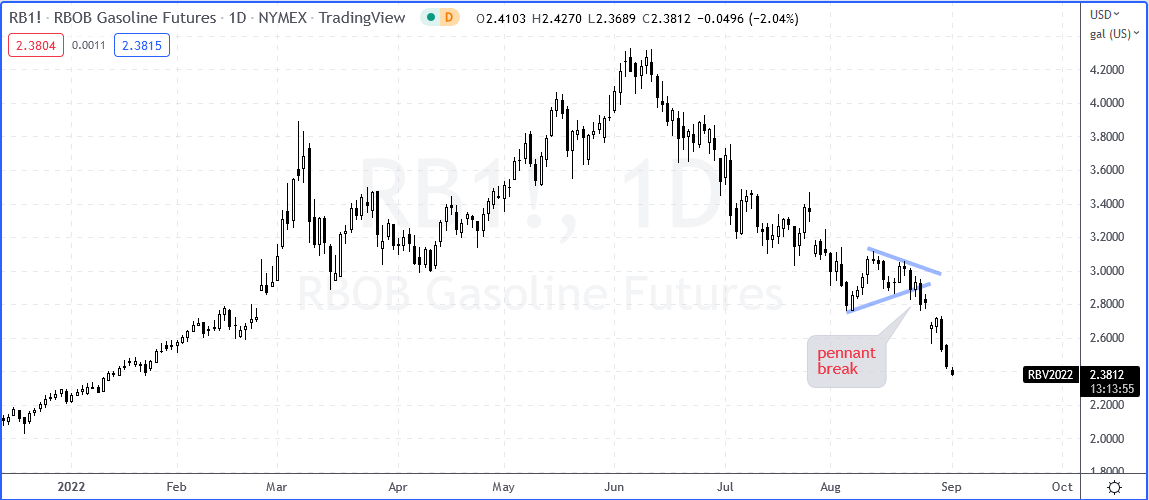
Gasoline is a big component in the DB Energy ETF (DBE) with NY Harbor Unleaded accounting for 28% and Gasoline 19%. Gasoline is the weakest of the three components (oil, gasoline, natural gas). The chart below shows NYMEX Gasoline Futures (RB1!) breaking down from a pennant and falling sharply the last two weeks. This could be tied to the breakdown in the stock market and the potential for slowing demand.
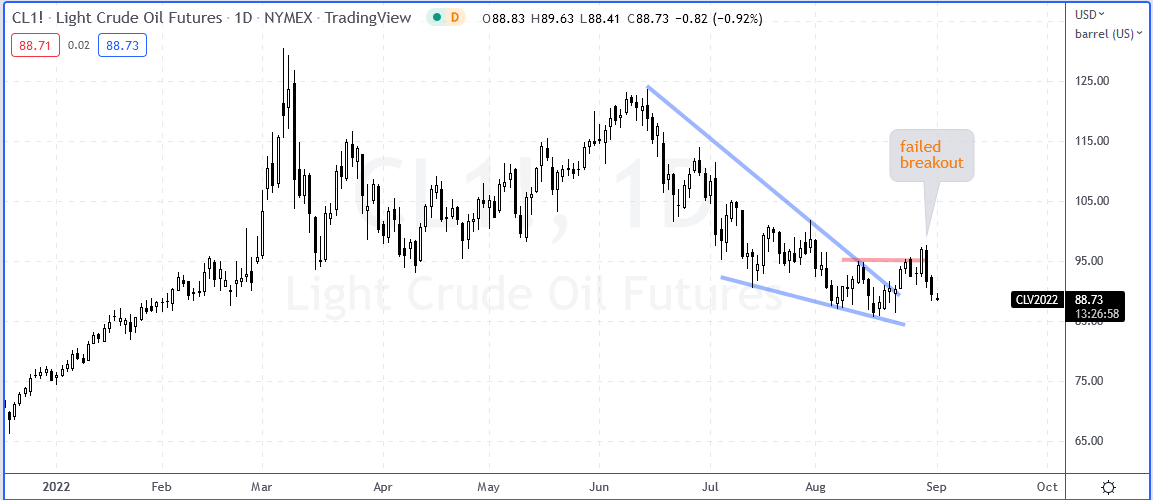
The next chart shows Light Crude Futures (CL1!) breaking out of a falling wedge with a surge on Monday and then giving it all back with two big down days. This breakout is failing and weighing on DBE.
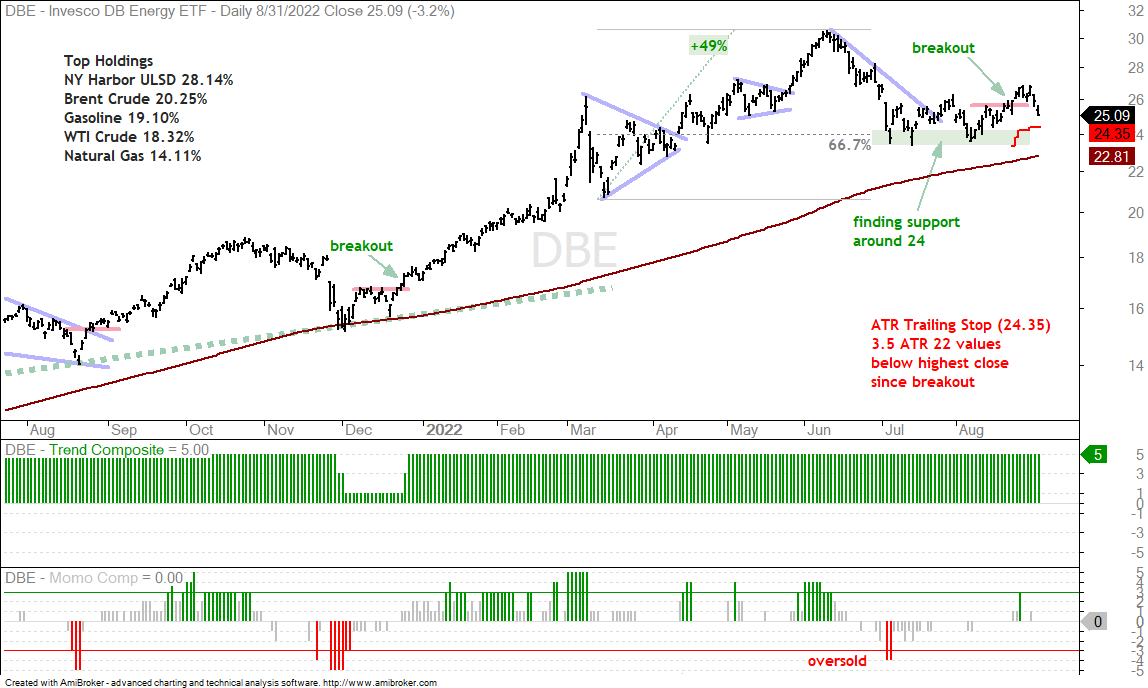
After hitting a new high and retracing 2/3 of the prior advance, DBE firmed in the 24 area for a few weeks and broke out in late August. This breakout is also failing as DBE fell back sharply the last two days. The red line marks the ATR Trailing Stop at 24.35, which is 3.5 ATR(22) values below the highest close since the breakout.
The Trend Composite aggregates signals in five trend indicators: Bollinger Bands (125,1), Keltner Channels (125,2), 5-day Rate-of-Change of 125-day SMA, StochClose (125,5) and CCI-Close (125). The Trend Composite and ten other indicators are part of the TIP Indicator Edge Plugin for StockCharts ACP
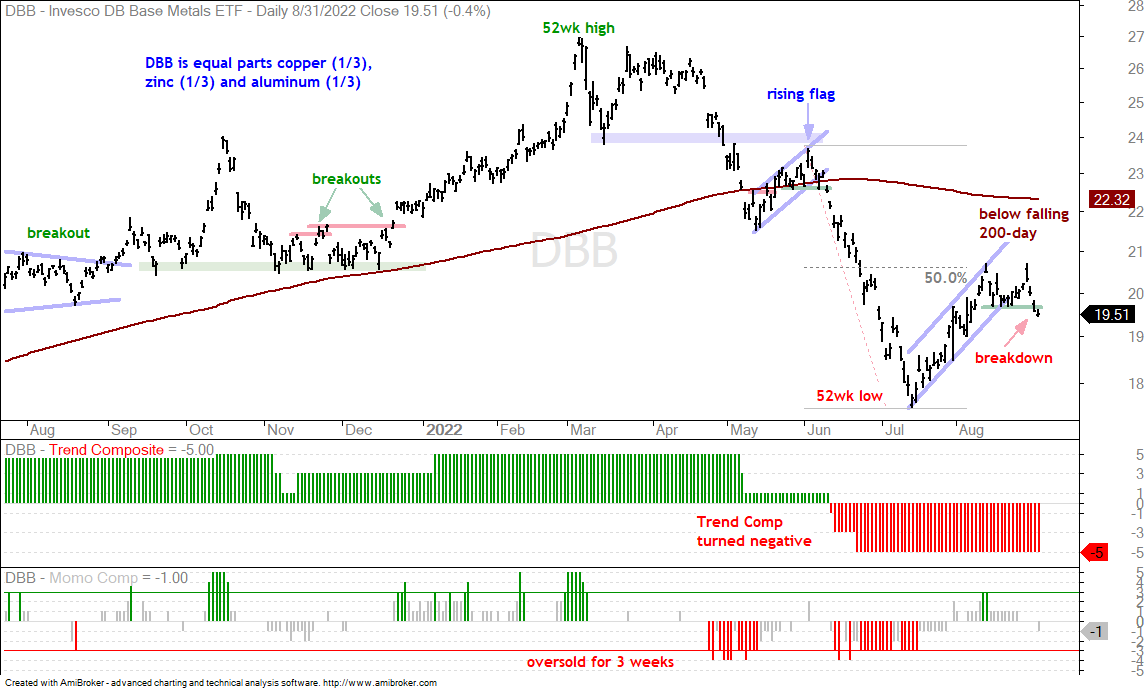
Copper Leads Base Metals Breakdown (DBB, CPER, COPX)
The demand for base metals is also similar to the demand for oil and gasoline (driven by economic performance). There are other supply factors at work as well, but these are complicated and harder to quantify. We can quantify the economic outlook simply by looking at the stock market. The chart below shows the DB Base Metals ETF (DBB) plunging to a 52-week low in mid July and then retracing half of this decline with an advance above 20. This is a normal retracement for a counter-trend bounce within a bigger downtrend. A rising channel of sorts also formed and DBB broke support with a sharp decline the last three days. This signals a continuation of the bigger downtrend.
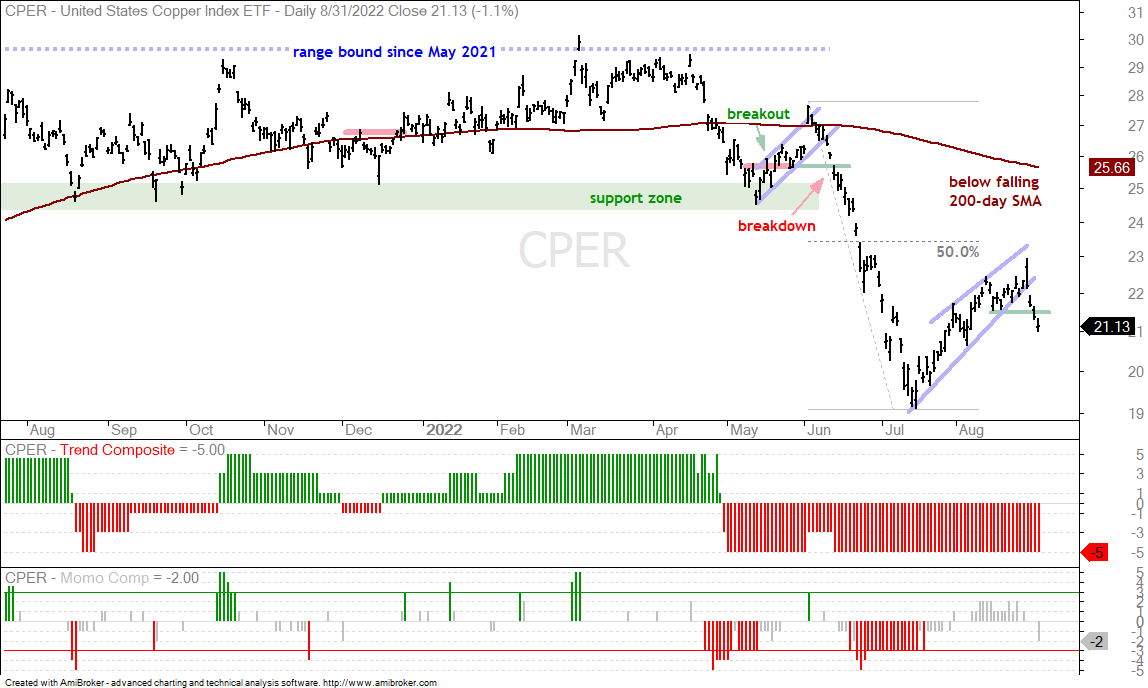
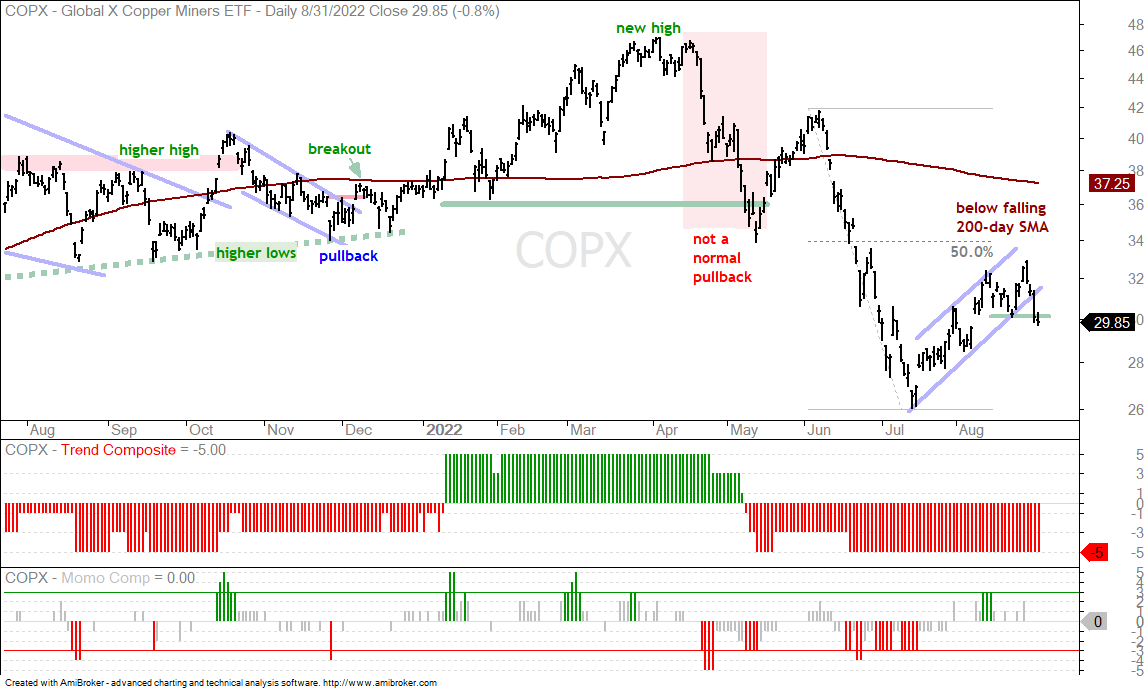
The next charts show the Copper ETF (CPER) and Copper Miners ETF (COPX) with similar characteristics.
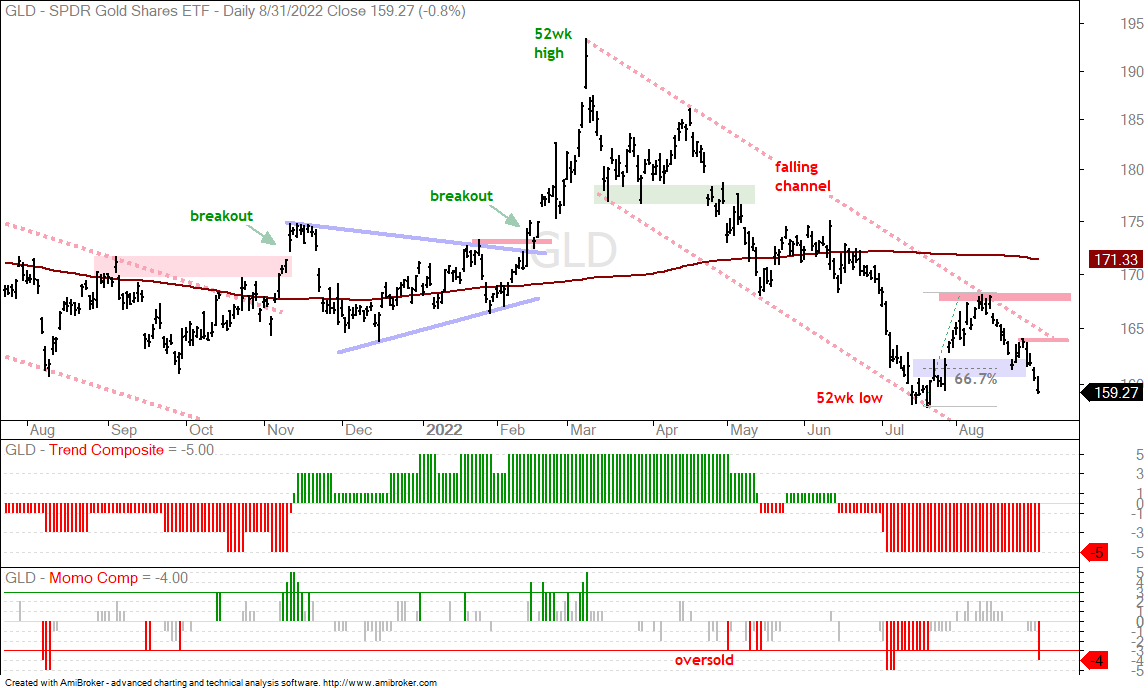
Precious Metals Not Offering an Alternative (GLD)
Precious metals are not offering a viable alternative to stocks with the Silver ETF (SLV) and Gold Miners ETF (GDX) hitting new lows, and the Platinum ETF (PLTM) testing its mid July lows. The Gold SPDR (GLD) is also in a downtrend and nearing its July lows. Last week I was watching GLD as it bounced near a support/reversal zone (blue shading). There was and is one BIG problem with this short-term setup. The bigger trend was and is down. This is the dominant force at work and this force acts as a headwind for short-term bullish setups. In other words, the chances of a successful long trade are reduced when the bigger trend is down. GLD did not close above 164 to trigger a breakout and fell sharply the last four days.
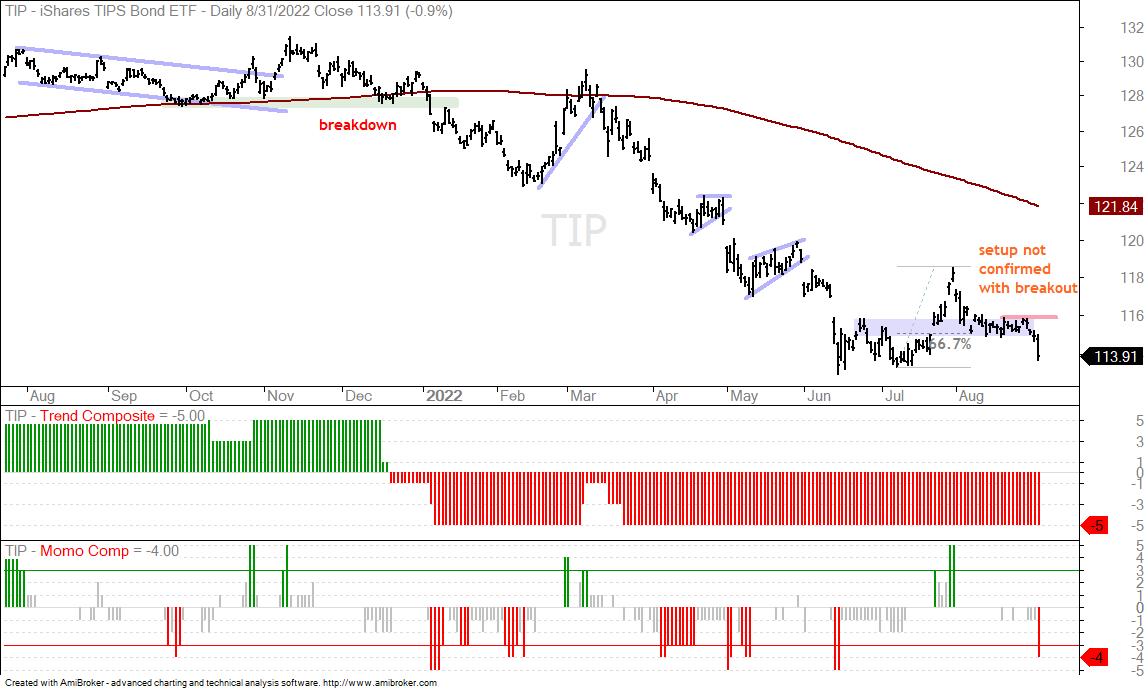
Inflation-Protected Bond ETF Plunges (TIP)
The Inflation-Protected Bond ETF (TIP) was also featured as a short-term setup last Thursday, but never broke out at 116 for confirmation and fell sharply on Wednesday. The short-term setup was similar to the setup in GLD as TIP firmed in the resistance-reversal zone. As with GLD, the long-term trend was down and this was a short-term setup with the wind in its face.
TLT Fails to Bounce as 10-yr Treasury Yield Rises (TLT, $TNX)
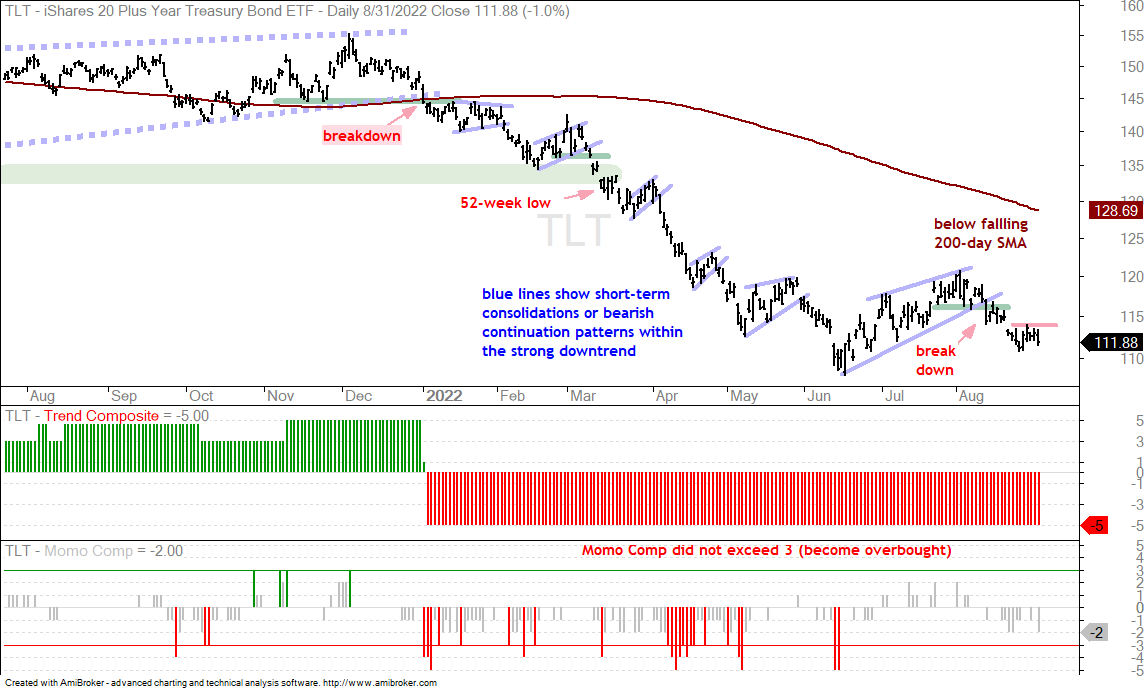
The Inflation-Protected Bond ETF (TIP) is still a bond and aligned with the price moves in Treasury bonds. Treasury bonds are the natural alternative to stocks, but SPY and TLT have been positively correlated in 2022 (moving in the same direction). The long-term trend for the 20+ Yr Treasury Bond ETF (TLT) is down and the ETF broke rising wedge support on August 11th. This break reversed the short-term uptrend and signaled a continuation of the long-term downtrend. Even though TLT managed to firm the last five days, it has yet to break short-term resistance based on last week’s high and show any material signs of strength. The only reason I am marking short-term resistance is because the stock market is extremely weak and money may find its way into the bond market as a safe haven.
You can learn more about the ATR Trailing Stop and exit strategies in this post, which includes a video and charting options for everyone.
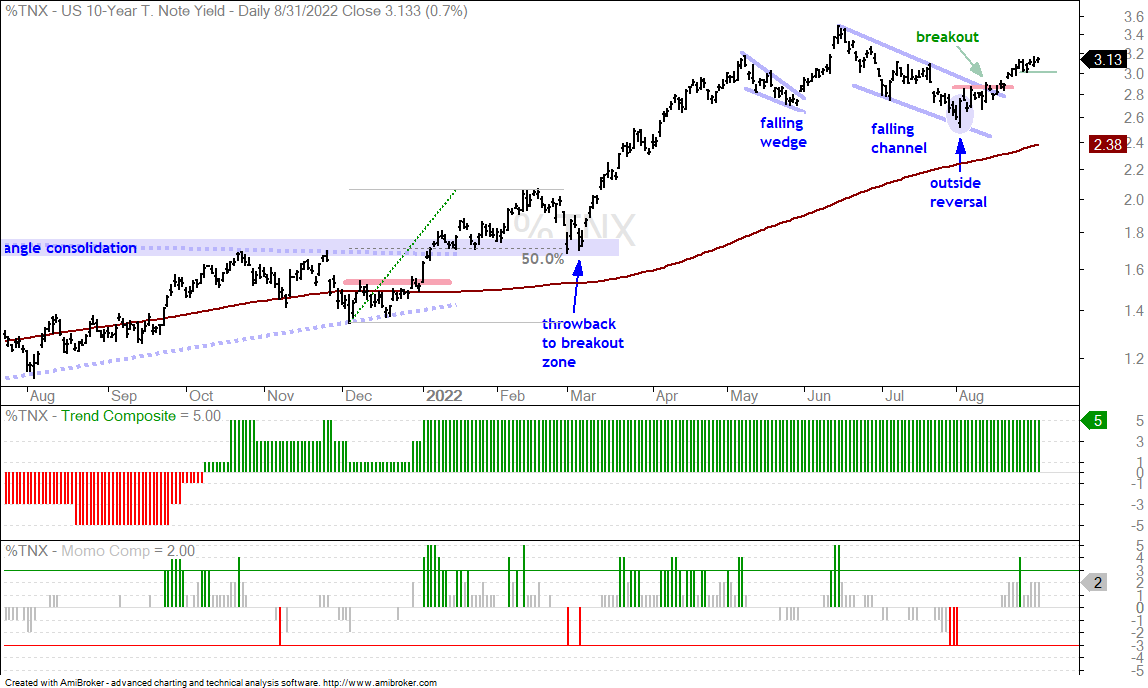
The 10-yr Treasury Yield ($TNX) is in an uptrend and broke out of a falling channel on August 11th, the same day TLT broke down. The channel breakout signals a continuation higher and projects a move above 3.5%. The green line at 3% marks short-term support.
")